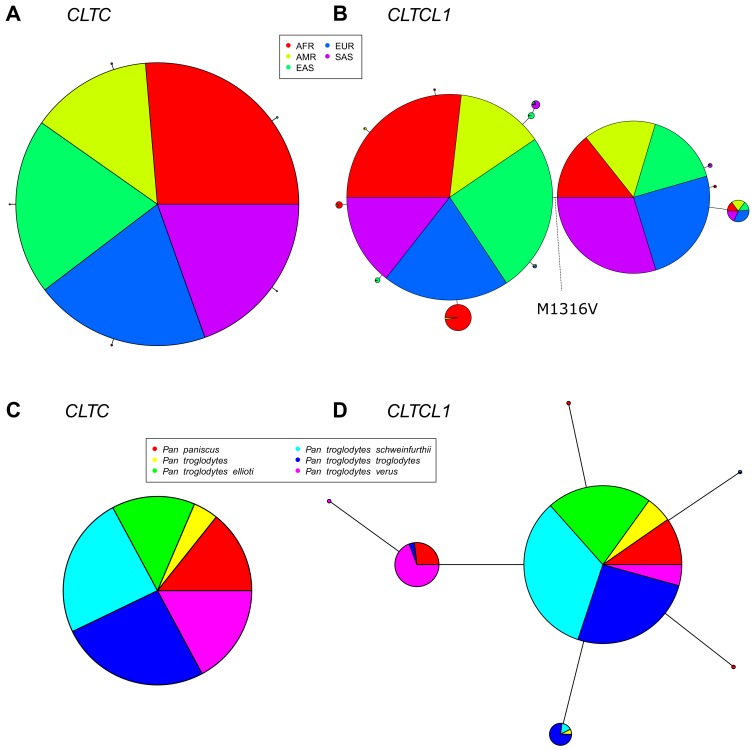
Figure 3. The CLTCL1 gene encoding human CHC22 has two major variants, and is highly polymorphic relative to the human CLTC gene encoding CHC17, with a similar pattern in chimpanzees.
Median joining network of human alleles for CLTC (A) and CLTCL1 (B) are shown. Each circle represents a unique allele whose global frequency is proportional to its circle’s size and the line length between circles is proportional to the number of non-synonymous changes between alleles. For CLTC, the least common alleles have a frequency ranging from 0.04% and 0.06% and the circles representing them were magnified by a factor of 10. For CLTCL1, only alleles with a frequency greater than 20% were plotted. The two major alleles show a combined frequency of 77% while the other alleles depicted in the figure have a frequency ranging from 0.44% to 5.67%. Segregation of the M1316V variation is depicted with a hashed line, with alleles carrying the M variant on the left-hand side, and alleles carrying the V variant on the right-hand side. The meta-populations in which the allele is found are indicated in color representing their percentage of the total frequency of the allele in humans. Meta-populations analyzed are African (AFR), American (AMR), East Asian (EAS), European (EUR), South Asian (SAS). (C–D) Median joining network of CLTC (C) and CLTCL1 (D) alleles for chimpanzees (Pan troglodytes, four identified subspecies and one unidentified) and bonobos (Pan paniscus). The species and subspecies in which each variant is found are indicated in color representing their percentage of the of the total frequency of the variant in chimpanzees and bonobos.


