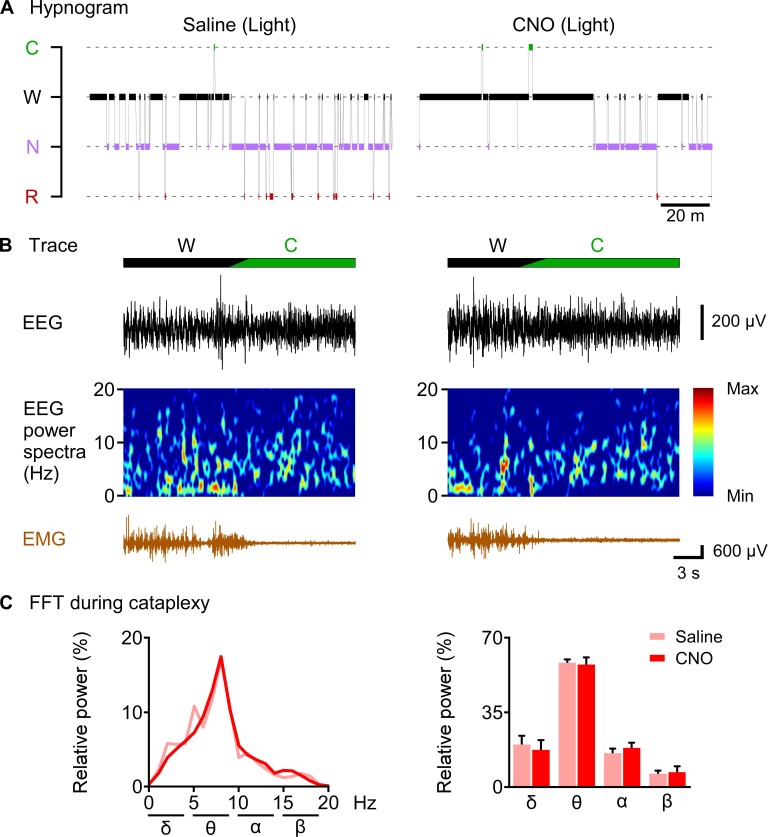
Figure 8. CNO-induced cataplexy was not different from naïve cataplexy.
(A) hypnogram of 2 hr after saline or CNO administration. (B) typical traces showing EEG signal, EEG power spectrum and EMG of cataplexy episode. (C) line graph (left) and bar graph (right) showing relative power spectrum of EEG during cataplexy episode in the light period (n = 8 mice). Data represent the mean ± SEM in both the line and bar graph.

