

Abstract
The antibacterial effect of ZnO nanoparticles is tested against Staphylococcus aureus, (a Gram-positive pathogenic bacterium) from a particle-size, concentration, and surface-defects point of view. Activation of antibacterial activity was achieved by standard well diffusion agar and minimum inhibitory concentration procedures. Our results show that smaller-sized particles are more effective inhibitors of bacterial activity when used in a certain optimum concentration. To reveal the underlying mechanism of the observed size and concentration-dependent bacterial activity inhibition, we measured the concentrations of Zn2+ ions released in each suspension by an inductive couple plasma optical emission spectrophotometer. Additionally, photoluminance spectra of our samples show significant surface defects (mainly oxygen vacancies) that generate reactive oxygen species. The underlying mechanism of the observed size- and concentration-dependent bacterial activity inhibition is attributed primarily to the release of Zn2+ ions and generation of reactive oxygen species that interact and penetrate the cell membrane, causing lethal damage to the cell. Finally, the antibacterial effectiveness and maximum sensitivity of our nanoparticles is confirmed by optical density measurements.
Keywords: Zinc oxide, Reactive oxygen species ROS, Zn2+ ion release, Antibacterial activity mechanism, Nanoparticles
Introduction
During the last couple of decades, nanotechnology has emerged as a significant and innovative research area due to its direct relevance with science and industry. Most of the applications of nanomaterials are based on their optical, electronic, and magnetic features, which are generally very different from their bulk counterparts [1]. Nanomaterials have also played a significant role in modern medicine. Nanomaterials may have many medical applications, including the eradication of tumor cells [2]. In this context, nanomaterials exhibit a number of unique properties regarding catalytic inhibition of bacterial activity, anti-inflammatory and wound-healing properties. In general, inhibitors of bacterial growth are divided into two broad categories, viz., organic and inorganic. Organic antibacterial agents (both naturally occurring and synthetic) inhibit the growth of a variety of bacteria and fungi [3]. However, they have some shortcomings, such as short life expectancy, high decomposability, and low heat resistance. This limits their use as antibacterial agents in most applications. On the other hand, inorganic antibacterial agents have received considerable recognition in industries of antibacterial products because of their improved safety and stability at higher temperatures in an ambient atmosphere [4]. Various types of inorganic semiconducting nanomaterials such as zinc oxide (ZnO), magnesium oxide (MgO), titanium dioxide (TiO2), and copper oxide (CuO) have shown a certain degree of antibacterial activity. In particular, ZnO has emerged as one of the most promising wide-band-gap inorganic materials for a variety of applications such as fluorescence imaging, X-ray imaging, scintillations and bacterial activity inhibitor, anticancer agent and sunscreen lotions ingredient, etc. [5, 6]. It has been shown that [1] ZnO nanoparticles can be used for food safety as they can protect agricultural crops and products from food-borne pathogens. Pasquet et al. [7] demonstrated the antibacterial activity of ZnO nanoparticles against some specific organisms such as Bacillus subtilis, Escherichia coli, and Pseudomonas fluorescens. Yamamoto [8] showed that antibacterial activity of ZnO nanoparticles against Staphylococcus aureus and Escherichia coli bacteria increases with decreasing particle size. These authors used ZnO particles having a size ranging from 100 to 800 nm. Different studies have attempted to explain the underlying mechanism of inhibition of bacterial cell activities. It has been proposed that ZnO nanoparticles undergo a size-dependent interaction with bacteria via surface defects (predominantly oxygen vacancy). This interaction leads to the formation of reactive oxygen species (ROS) [9] and lipid peroxidation [10]. Other studies have suggested that ZnO nanoparticles smaller than 12 nm inhibit the growth of E. coli by increasing the permeability of the cell membrane, which eventually leads to inconvenient disintegration of the cell wall [11]. Some reports describe the process of bacterial cell activity inhibition in terms of agitation of bacterial cell wall integrity. This cell wall agitation is ascribed to its direct interaction with ZnO nanoparticles [12]. The underlying mechanism of bacterial activity inhibition is governed by the release of antimicrobial ions (Zn2+) and interaction of ROS with the cell wall [13]. Despite these plausible explanations, findings from various studies are often contradictory. Therefore, the exact mechanism of bacterial inhibition is still unclear. The present study aims to understand the mechanism of the inhibition of bacterial activity by chemically engineered ZnO nanoparticles of different sizes from the view of Zn2+ ion release and ROS generation as a function of particle size and concentration. Our results suggest that the interaction of Zn2+ ion release and ROS with the cell wall collectively contributes to the nanotoxicity threshold required for bacterial cell inactivation.
Materials and methods
Synthesis of different-size zinc-oxide nanoparticles was achieved through a two-step process [14]. Zinc nitrate (Sigma-Aldrich), sodium hydroxide (Sigma-Aldrich), and deionized water were received as precursors and used without additional purification. In the first step, a 0.5 M aqueous solution of hexahydrate zinc nitrate (Sol-A) and a 0.9 M aqueous solution of sodium hydroxide (Sol-B) were prepared under vigorous magnetic stirring for 1 h. In the second step, Sol-B was added dropwise into Sol-A under high-speed constant stirring. The reaction was further carried out for 2 h. The final product was sealed and allowed to settle overnight. The precipitates were separated by centrifugation at 4000 rpm and washed three times with ethanol and deionized water. As-received powder was kept in an oven in ambient condition for 12 h at 60 °C. From now on, the as-prepared sample is denoted by Z-1. The as-prepared samples annealed at 200, 400, and 600 °C are denoted by Z-2, Z-3, and Z-4, respectively. Crystallite size, phase purity, lattice spacing, and lattice parameters were determined by X-ray diffraction (XRD) analysis using Cu-Kα radiation at 40,000 eV in the range of 2θ = 20–70°. Transmission electron microscope (TEM) images were recorded with a JEOL (JEM 2010) electron microscope at an accelerating voltage of 200 kV. Photoluminance (PL) spectra were taken on a Perkin-Elmer LS-55 luminescence spectrophotometer. The concentration of Zn2+ ions released in each suspension is measured by using an inductive couple plasma optical emission spectrophotometer (ICPMS, Perkin-Elmer SCIEX-6100). Standard Zn ion ICP solution (Merck, Germany) was used as a reference.
The antibacterial activities were examined by the well diffusion method. About 25 ml of sterile nutrient agar was dispensed into sterile Petri dishes and left for solidification. Pure culture of Staphylococcus aureus was refreshed in a nutrient broth on an orbital shaker at 100 rpm for 2 h. A sterile swab was dipped into the broth culture, slightly tapped to remove additional fluid, and used to make a fine lawn on the nutrient agar plate. Thereafter, 6-mm wells were made into the nutrient agar plates by using a sterile cork borer for testing antibacterial activity of nanoparticles. Finally, 100 μl of the ZnO nanoparticle suspension of different concentrations was dispensed into each well and the plates were left overnight for incubation at 37 °C. The diameters of zones of inhibition were measured after incubation.
Measurement of optical density (OD) to evaluate bacterial growth is one of the simplest methods to assess the cytotoxicity of antibacterial agents. The density of bacterial cells in liquid culture was estimated by taking the optical density of the liquid bacterial culture at 630 nm by a UV-Visible spectrophotometer. Nanoparticles were dispersed in distilled water by ultrasonication to prepare a stock solution. For our experimental investigations, a freshly grown (24 h) culture of Staphylococcus aureus (100 μl) was inoculated to a series of 50 ml media containing a 100 μl/ml concentration of ZnO nanoparticles at constant shaking. One sample was taken as control, without loading nanoparticles. In the liquid medium, the growth of Staphylococcus aureus was calculated by taking OD at 630 nm against abiotic control after every 24 h up to 72 h.
Results and discussion
Figure 1 shows XRD spectra of as-synthesized (Z-1) and annealed samples (Z-2, Z-3, Z-4). All samples exhibited a ZnO Wurtzite phase with a high intense characteristic peak. All the observed peaks (100), (002), (101), (102), (110), (103), and (112) can easily be identified in Bragg’s reflection associated with the hexagonal Wurtzite phase of ZnO (JCPDS Card No 01-089-0510). The peak broadening in XRD patterns clearly indicates the presence of small crystallites in the samples. The lattice constants a and c, of all nanoparticles, as calculated from the peak position of (100) and (002) planes, respectively, were small in comparison with the bulk value of 5.205 °A. This indicates that nanoparticles were under compressional stress. It is clear from Fig. 1b that the lattice constant first shows a marginal decrease with increasing particle size from 8 to 46 nm beyond which it shows an abrupt decrease for the sample having a particle size of 59 nm. The shrinkage of lattice with increasing annealing temperature has been reported previously for a similar system [7] and is explained in terms of reduced ionic valences, electrostatic relaxation and surface dipole interactions [15]. The information about size, shape, and morphology of nanoparticles were recorded using TEM. It can be seen from Fig. 2a–d, the nanoparticles are well defined and small, spherically shaped with some facets. The size of particles and their distribution were estimated by the histogram shown in the inset of Fig. 2a–d. This histogram was obtained by examining numerous frames of images. The average particle sizes as estimated from TEM images are 8, 15, 46, and 59 nm for Z-1, Z-2, Z-3, and Z-4 samples, respectively.
Fig. 1.

a XRD patterns of ZnO nanoparticles; b growth of ZnO nanoparticles with increasing annealing temperature; c contraction of lattice parameters with increasing particle size
Fig. 2.
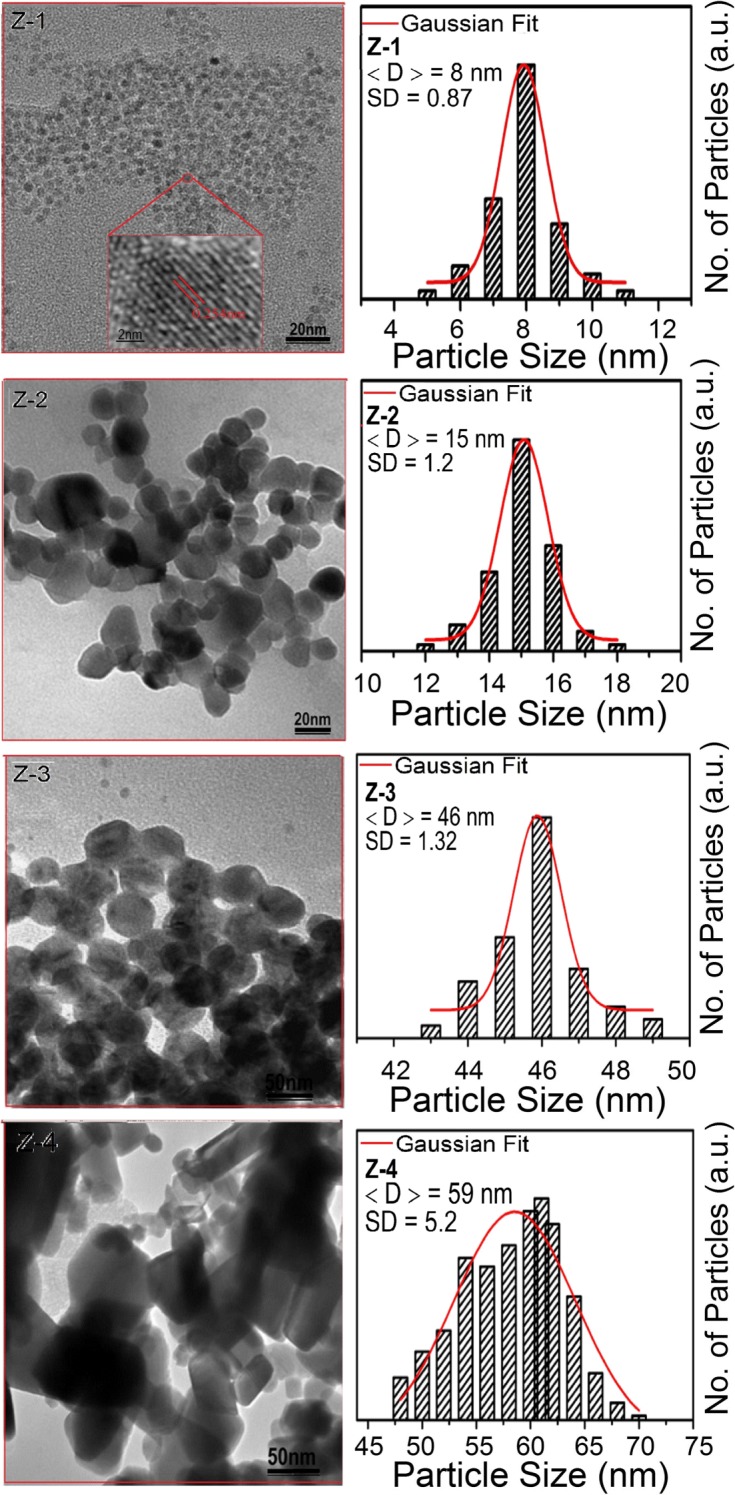
TEM images of ZnO nanoparticles. Corresponding size distribution with Gaussian fitting is also shown adjacent to the TEM images
PL spectroscopy is a powerful tool for studying variation in oxygen vacancy concentration in ZnO nanoparticles, which we will later link with ROS generation. PL spectra of our samples were recorded in the wavelength range of 400–700 nm at an exciting wavelength of 325 nm. Figure 3a, b shows PL spectra of our samples. All the samples exhibit a general feature of a broadband known as the green-orange band (about 400–700 nm). The exact origin of this band in the visible region is still unclear. However, there is a general consensus that various types of point defects on the surface are responsible for this green-orange band [16]. Charged oxygen vacancies (doubly charged vacancy, V++ and singly charged vacancy, V+), interstitials and zinc vacancies are the most common types of defects reported in ZnO-related nanoparticles [17]. Ghosh et al. showed that the broadband emission in the visible region originates from charged oxygen vacancies located near the surface of the nanoparticles. This is further supported by the fact that the intensity of this emission is highly sensitive to the surface to volume ratio of nanoparticles [18]. We fitted the broad visible emission peak with two Gaussian peaks; the low-intensity peak (P1) extracted from the shoulder and the high-intensity peak (P2) at about 2.5 eV (500 nm) and 2.2 eV (550 nm). It has been suggested [19] that peaks P1 and P2 are associated with singly ionized and doubly ionized oxygen vacancies, respectively. Next, we examine the relative area under the curves of peaks P1 and P2 for the samples with different particle sizes. Physically, the relative areas under peaks P1 and P2 represent, at least qualitatively, the concentration of and the concentration of , respectively. As pointed out earlier, the peaks P1 and P2 emission band, originated from and , are sensitive to the size of the nanoparticles [20]. The areas under peaks P1 and P2, as a function of particle size, are shown in Fig. 3b. Clearly, the concentrations of oxygen vacancies (both and ) show a systematic decrease with an increasing particle size. The absorption behavior and the band gap energy of our synthesized ZnO nanoparticles are more clearly understood by the diffuse reflectance spectroscopy (DRS) results shown in Fig 4a. For the energy band gap of ZnO nanoparticles, the DRS spectra are treated with the Kubelka–Munk function F(R) [21];
where is the percentage reflectance. The reflectance spectra are plotted in Fig. 4b between the square of the K-M function F(R) and energy in electron volts. The band gap energies are deduced by extrapolating the linear part of the curve to the F(R)2 axis as shown in Fig. 4b. The optical band gap of the synthesized sample (Z-1) was found to be 3.58 eV. The linear fit of the reflectance edge is found to be shifted towards the lower energy side with increasing particle size (Fig. 4b). This particle size-dependent shift in the optical band gap is found to be consistent with the literature [22].
Fig. 3.
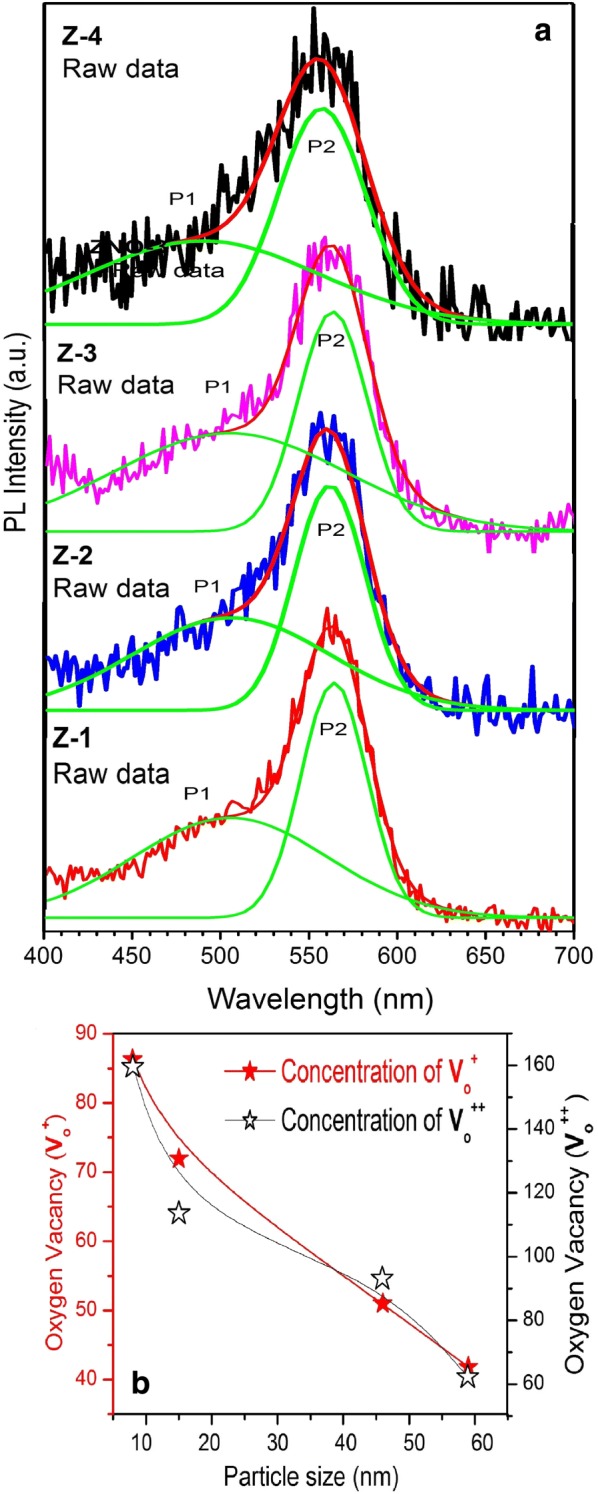
a PL spectra of Z-1, Z-2, Z-3, and Z-4 samples. Green curves are Gaussian-fitted curves; (b) concentration of oxygen vacancies and for different particle sizes
Fig. 4.
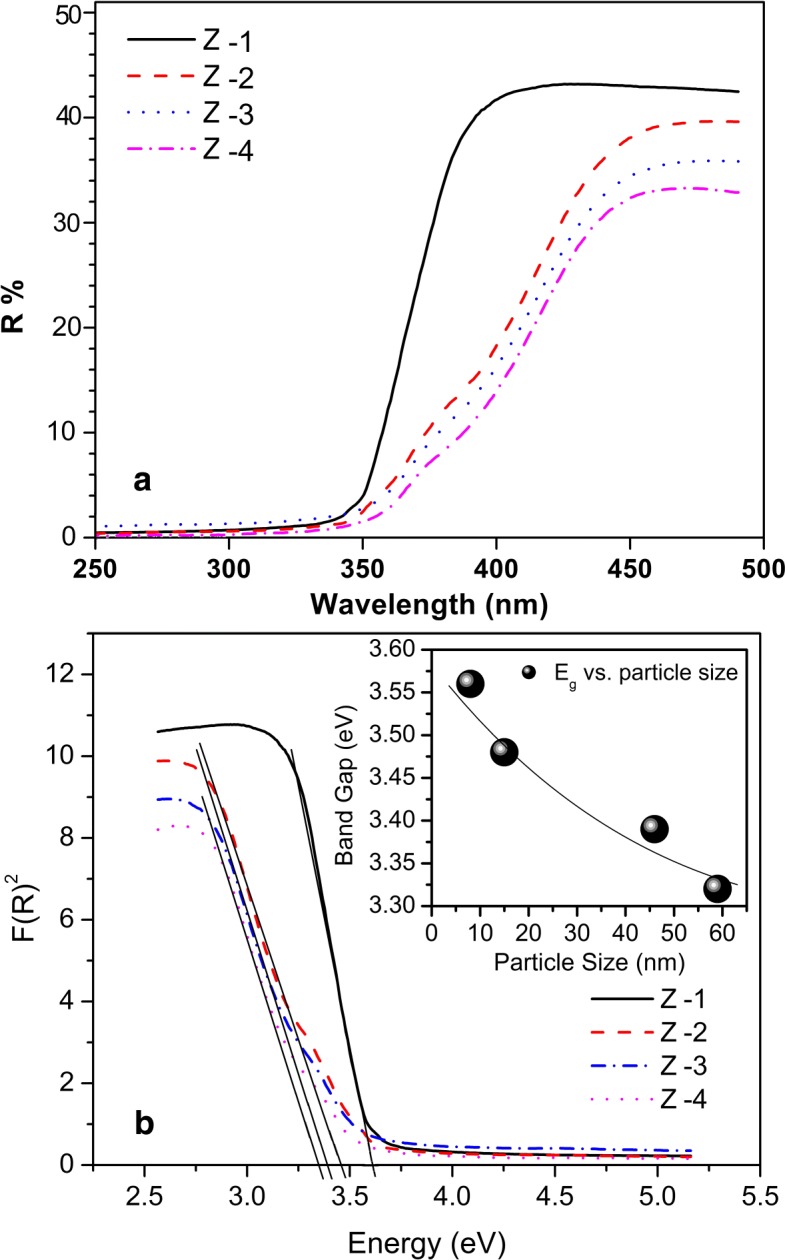
a Diffuse reflectance spectra of ZnO nanoparticles; b the spectra are plotted in terms of the square of the K-M function F(R) against energy in electron volts; inset: energy band gap as a function of particle size
We also conducted a detailed study on the role of particle size and concentration for the antibacterial activity of ZnO nanoparticles against Staphylococcus aureus. Four aqueous solutions of ZnO nanoparticles in different concentrations were tested. Figure 5a shows the resulting zone of inhibition observed against Staphylococcus aureus due to ZnO nanoparticles. The bar graphs of Fig. 5b compare the sizes of the observed zone of inhibitions (Table 1) produced by different samples. Clearly, the zone of inhibition created by the smallest particle sized sample (Z-1) was found to be larger (~19 mm) as compared to larger-sized particles. The fact that sample Z-1 is found to be more toxic than other samples is attributed to a larger surface area-to-volume ratio of Z-1 samples as compared to larger-particle-size samples [23]. Smaller-sized particles can effectively interact with bacterial membranes due to their large surface area, thus enhancing their antibacterial efficiency [24]. This size dependency of antibacterial activity has been shown to be affected by the concentration of nanoparticles [25]. As shown in Table 1, the largest zone of inhibition was achieved for the 100 μg/ml concentration of Z-1 nanoparticles as compared to other concentrations (50 and 150 μg/ml) of the same sample. On the other hand, the concentration of 200 μg/ml shows no measurable inhibitory effect. For a given particle size, a minimum inhibitory concentration (MIC) of 50 μg/ml creates a relatively larger zone of inhibition (Table 1). All concentration samples having a smaller particle size generate a larger zone of inhibition. Although ZnO nanoparticles have shown significant antibacterial activity, the exact toxicity mechanism is still unclear. A number of plausible explanations have been proposed in the literature [24]. These include direct interaction of ZnO nanoparticles with the cell walls, generation of antimicrobial Zn2+ ions [26] and formation of ROS [27]. The latter comprises superoxide anion (O2−2), hydrogen peroxide (H2O2) and hydroxide (OH−). The antibacterial effect of these ROS is due to their penetration in the cell membrane that triggers subsequent oxidative damage to vital components of the cell. However, this toxicity mechanism has been shown to be a dominant mechanism only under UV exposure [24]. Another widely accepted mechanism that could account for the observed nanotoxicity of our ZnO against bacteria is the release of Zn2+ ions in medium containing ZnO-NPs and bacteria [28]. This dissolution of Zn2+ ions depends on particle size and concentration of the solution. In order to test this mechanism, we systematically quantified the concentration of Zn2+ ions released in each solution of different-sized nanoparticles in different concentrations by using an ICP-MS. Our kinetic measurements revealed that the dissolution of Zn2+ ions reaches a steady state within 10 h (data not shown here). However, in order to ensure complete dissolution, data were recorded after 24 h. Figure 6a shows the concentration of released Zn2+ ions as a function of particle size. Clearly, solutions of smaller particle size samples in low concentrations were found to have more Zn2+ ions. This is attributed to the fact that small particles have a large surface-to-volume ratio, which ensures a relatively large fraction of atoms at the facets and corners of the surface [1]. Thus, release of Zn+2 becomes more pronounced with decreasing particle size. The estimated values of Zn+2 concentrations in ZnO suspensions of different concentrations and particle sizes are shown in Table 2. Note the excellent agreement between the estimated Zn+2 concentrations (Table 3) and measured zones of inhibitions (Table 1). Suspensions having larger Zn+2 concentrations create larger zones of inhibitions and turn out to be more toxic against micro-organisms. Thus, the antibacterial activity of our ZnO nanoparticles originates mainly from the release of Zn2+ (Table 2).
Fig. 5.

a Zone of inhibition of ZnO nanoparticle; b bar graph showing zone of inhibition introduced by ZnO nanoparticles against S. aureus
Table 1.
Zones of inhibition of ZnO nanoparticle against S. aureus
| Samples | Zone of inhibition of S. aureus (mm) at various concentration | |||
|---|---|---|---|---|
| 50 μg/ml | 100 μg/ml | 150 μg/ml | 200 μg/ml | |
| ZNO-1 | 18 mm | 19 mm | 14 mm | 0 mm |
| ZNO-2 | 17 mm | 16 mm | 12 mm | 0 mm |
| ZNO-3 | 16 mm | 13 mm | 11 mm | 0 mm |
| ZNO-4 | 14 mm | 11 mm | 10 mm | 0 mm |
Fig. 6.

a Concentration of released Zn2+ ions in nanoparticle solutions of different concentrations (mentioned in the labeling) as a function of particle size. Standard Zn ion ICP solution (Merck, Germany) was used as reference. b Time evolution optical density (OD) measured at 630 nm for different particle sized samples. The OD spectrum of the control sample is also shown as reference
Table 2.
Estimated values of Zn+2 concentrations in ZnO suspensions of different concentrations and particle sizes are shown in Table 3
| No. | Conc. of ZnO (μg/ml) | Conc. of Zn2+ ions (μg/ml) Z-1 [8 nm] | Conc. of Zn2+ ions (μg/ml) Z-2 [15 nm] | Conc. of Zn2+ ions (μg/ml) Z-3 [46 nm] | Conc. of Zn2+ ions (μg/ml) Z-4 [59 nm] |
|---|---|---|---|---|---|
| 1 | 50 | 5.93 ± 0.02 | 5.66 ± 0.03 | 5.24 ± 0.02 | 4.68 ± 0.02 |
| 2 | 100 | 6.33 ± 0.01 | 5.53 ± 0.02 | 4.33 ± 0.03 | 3.53 ± 0.03 |
| 3 | 150 | 4.35 ± 0.02 | 4.01 ± 0.04 | 3.73 ± 0.01 | 3.38 ± 0.01 |
| 4 | 200 | 0.85 ± 0.03 | 1.45 ± 0.01 | 0.86 ± 0.02 | 1.12 ± 0.01 |
Table 3.
Growth rate of S. aureus in the presence of ZnO nano particles
| Time (h) | Optical density (O. D) at 630 nm | ||||
|---|---|---|---|---|---|
| Control | Z-1 | Z-2 | Z-3 | Z-4 | |
| 24 | 1.072 | 0.720 | 0.790 | 0.809 | 0.823 |
| 48 | 0.980 | 0.644 | 0.674 | 0.701 | 0.712 |
| 72 | 0.910 | 0.602 | 0.600 | 0.600 | 0.627 |
In addition to the aforementioned mechanism, there are other factors that are of relevance for the antibacterial activity of ZnO nanoparticles. In particular, surface defects and surface charges have been shown to play a very important role for antibacterial activity [25]. The surface of the ZnO nanoparticle comprises numerous edges and corners that are generally highly responsive to electrostatic interactions. The presence of edges and corners at the surface of ZnO nanoparticles has been shown to enhance their antibacterial activity by causing membrane injury [25]. In our PL study, we found that a lower-size particle carries more oxygen vacancy concentration. It was found that the surface of ZnO nanoparticles appeared to be positively charged. Therefore, a positive charge over the surface effectively increases with increasing oxygen vacancies as it goes from higher to lower particle size [29]. As a result, the attraction between the positively charged particles and the negative cell wall surface increases, which endorses the antibacterial activity. The key mechanism by which these particles exhibited antibacterial activity could be through oxidative stress generated by ROS. Reduction in particle size results in greater structural defects (mainly oxygen vacancies) and changes the electronic properties on the particle surface forming ROS on the surface of nanoparticles, including OH− (hydroxyl radicals), H2O2 (hydrogen peroxide) and O2 (superoxide radicals) [30]. OH− and O2 cannot penetrate the cell wall because they contain a negative charge. Thus, they remain in close contact with the external surface of the bacteria. In contrast, H2O2 can easily enter the cell wall [31]. Since the ZnO nanoparticle generally carries a number of defects due to the presence of un-compensated bonds, these defects produce electron-hole pairs (e−, h+) through UV illumination over the surface of the nanoparticles. These electron-hole pairs could produce ROS as follows [32]: once ZnO nanoparticles enter the growth medium they keep on releasing peroxides shielding the entire surfaces of the dead bacteria. Therefore, this nonstop peroxide release takes the lead to higher bacterial efficiency [24]. In a next step, we examine the antibacterial effectiveness and maximum sensitivity of ZnO against Staphylococcus aureus. In this experiment, optical density (OD) at 630 nm is recorded at every 24 h interval up to 72 h by a UV–Vis spectrophotometer. Bacterial growth (inhibition) corresponds to a significant increase (decrease) of the OD with respect to the control sample (bacteria without nanoparticles) [24]. Figure 6b represents the time evolution of OD for different samples. The OD spectrum of the control sample is also shown as reference. Clearly, all the samples show a bactericidal effect, i.e., significant decrease of OD with time. The overall OD of the lower particle-sized sample (Z-1) is found to be smallest among all samples. This shows that the Z-1 sample was more effective bactericidal as compared to other samples. This is attributed to the toxicity of small-size nanoparticles, as the generated amount of Zn2+ is significantly higher in particles of a large surface area [24]. The duration of exposure is an important factor in any toxicity test. It can be concluded from OD data of Fig. 6 that longer exposure times (> 80 h) are essential in order to achieve a 100% antibactericidal effect of ZnO nanoparticles. In other words, the longer the incubation time with ZnO nanoparticles, the more damaging effect to the bacterial cell will be observed. This mechanism produces pressure in the cell wall, which creates more lactate dehydrogenase enzymes and leads to lyse the cell membrane and the lethality depends upon the time of exposure. These results are consistent with previous studies showing a time-dependent toxicity of ZnO nanoparticles [33].
Conclusions
In summary, ZnO nanoparticles of different size were synthesized by a chemical route. Structural analysis confirmed that ZnO was stabilized in a pure hexagonal Wurtzite phase. Furthermore, from the TEM image analyses, it was observed that nanoparticles were spherical in shape with narrow size distribution. Blue shifting in the energy band gap attributed to the decreased particle size. The antibacterial activity of lower-size nanoparticles was found to be higher as compared to that of bigger counterparts. The mechanism of bactericidal activity of ZnO nanoparticles has been correlated with the release of Zn2+ ions and formation of ROS. We believe that our work constitutes a topical and intriguing correlation between structural, optical, and antibacterial properties of ZnO nanoparticles.
Compliance with ethical standards
Conflict of interest
The authors declare that there is no conflict of interest.
Footnotes
Publisher’s note
Springer Nature remains neutral with regard to jurisdictional claims in published maps and institutional affiliations.
References
- 1.Williams MH, Stephen A. Ecotoxicity of manufactured ZnO nanoparticles–a review. Environ. Pollut. 2013;172:76–85. doi: 10.1016/j.envpol.2012.08.011. [DOI] [PubMed] [Google Scholar]
- 2.Titiwat F, Triampo W. The effects of TiO2 nanoparticles on tumor cell colonies: fractal dimension and morphological properties. Int. J. Biomed. Sci. 2007;2:67–74. [Google Scholar]
- 3.Koehn FE, Carter GT. The evolving role of natural products in drug discovery. Nat. Rev. Drug Discov. 2005;4:206–220. doi: 10.1038/nrd1657. [DOI] [PubMed] [Google Scholar]
- 4.Nagarajan P, Vijayaraghavan R. Enhanced bioactivity of ZnO nanoparticles—an antimicrobial study. Sci. Technol. Adv. Mater. 2008;9:035004. doi: 10.1088/1468-6996/9/3/035004. [DOI] [PMC free article] [PubMed] [Google Scholar]
- 5.Reddy Yadav LS, Raghavendra M, Udayabhanu, Manjunath K, Nagaraju G. Photocatalytic, biodiesel, electrochemical sensing properties and formylation reactions of ZnO nanoparticles synthesized via ecofriendly green synthesis method. J. Mater. Sci. Mater. Electron. 2018;29:8747–8759. [Google Scholar]
- 6.Reddy Yadav, L.S., Raghavendra, M., Sudheer Kumar, K.H., Dhananjaya, N., Nagaraju, G.: Biosynthesised ZnO: Dy3+ nanoparticles: biodiesel properties and reusable catalyst for N-formylation of aromatic amines with formic acid. Eur. Phys. J. Plus 133, 153 (2018). 10.1140/epjp/i2018-11963-6
- 7.Pasquet J, Chevalier Y, Couval E, Bouvier D, Noizet G, Morlière C, Bolzinger MA. Antimicrobial activity of zinc oxide particles on five micro-organisms of the challenge tests related to their physicochemical properties. Int. J. Pharm. 2014;460:92–100. doi: 10.1016/j.ijpharm.2013.10.031. [DOI] [PubMed] [Google Scholar]
- 8.Yamamoto O. Influence of particle size on the antibacterial activity of zinc oxide. Int. J. Inorg. Mater. 2001;3:643–646. [Google Scholar]
- 9.Wang J, Chen R, Xiang L, Komarneni S. Synthesis properties and applications of ZnO nanomaterials with oxygen vacancies: a review. Ceram. Int. 2018;44:7357–7377. [Google Scholar]
- 10.Moussa H, Merlin C, Dezanet C, Balan L, Medjahdi G, Ben-Attia M, Schneider R. Trace amounts of Cu2+ ions influence ROS production and cytotoxicity of ZnO quantum dots. J. Hazard. Mater. 2015;304:532–542. doi: 10.1016/j.jhazmat.2015.11.013. [DOI] [PubMed] [Google Scholar]
- 11.Jin T, Sun D, Su Y, Zhang H, Sue HJ. Antimicrobial efficacy of zinc oxide quantum dots against Listeria monocytogenes, Salmonella enteritidis and Escherichia coli O157:H7. J. Food Sci. 2009;74:46–52. doi: 10.1111/j.1750-3841.2008.01013.x. [DOI] [PubMed] [Google Scholar]
- 12.Shah SN, Ali SI, Ali SR, Naeem M, Bibi Y, Ali SR, Raza SM, Khan Y, Sherwani SK. Synthesis and characterization of zinc oxide nanoparticles for antibacterial applications. J.. Basic Appl. Sci. 2016;12:205–210. [Google Scholar]
- 13.Mei L, Zhu L, Lin D. Toxicity of ZnO nanoparticles to Escherichia coli: mechanism and the influence of medium components. Environ. Sci. Technol. 2011;45:1977–1983. doi: 10.1021/es102624t. [DOI] [PubMed] [Google Scholar]
- 14.Naeem M, Hasanain SK, Kobayashi M, Ishida Y, Fujimori A, Scott B, Shah SI. Effect of reducing atmosphere on the magnetism of Zn1−xCoxO (0 ≤ x ≤ 0.10) nanoparticles. Nanotechnology. 2006;17:2675. doi: 10.1088/0957-4484/17/10/039. [DOI] [PubMed] [Google Scholar]
- 15.Malevu TD, Ocaya RO. Effect of annealing temperature on structural, morphology and optical properties of ZnO nano-needles prepared by zinc-air cell system method. Int. J. Electrochem. Sci. 2015;10:1752–1761. [Google Scholar]
- 16.Yuan K, Yu QX, Gao QQ, Wang J, Zhang XT. A threshold of to room temperature ferromagnetism of hydrogenated Mn doped ZnO nanoparticles. Appl. Surf. Sci. 2012;258:3350–3353. [Google Scholar]
- 17.Viswanatha R, Chakraborty S, Basu S, Sarma DD. Blue-emitting copper-doped zinc oxide nanocrystals. J. Phys. Chem. B. 2006;110:22310–22312. doi: 10.1021/jp065384f. [DOI] [PubMed] [Google Scholar]
- 18.Rajesh S, Reddy Yadav LS, Thyagarajan K. Structural optical thermal and photocatalytic properties of ZnO nanoparticles of betel leave by using green synthesis method. J. Nanostruct. 2016;6:250–255. [Google Scholar]
- 19.Ye JD, Gu SL, Qin F, Zhu SM, Liu SM, Zhou X, Liu W, Hu LQ, Zhang R, Shi Y, Zheng YD. Correlation between green luminescence and morphology evolution of ZnO films. Appl. Phys. A Mater. Sci. Process. 2005;81:759–762. [Google Scholar]
- 20.Wang M, Na EK, Kim JS, Kim EJ, Hahn SH, Park C, Koo KK. Photoluminescence of ZnO nanoparticles prepared by a low-temperature colloidal chemistry method. Mater. Lett. 2007;61:4094–4096. [Google Scholar]
- 21.Naeem M, Hasanain SK, Mumtaz A. Electrical transport and optical studies of ferromagnetic cobalt doped ZnO nanoparticles exhibiting a metal–insulator transition. J. Phys. Condens. Matter. 2008;20:025210. [Google Scholar]
- 22.Naeem M, Qaseem S, Gul IH, Maqsood A. Study of active surface defects in Ti-doped ZnO nanoparticles. J. Appl. Phys. 2010;107:124303. [Google Scholar]
- 23.Reddy Yadav LS, Kumar D, Kavitha C, Rajanaika H, Daruka Prasad B, Nagabhushana H, Nagaraju G. Antibacterial and photocatalytic activities of ZnO nanoparticles: synthesized using water melon juice as fuel. Int. J. Nanosci. 2015;15:1650006. [Google Scholar]
- 24.Reddy Yadav LS, Archana B, Lingaraju K, Kavitha C, Suresh D, Nagabhushana H, Nagaraju G. Electrochemical sensing, photocatalytic and biological activities of ZnO nanoparticles: synthesis via green chemistry route. Int. J. Nanosci. 2016;15:1650013. [Google Scholar]
- 25.Sirelkhatim A, Mahmud S, Seeni A, Kaus NHM, Ann LC, Bakhori SKM, Hasan H, Mohamad D. Review on zinc oxide nanoparticles: antibacterial activity and toxicity mechanism. Nano-Micro Lett. 2015;7:219–242. doi: 10.1007/s40820-015-0040-x. [DOI] [PMC free article] [PubMed] [Google Scholar]
- 26.Li M, Zhu L, Lin D. Toxicity of ZnO nanoparticles to Escherichia coli: mechanism and the influence of medium components. Environ. Sci. Technol. 2011;45:1977–1983. doi: 10.1021/es102624t. [DOI] [PubMed] [Google Scholar]
- 27.Lipovsky A, Nitzan Y, Gedanken A, Lubart R. Antifungal activity of ZnO nanoparticles - the role of ROS mediated cell injury. Nanotechnology. 2011;22:105101. doi: 10.1088/0957-4484/22/10/105101. [DOI] [PubMed] [Google Scholar]
- 28.Jiang W, Mashayekhi H, Xing B. Bacterial toxicity comparison between nano and micro-scaled oxide particles. Environ. Pollut. 2009;157:1619–1925. doi: 10.1016/j.envpol.2008.12.025. [DOI] [PubMed] [Google Scholar]
- 29.Padmavathy N, Vijayaraghavan R. Enhanced bioactivity of ZnO nanoparticles - an antimicrobial study. Sci. Technol. Adv. Mater. 2008;9:035004. doi: 10.1088/1468-6996/9/3/035004. [DOI] [PMC free article] [PubMed] [Google Scholar]
- 30.Dwivedi S, Wahab R, Khan F, Mishra YK, Musarrat J, Al-Khedhairy AA. Reactive oxygen species-mediated bacterial biofilm inhibition via zinc oxide nanoparticles and their statistical determination. PLoS One. 2014;9:111289. doi: 10.1371/journal.pone.0111289. [DOI] [PMC free article] [PubMed] [Google Scholar]
- 31.Zhang H, Shan Y, Dong L. A comparison of TiO2 and ZnO nanoparticles as photosensitizers in photodynamic therapy for cancer. J. Biomed. Nanotechnol. 2014;10:1450–1457. doi: 10.1166/jbn.2014.1961. [DOI] [PubMed] [Google Scholar]
- 32.Zhang H, Chen B, Jiang H, Wang C, Wang H, Wang X. A strategy for ZnO nanorod mediated multi-mode cancer treatment. Biomaterials. 2011;32:1906–1194. doi: 10.1016/j.biomaterials.2010.11.027. [DOI] [PubMed] [Google Scholar]
- 33.Wu JM, Kao WT. Heterojunction nanowires of AgxZn1-xO–ZnO photocatalytic and antibacterial activities under visible-light and dark conditions. J. Phys. Chem. C. 2015;119:1433. [Google Scholar]