

Abstract
Oncogenic signals contribute to enhanced glycolysis and mTORC1 activity, leading to rapid cell proliferation in cancer. Regulation of glycolysis and mTORC1 by PI3K/Akt signaling is well established, but how KRAS‐induced MEK signaling regulates these pathways remains poorly understood. Here, we report a role for MEK‐driven lactate production in mTORC1 activation in KRAS‐activated cells. KRAS/MEK‐induced upregulation of the chicken ovalbumin upstream promoter transcriptional factor II (COUP‐TFII) increases the expression of lactate dehydrogenase A (LDHA), resulting in lactate production and mTORC1 activation. Further, lactate inhibits the interaction of TSC2 and Rheb, leading to the cellular activation of mTORC1 irrespective of growth factor stimulation. These findings suggest that COUP‐TFII is a novel oncogenic mediator, connecting KRAS signaling and glycolysis, and leading to mTORC1 activation and cellular growth.
Keywords: COUP‐TFII, glycolysis, KRAS, lactate, mTORC1
Subject Categories: Cancer, Metabolism, Signal Transduction
Introduction
Oncogenic signals drive mTORC1‐mediated anabolic pathways along with enhanced glycolytic pathways to generate large amounts of precursors for the synthesis of macromolecules, enabling the accumulation of biomass during rapid cell growth and proliferation 1. It is well established that aberrantly activated PI3K/Akt signaling in cancer cells upregulates mTORC1 activity by deactivating the TSC1‐TSC2 complex 2. To support mTORC1‐mediated enhanced anabolic pathways, activated PI3K/Akt signaling also induces metabolic reprogramming for supplying substrates 3. Oncogenic KRAS mutations serve a vital role in controlling tumor metabolism through promotion of glycolysis and channeling of glucose intermediates into biosynthetic pathways 4. However, it is still unclear how KRAS‐activated cells transfer the oncogenic signal to aerobic glycolysis.
Glycolytic cancer cells produce significant amounts of lactate from pyruvate through the lactate dehydrogenase A (LDHA) reaction 5. The function of extracellular lactate produced by cancer cells has been well documented 5. Lactate in the extracellular space alters immune cell function and allows for cancer cell invasion and metastasis by decreasing monocyte migration and T‐cell capacity 6. Further, accumulating evidence indicates that extracellular lactate feeds oxidative phosphorylation (OXPHOS) in cancer cells under certain conditions such as metabolic symbiosis 7. In addition to its extracellular role, a recent study demonstrated that lactate mediates intracellular hypoxic responses during cancer cell growth through NDRG3‐induced Raf‐ERK signaling 8. However, since cancer cells produce lactate even in the presence of oxygen, it is important to elucidate the role of lactate in cancer cell growth under normoxic conditions.
Chicken ovalbumin upstream promoter transcriptional factor II (COUP‐TFII), also known as NR2F2, is an orphan nuclear receptor that belongs to the steroid receptor superfamily 9. COUP‐TFII is associated with tumorigenesis and unfavorable therapeutic outcomes 10, 11. Metabolically, COUP‐TFII promotes cancer progression through the regulation of mitochondrial pyruvate carries 1, leading to enhanced glycolysis 12. In addition to its role in malignant tissue, COUP‐TFII also plays important roles in glucose homeostasis and energy metabolism in non‐malignant tissues 13. Moreover, a recent study showed that COUP‐TFII coordinates hypoxia‐independent proangiogenic responses in hepatic stellate cells 14. Given that mitogenic MEK signaling induces COUP‐TFII expression 15, 16, COUP‐TFII may be relevant to altered metabolism and growth in aberrantly activated KRAS/MEK cells under normoxic conditions. Here, we report that upregulation of COUP‐TFII in KRAS‐activated cells leads to enhanced lactate production that contributes to mTORC1 activation through diminished interaction of TSC2 and Rheb, a growth factor‐sensing branch of mTORC1 activation.
Results and Discussion
Upregulation of COUP‐TFII in KRAS‐activated cells contributes to enhanced glycolysis and mTORC1 activity
To identify the relevance of COUP‐TFII to enhanced glycolysis and mTORC1 activity in aberrantly activated KRAS cells, we first examined whether these factors are upregulated in KRAS‐activated MEF cells. KRAS‐activated MEF cells showed a higher level of COUP‐TFII and LDHA protein than wild‐type MEF cells (Fig 1A). mTORC1 activity, as measured by phosphorylation of S6K (T389), was increased in KRAS‐activated MEF cells relative to wild‐type MEF cells (Fig 1A). Increased glycolysis, as measured by extracellular acidification rate (ECAR), was observed in KRAS‐activated MEF cells (Fig 1B). Intracellular lactate levels were also consistently increased in KRAS‐activated MEF cells (Fig 1C), although KRAS‐activated MEF cells had higher levels of lactate transporters, including MCT1 and MCT4 (Fig EV1A). These upregulations in KRAS‐activated MEF cells returned to the levels of wild‐type MEF cells after siRNA‐mediated knockdown of KRAS (siKRAS) (Fig 1A–C).
Figure 1. Effects of COUP‐TFII on lactate production and mTORC1 activity in KRAS‐activated cells.
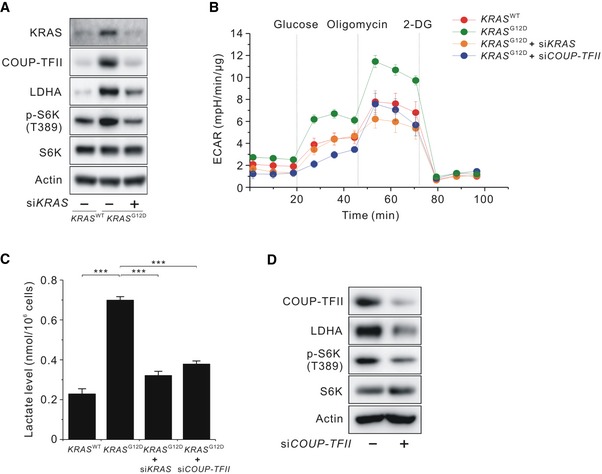
- Levels of KRAS, COUP‐TFII, LDHA, and phosphorylated S6K (T389) in KRAS WT, KRAS G12D, and KRAS‐silenced KRAS G12D MEF cells.
- Extracellular acidification rate (ECAR) in KRAS WT , KRAS G12D, and KRAS‐ or COUP‐TFII‐silenced KRAS G12D MEF cells. Data are expressed as the mean ± SEM of three independent experiments.
- Lactate levels in MEF cells shown in (B). Data are expressed as the mean ± SEM of three independent experiments. ***P < 0.001; unpaired t‐test.
- Levels of COUP‐TFII, LDHA, and phosphorylated S6K (T389) in COUP‐TFII‐silenced KRAS G12D MEF cells.
Source data are available online for this figure.
Figure EV1. Effects of COUP‐TFII on LDHA expression in KRAS‐activated cells.
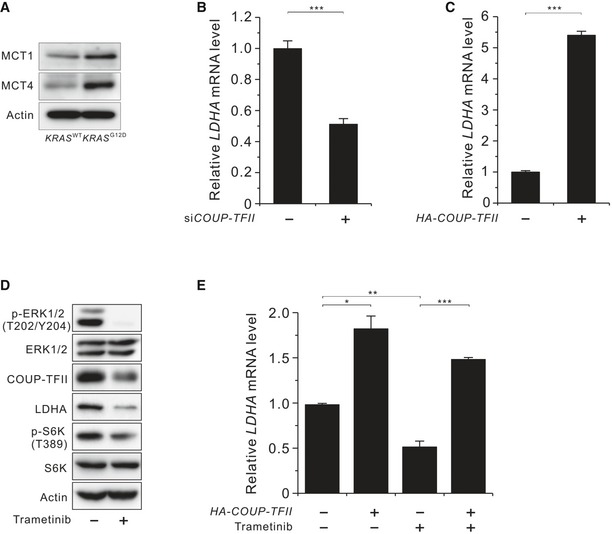
- Levels of MCT1 and MCT4 in KRAS WT and KRAS G12D MEF cells
- Level of LDHA mRNA in COUP‐TFII‐silenced KRAS G12D MEF cells.
- Level of LDHA mRNA in HA‐COUP‐TFII‐overexpressing KRAS WT MEF cells.
- Levels of phosphorylated ERK1/2 (T202/Y204), COUP‐TFII, LDHA, and phosphorylated S6K (T389) in KRAS G12D MEF cells treated with trametinib for 36 h.
- Level of LDHA mRNA in HA‐COUP‐TFII‐overexpressing KRAS G12D MEF cells treated with or without trametinib for 24 h.
Next, we examined whether elevated COUP‐TFII levels in KRAS‐activated MEF cells contributed to enhanced glycolysis and mTORC1 activation by siRNA‐mediated knockdown of COUP‐TFII (siCOUP‐TFII). The results demonstrated that siCOUP‐TFII reduced the levels of LDHA protein and p‐S6K (T389) (Fig 1D) and was accompanied by decreased ECAR and intracellular lactate levels (Fig 1B and C). Consistent with LDHA protein levels, siCOUP‐TFII decreased LDHA mRNA levels in KRAS‐activated MEF cells (Fig EV1B), while COUP‐TFII overexpression increased LDHA mRNA levels in wild‐type MEF cells (Fig EV1C). To discern which downstream effectors of RAS regulate COUP‐TFII abundance, we used a specific inhibitor of MEK, trametinib (also known as GSK1120212), and the Akt inhibitor MK‐2206. Treatment with trametinib reduced the abundance of COUP‐TFII and LDHA, as well as p‐S6K (T389) and p‐ERK (T202/Y204) (Fig EV1D). However, treatment with MK‐2206 had no effect on COUP‐TFII abundance (data not shown). The involvement of COUP‐TFII in MEK‐induced LDHA expression was further confirmed by data showing that COUP‐TFII overexpression in KRAS‐activated MEF cells attenuated trametinib‐induced suppression of LDHA mRNA levels (Fig EV1E). However, the effect of COUP‐TFII overexpression on LDHA mRNA expression in the presence of trametinib was less than that in the absence of trametinib, suggesting additional KRAS input into LDHA expression. Taken together, these data demonstrate that KRAS signaling promotes glycolysis and consequently generates lactate via COUP‐TFII‐mediated upregulation of LDHA levels.
COUP‐TFII‐induced lactate production plays a role in mTORC1 activation and proliferation in KRAS‐activated human cancer cells
After identifying the association of COUP‐TFII upregulation and mTORC1 activation in KRAS‐activated MEF cells, we next investigated whether this framework is applicable to KRAS‐activated human cancer cells. Silencing of KRAS expression in colon cancer (HCT116 and DLD‐1) and pancreatic cancer (MIA PaCa‐2) cells harboring an oncogenic mutation was accompanied by a reduction in the levels of COUP‐TFII, LDHA, and p‐S6K (T389) (Figs 2A and EV2A). Consistent with the results seen in KRAS‐activated MEF cells, siCOUP‐TFII also suppressed LDHA protein expression, p‐S6K (T389) levels, and intracellular lactate levels in KRAS‐activated human cancer cells (Figs 2B and EV2B and C), implying that the association of COUP‐TFII and mTORC1 activation applies to human KRAS‐activated cancer cells. The expression status of MCT1 and MCT4 in KRAS‐activated cancer cells (Fig EV2D) was similar to those of previous results 17. Next, we proposed that lactate acts as a signaling molecule, transmitting the effects of COUP‐TFII on mTORC1 activation. We observed that both sodium lactate and lactic acid increased mTORC1 activity (Fig EV2E). To avoid pH effects on mTORC1 activity, sodium lactate was used in this study. The dose of lactate was chosen on the basis of results showing that p‐S6K (T389) levels in MEF cells were dose‐dependently increased by lactate, maximum levels were achieved at 20 mM lactate, and then, levels were sustained up to 60 mM lactate (Fig EV2F). We also excluded the hyperosmolar effect of lactate on mTORC1 activation by using equi‐osmotic 40 mM mannitol (Fig EV2G) 18. Based on this result, 20 mM lactate was employed in the following experiments. Treatment with 20 mM lactate rescued siCOUP‐TFII‐induced suppression of mTORC1 activity as shown by the increased levels of p‐S6K (T389) and other mTORC1 substrates such as p‐4E‐BP1 and p‐ULK1 in HCT116 cells (Figs 2C and EV2H). In line with this observation, supplemental lactate attenuated the siLDHA‐induced inhibition of serum‐stimulated mTORC1 activation (Fig EV2I). Moreover, overexpression of COUP‐TFII significantly attenuated siKRAS‐induced suppression of mTORC1 activity, which was blocked by treatment with the pharmacologic LDHA inhibitor oxamate (Fig 2D). Raptor S792 phosphorylation was not reduced by oxamate treatment, confirming that oxamate‐induced mTORC1 inhibition was not caused by reduced glycolytic ATP‐induced AMPK activation (Fig 2D). Furthermore, treatment with exogenous lactate recovered oxamate‐induced suppression of mTORC1 (Fig EV2J). We next examined whether KRAS‐induced COUP‐TFII is implicated in lactate production. The results showed that COUP‐TFII overexpression slightly increased lactate production in KRAS‐activated cells, suggesting that the amount of endogenous COUP‐TFII was already sufficient to generate near‐maximal lactate production (Fig EV2K). COUP‐TFII partially but markedly recovered siKRAS‐induced suppression of lactate levels (Fig EV2K). KRAS signaling promotes glycolysis by controlling glycolytic signaling (such as that of PI3K/AKT) as well as the expression of various glycolytic genes including GLUT1 4, 19, whereas COUP‐TFII is involved in LDHA expression (data not shown); thereby, COUP‐TFII overexpression in KRAS‐silenced cells could not fully recover the lactate levels of control cells. These results indicate that COUP‐TFII‐induced lactate production plays a role in transmitting the KRAS signal to activate mTORC1 activity.
Figure 2. Effects of COUP‐TFII‐induced lactate production on mTORC1 activation and cell proliferation in KRAS‐activated human cancer cells.
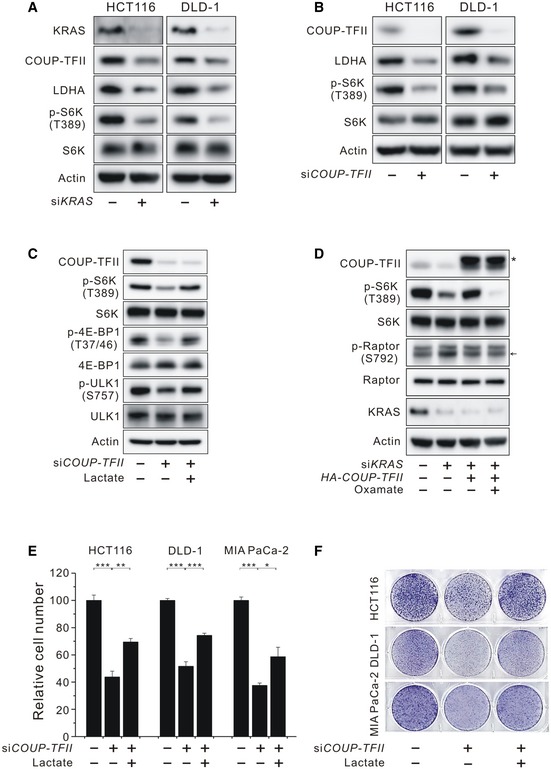
- Levels of KRAS, COUP‐TFII, LDHA, and phosphorylated S6K (T389) in KRAS‐silenced HCT116 and DLD‐1 cells.
- Levels of COUP‐TFII, LDHA, and phosphorylated S6K (T389) in COUP‐TFII‐silenced HCT116 and DLD‐1 cells.
- Effect of lactate on phosphorylated S6K (T389), 4E‐BP1 (T37/46), and ULK1 (S757) in COUP‐TFII‐silenced HCT116 cells.
- Effects of COUP‐TFII and the inhibition of LDHA on phosphorylated S6K (T389) and Raptor (S792) in KRAS‐silenced HCT116 cells. Asterisk indicates exogenous HA‐COUP‐TFII. Arrow indicates phosphorylated Raptor (S792).
- Inhibition of COUP‐TFII‐silenced HCT116, DLD‐1, and MIA PaCa‐2 cell proliferation and its recovery by treatment with lactate. Data are expressed as the mean ± SEM of three independent experiments and normalized against values measured in control. *P < 0.05, **P < 0.01, and ***P < 0.001; unpaired t‐test.
- Clonogenic assay of COUP‐TFII‐silenced HCT116, DLD‐1, and MIA PaCa‐2 cells in the presence or absence of lactate.
Source data are available online for this figure.
Figure EV2. Effects of COUP‐TFII‐induced lactate production on mTORC1 activation and cell proliferation in KRAS‐activated human cancer cells.
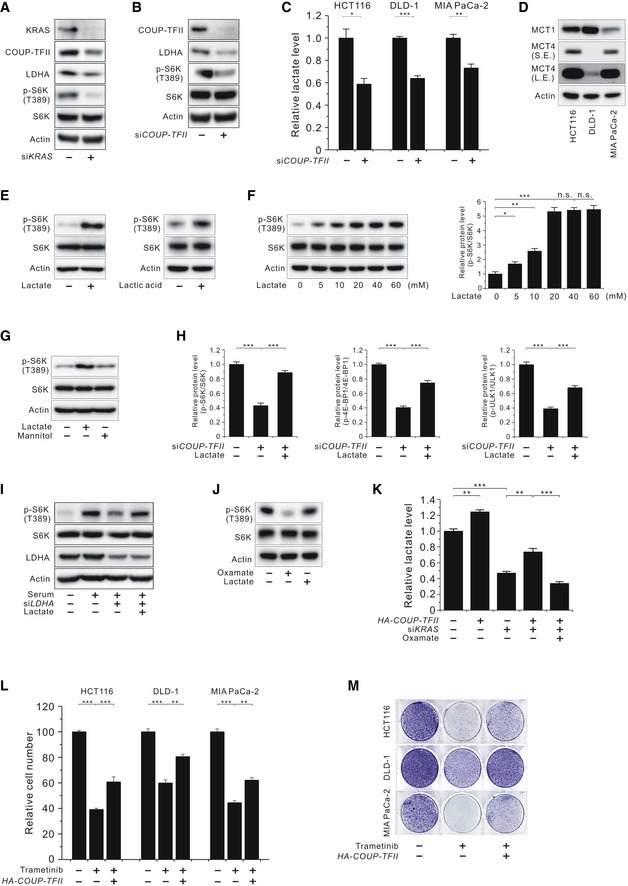
- Levels of KRAS, COUP‐TFII, LDHA, and phosphorylated S6K (T389) in KRAS‐silenced MIA PaCa‐2 cells.
- Levels of COUP‐TFII, LDHA, and phosphorylated S6K (T389) in COUP‐TFII‐silenced MIA PaCa‐2 cells.
- Level of lactate in COUP‐TFII‐silenced HCT116, DLD‐1, and MIA PaCa‐2 cells.
- Levels of MCT1 and MCT4 in HCT116, DLD‐1, and MIA PaCa‐2 cells. S.E., short exposure; L.E., long exposure.
- Effect of lactate or lactic acid on phosphorylated S6K (T389) in serum‐starved HCT116 cells.
- Effect of lactate at the indicated doses on phosphorylated S6K (T389) in serum‐starved MEF cells.
- Effect of sodium chloride, lactate, or mannitol on phosphorylated S6K (T389) in serum‐starved HCT116 cells.
- Effect of lactate on phosphorylated S6K (T389), 4E‐BP1 (T37/46), and ULK1 (S757) in COUP‐TFII‐silenced HCT116 cells as shown in Fig 2C. Quantitative densitometric data are the mean ± SEM of three independent measurements.
- Effect of lactate on phosphorylated S6K (T389) in LDHA‐knockdown HCT 116 cells.
- Effect of lactate on phosphorylated S6K (T389) in oxamate‐treated HCT116 cells.
- Level of lactate in KRAS‐silenced and/or HA‐COUP‐TFII‐overexpressing HCT116 cells with or without oxamate.
- Inhibition of HCT116, DLD‐1, and MIA PaCa‐2 cancer cell proliferation by trametinib and its recovery by expressing HA‐COUP‐TFII.
- Clonogenic assay of HCT116, DLD‐1, and MIA PaCa‐2 cells treated with trametinib and expressing HA‐COUP‐TFII with trametinib.
Because mTORC1 is a master regulator of cell growth, we sought to determine the relevance of COUP‐TFII‐mediated lactate production on proliferation in KRAS‐activated human cancer cells. As shown in Fig 2E, siCOUP‐TFII suppressed proliferation of KRAS‐activated human cancer cells while lactate supplementation partially but significantly recovered them. A clonogenic assay also confirmed that lactate contributes to COUP‐TFII‐mediated cancer cell proliferation in KRAS‐activated cancer cells (Fig 2F). Despite the recovery of p‐S6K levels by lactate treatment, cell proliferation was moderately recovered, which can be explained by the lactate‐independent role of COUP‐TFII in cancer cell viability 10, 12, 20, 21. For further elucidation of the role of COUP‐TFII in KRAS signaling‐induced cell growth, we investigated whether overexpression of COUP‐TFII recovered cell growth suppression induced by inhibition of KRAS downstream of MEK. Indeed, overexpression of COUP‐TFII significantly recovered trametinib‐induced suppression of cell proliferation (Fig EV2L–M). Taken together, these data support the idea that COUP‐TFII‐induced lactate production contributes to KRAS/MEK signaling‐induced cell proliferation.
Lactate increases mTORC1 activity by disrupting the interaction of TSC2 and Rheb
Amino acid‐sensing and growth factor‐activating signals are two important pathways for mTORC1 activation 22. Under amino acid‐enriched conditions, mTORC1 activity is regulated by the Rag family of GTPases, which promotes the localization of mTOR to the lysosome 23, 24. On the surface of the lysosomal membrane, mTORC1 is activated by Rheb, which is regulated by the TSC1‐TSC2 complex in response to growth factors 25, 26, 27. To determine the site at which lactate activates mTORC1, we tested the effects of lactate on mTORC1 activation under amino acid‐depleted and serum‐starved conditions. Under amino acid‐depleted conditions, supplementation of lactate did not increase p‐S6K (T389) levels (Fig EV3A), indicating that lactate did not act downstream of amino acid‐sensing signals. By contrast, under serum‐starved conditions, supplementation of lactate increased p‐S6K (T389) levels. However, lactate did not alter the levels of p‐TSC2 (S664 and S1462), p‐AKT (T308), and p‐ERK (T202/Y204) (Fig 3A), indicating that lactate increased mTORC1 activity without affecting pathways upstream of TSC in the growth factor‐signaling branch. Intriguingly, we found that lactate recovered overexpression of TSC2‐induced suppression of mTORC1 activity and Rheb‐GTP (Figs 3B and EV3B and C). Taken together, these data indicate that lactate acts downstream of TSC2 for mTORC1 activation and does not affect amino acid‐sensing signal‐induced mTORC1 activation. Accordingly, we examined whether lactate disrupts the interaction of TSC2 and Rheb, which is downstream of TSC2, for inhibition of mTORC1 activity. The results showed that serum‐starved MEF cells treated with lactate disrupted the TSC2 and Rheb interaction in a dose‐dependent manner (Fig EV3D), which is consistent with the dose‐dependent effects of lactate on mTORC1 activation (Fig EV2F). The level of the Rheb‐GTP response to growth factor withdrawal and insulin stimulation and the interaction of TSC2 with Rheb under serum‐starved conditions are consistent with previous findings 28, 29 (Fig EV3E and F). We further confirmed that 20 mM lactate disrupted the TSC2 and Rheb interaction in serum‐starved HCT116 cells (Figs 3C and EV3G). This inhibitory effect of lactate on the TSC2 and Rheb interaction was further confirmed by measuring the in vitro interaction between TSC2 and recombinant GDP‐loaded Rheb, which is known to bind most strongly to the TSC complex 25 (Figs 3D and EV3H). Furthermore, lactate increased the levels of Rheb‐GTP and the interaction of mTOR with endogenous Rheb under serum‐starved conditions (Figs 3E and F, EV3I and J). We also observed that lactate prevented lysosomal localization of TSC2 in serum‐starved cells, as evidenced by colocalization with lysosomal membrane protein LAMP2 (Fig 3G). To determine whether it was lactate itself or its metabolites that activated mTORC1, we examined whether metabolites of lactate such as pyruvate or α‐ketoglutarate influenced mTORC1 activity. Methyl pyruvate (a mitochondrial permeable form of pyruvate) and dimethyl α‐ketoglutarate (a mitochondrial permeable form of α‐ketoglutarate) did not influence p‐S6K (T389) levels in the presence or absence of siLDHA (Fig EV3K), indicating that lactate itself activates mTORC1 activity. To exclude the possibility that intracellular pH changes caused by sodium lactate addition influenced mTORC1 activity, we examined whether a proton inhibitor, 5‐(N‐ethyl‐N‐isopropyl) amiloride (EIPA), increases mTORC1 activity. The results showed that EIPA increased the TSC2‐Rheb interaction but decreased p‐S6K (T389) levels (Fig EV3L and M), indicating that intracellular pH changes were not responsible for lactate‐induced mTORC1 activity.
Figure EV3. Effects of lactate on TSC2 and Rheb interaction and Rheb‐GTP levels.
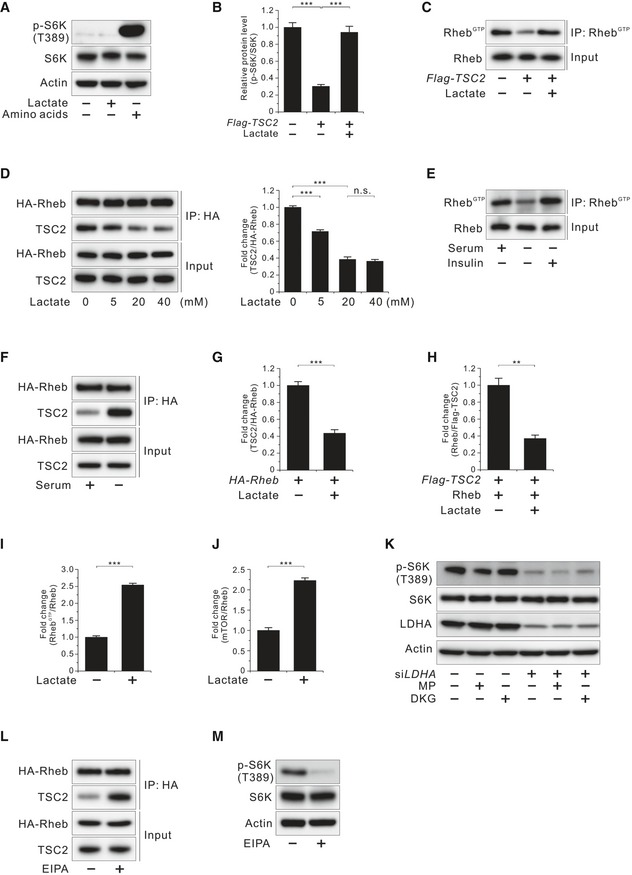
- Effect of lactate on phosphorylated S6K (T389) inhibited by amino acid deprivation in HCT116 cells.
- Effect of lactate on phosphorylated S6K (T389) inhibited by TSC2 overexpression in HCT116 cells as shown in Fig 3B. Quantitative densitometric data are the mean ± SEM of three independent measurements. ***P < 0.001; unpaired t‐test.
- Effect of lactate on Rheb activation inhibited by TSC2 overexpression in HCT116 cells.
- Molecular interaction between TSC2 and Rheb at the indicated doses of lactate in HA‐Rheb‐overexpressing HCT116 cells after serum deprivation overnight. Data in the bar graphs are the mean ± SEM of three independent measurements. n.s., not significant; ***P < 0.001; unpaired t‐test.
- Rheb‐GTP level in HCT116 cells. HCT1116 cells were serum‐starved overnight and then stimulated with insulin (100 nM, 10 min).
- Molecular interaction between TSC2 and Rheb in the presence or absence of serum in HA‐Rheb‐overexpressing HCT116 cells.
- Molecular interaction between TSC2 and Rheb in the presence or absence of lactate in HA‐Rheb‐overexpressing HCT116 cells after serum deprivation overnight as shown in Fig 3C. Quantitative densitometric data are the mean ± SEM of three independent measurements. ***P < 0.001; unpaired t‐test.
- Molecular interaction between TSC2 and recombinant GDP‐loaded Rheb in the presence or absence of lactate in vitro as shown in Fig 3D. Quantitative densitometric data are the mean ± SEM of three independent measurements. **P < 0.01; unpaired t‐test.
- Effect of lactate on Rheb activation in serum‐starved HCT116 cells as shown in Fig 3E. Quantitative densitometric data are the mean ± SEM of three independent measurements. ***P < 0.001; unpaired t‐test.
- Interaction between endogenous Rheb and mTOR in the presence or absence of lactate in HCT116 cells after serum deprivation overnight as shown in Fig 3F. Quantitative densitometric data are the mean ± SEM of three independent measurements. ***P < 0.001; unpaired t‐test.
- Effect of methyl pyruvate (MP; 10 mM, 45 min) or dimethyl α‐ketoglutarate (DKG; 5 mM, 45 min) on phosphorylated S6K (T389) in LDHA‐knockdown HCT116 cells.
- Molecular interaction between TSC2 and Rheb with or without EIPA (50 μM, 2 h) in HA‐Rheb‐overexpressing HCT116 cells after serum deprivation overnight.
- Effect of EIPA (50 μM, 2 h) on phosphorylated S6K (T389) in HCT116 cells shown in (L).
Source data are available online for this figure.
Figure 3. Effects of lactate on TSC2 and Rheb interaction and TSC2 lysosomal localization.
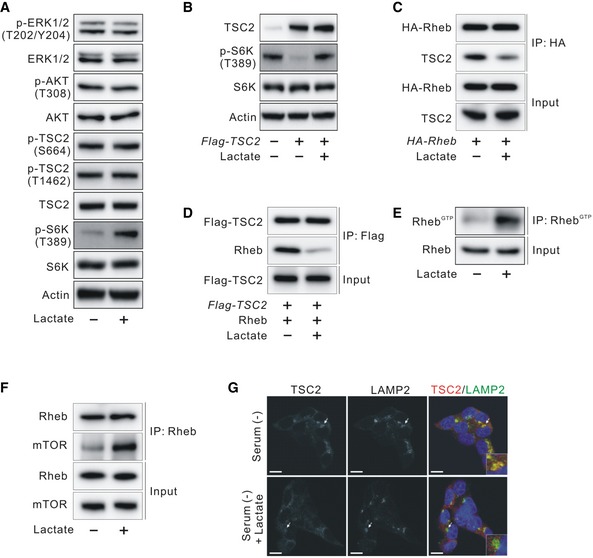
- Effect of lactate on the ERK/TSC2 and AKT/TSC2 signaling pathway in serum‐starved HCT116 cells.
- Effect of lactate on phosphorylated S6K (T389) inhibited by TSC2 overexpression in HCT116 cells.
- Molecular interaction between TSC2 and Rheb in the presence or absence of lactate in HA‐Rheb‐overexpressing HCT116 cells after serum deprivation overnight.
- Molecular interaction between TSC2 and recombinant GDP‐loaded Rheb in the presence or absence of lactate in vitro.
- Effect of lactate on Rheb activation in serum‐starved HCT116 cells.
- Interaction between endogenous Rheb and mTOR in the presence or absence of lactate in HCT116 cells after serum deprivation overnight.
- Immunofluorescence analysis of staining for TSC2 and LAMP2 in the presence or absence of lactate in HCT116 cells after serum deprivation overnight. Arrows indicate the enlarged view in the bottom of each right panel. Scale bar, 10 μm.
Source data are available online for this figure.
COUP‐TFII disrupts the TSC2/Rheb interaction and increases Rheb‐GTP levels
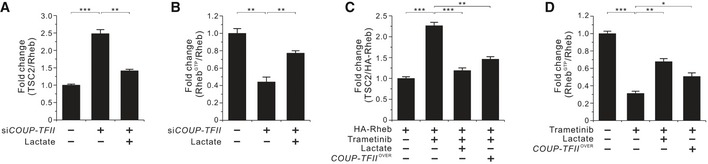
Based on the previous results, we reasoned that lactate‐induced disruption of TSC2/Rheb interaction is the mechanism responsible for COUP‐TFII‐induced mTORC1 activation in KRAS‐activated cancer cells. As expected, lactate supplementation recovered siCOUP‐TFII‐induced upregulation of TSC2/Rheb interaction and reduction of Rheb‐GTP levels (Figs 4A and B, and EV4A and B). Additionally, siCOUP‐TFII‐induced TSC2 lysosomal localization, and this recruitment of TSC2 to lysosomes was prevented when lactate was present (Fig 4C). Collectively, these data indicate that COUP‐TFII is implicated in Rheb activation via lactate production.
Figure 4. Effects of COUP‐TFII on TSC2 and Rheb interaction, TSC2 lysosomal localization, and Rheb‐GTP levels.

- Interaction between endogenous TSC2 and Rheb in the presence or absence of lactate in COUP‐TFII‐silenced HCT116 cells.
- Effect of lactate on Rheb activation in COUP‐TFII‐silenced HCT 116 cells.
- Immunofluorescence analysis of staining for TSC2 and LAMP2 in HCT116 cells shown in (B). Arrows indicate the enlarged view in the bottom of each right panel. Scale bar, 10 μm. The degree of colocalization of TSC2 and LAMP2 is graphed as the mean ± SEM from three independent fields with at least 20 cells. ***P < 0.001; Mann–Whitney test.
- Molecular interaction between TSC2 and Rheb in the presence or absence of lactate in HA‐Rheb‐ and/or COUP‐TFII‐overexpressing HCT116 cells treated with 25 nM trametinib for 24 h.
- Effects of lactate and COUP‐TFII overexpression on Rheb activation in HCT116 cells treated with 25 nM trametinib for 24 h.
- Immunofluorescence analysis of staining for TSC2 and LAMP2 in HCT116 cells shown in (E). Arrows indicate the enlarged view in the bottom of each right panel. Scale bar, 10 μm. The degree of colocalization of TSC2 and LAMP2 is graphed as the mean ± SEM from three independent fields with at least 20 cells. ***P < 0.001; unpaired t‐test.
Source data are available online for this figure.
Figure EV4. Effects of COUP‐TFII on TSC2 and Rheb interaction and Rheb‐GTP levels.
- Interaction between endogenous TSC2 and Rheb in the presence or absence of lactate in COUP‐TFII‐silenced HCT116 cells as shown in Fig 4A. Quantitative densitometric data are the mean ± SEM of three independent measurements. **P < 0.01 and ***P < 0.001; unpaired t‐test.
- Effect of lactate on Rheb activation in COUP‐TFII‐silenced HCT 116 cells as shown in Fig 4B. Quantitative densitometric data are the mean ± SEM of three independent measurements. **P < 0.01; unpaired t‐test.
- Molecular interaction between TSC2 and Rheb in the presence or absence of lactate in HA‐Rheb‐ and/or COUP‐TFII‐overexpressing HCT116 cells treated with 25 nM trametinib for 24 h as shown in Fig 4D. Quantitative densitometric data are the mean ± SEM of three independent measurements. **P < 0.01 and ***P < 0.001; unpaired t‐test.
- Effects of lactate and COUP‐TFII overexpression on Rheb activation in HCT116 cells treated with 25 nM trametinib for 24 h as shown in Fig 4E. Quantitative densitometric data are the mean ± SEM of three independent measurements. *P < 0.05, **P < 0.01, and ***P < 0.001; unpaired t‐test.
Next, we assessed whether lactate and COUP‐TFII mediate KRAS signaling‐induced mTORC1 activation. The results demonstrated that supplementation with lactate or overexpression of COUP‐TFII ameliorated trametinib‐induced upregulation of TSC2 and Rheb interaction, and trametinib‐induced suppression of Rheb‐GTP levels (Figs 4D and E, and EV4C and D). Moreover, lactate supplementation or COUP‐TFII overexpression prevented trametinib‐induced TSC2 lysosomal localization (Fig 4F). Taken together, these findings support the hypothesis that COUP‐TFII‐induced lactate production inhibits TSC2/Rheb interaction, thereby increasing mTORC1 activity, which is a key aspect of cell proliferation in KRAS‐activated cancer cells.
Knockdown of COUP‐TFII inhibits tumor growth, but overexpression of COUP‐TFII prevents trametinib‐induced tumor suppression
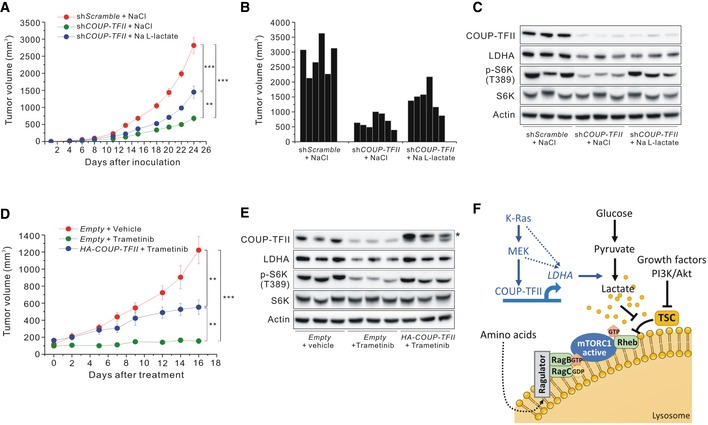
To investigate whether modulation of COUP‐TFII‐induced lactate production could affect tumor growth in vivo, we used nude mice bearing COUP‐TFII‐knockdown HCT116 xenografts. Tumors in mice injected with COUP‐TFII‐knockdown HCT116 cells were significantly smaller and exhibited lower levels of LDHA and p‐S6K (T389) than those of control mice (Fig 5A–C). However, exogenous lactate supplementation of mice bearing shCOUP‐TFII‐HCT116 cell tumors reversed the decrease in tumor volume and lowered levels of p‐S6K (T389) (Fig 5A–C). We further investigated whether COUP‐TFII mediates KRAS signaling‐induced tumor growth using a xenograft overexpressing COUP‐TFII. We observed that COUP‐TFII‐overexpressing HCT116 cells prevented trametinib‐induced inhibition of tumor growth (Figs 5D and EV5). Xenografted tumor tissue in mice treated with trametinib had reduced levels of COUP‐TFII, LDHA, and p‐S6K (T389) compared to tumor tissue from control mice, while COUP‐TFII‐overexpressing tumor tissue exhibited recovery of LDHA and p‐S6K (T389) levels (Fig 5E).
Figure 5. In vivo effects of COUP‐TFII on tumor growth.
-
A–CEffects of COUP‐TFII inhibition and lactate treatment on tumor growth in vivo. (A) Growth curve, (B) tumor volume at the experimental endpoint, and (C) Western blot analysis of the indicated proteins in tumors derived from xenografted shScramble or shCOUP‐TFII‐HCT116 cells and treated with sodium chloride or sodium L‐lactate (60 μl × g−1 body weight; 150 mM). Data are expressed as the mean ± SEM. **P < 0.01 and ***P < 0.001; unpaired t‐test.
-
DEffects of trametinib treatment and overexpression of COUP‐TFII on tumor growth in vivo. Tumors were derived from xenografted HCT116 expressing HA‐COUP‐TFII or carrying a control vector and treated with trametinib (3 mg/kg). Data are expressed as the mean ± SEM. **P < 0.01 and ***P < 0.001; unpaired t‐test.
-
EWestern blot analysis of indicated proteins in tumors derived from xenografted HCT116 treated with trametinib with or without COUP‐TFII overexpression. Asterisk indicates exogenous HA‐COUP‐TFII.
-
FSchematic showing COUP‐TFII‐mediated growth pathway in KRAS‐activated cancer cells.
Source data are available online for this figure.
Figure EV5. In vivo effects of trametinib treatment and overexpression of COUP‐TFII on tumor growth.
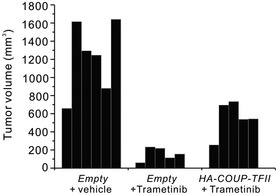
Tumor volume at the experimental endpoint in tumors derived from xenografted HCT116 expressing HA‐COUP‐TFII or carrying a control vector and treated with trametinib (3 mg/kg) as shown in Fig 5D.
In summary, we describe here the intermediary role of COUP‐TFII between oncogenic KRAS signaling and aerobic glycolysis. Our data suggest that COUP‐TFII‐induced lactate production in KRAS‐activated cells activates mTORC1, which drives cellular proliferation. Mechanistically, lactate inhibits TSC2‐Rheb interaction, which results in mTORC1 activation regardless of serum stimulation (Fig 5F). These data address how KRAS‐activated cells transmit the oncogenic KRAS signal to aerobic glycolysis. Although mTOR‐mediated upregulation of glycolysis is well established, little is known about the feedback regulation by which glycolysis influences mTOR activity. This study demonstrated the mechanism by which aerobic glycolysis induces mTORC1 activation. Lactate has traditionally been considered the end waste product of the Warburg effect in glycolytic cancer 30. However, a recent study showed that lactate functions as a signaling molecule for the cellular hypoxic response 8. In addition to its hypoxia response, the present study, performed under normoxic conditions, demonstrates that COUP‐TFII‐mediated lactate production is responsible for mTORC1 activation in KRAS‐activated cells. Taken together, our findings suggest a novel pathway that integrates KRAS/MEK signaling and aerobic glycolysis to activate mTORC1 through upregulation of COUP‐TFII. Our data also illustrate how lactate activates mTORC1 and contributes to cell growth, suggesting the potential role of lactate signaling in the growth advantage exhibited by glycolytic cancer cells.
Materials and Methods
Cell culture
KRASWT and KRASG12D MEFs generated from Cre recombinase‐induced SV40 large T‐immortalized Lox‐Stop‐Lox‐KRASG12D MEFs were kindly donated by Dr. Craig B. Thompson (Memorial Sloan Kettering Cancer Center, NY, USA). MEF cells were cultured in DMEM containing 10% fetal bovine serum (FBS) and 1% penicillin/streptomycin (P/S). The colorectal cancer cell lines HCT116 and DLD‐1 were obtained from Korean Cell Line Bank (Seoul, South Korea) and cultured in RPMI 1640 medium containing 10% FBS and 1% P/S. The pancreatic cancer cell line MIA PaCa‐2 was obtained from American Type Culture Collection (Manassas, VA, USA) and cultured in DMEM containing 10% FBS and 1% P/S. To demonstrate the effects of lactate on mTORC1 activity, cells were treated with 20 mM sodium l‐lactate (Sigma, St. Louis, MO), 20 mM l‐lactic acid (Sigma), 20 mM sodium chloride (Sigma), or 40 mM mannitol (Sigma) for 45 min. The pharmacological inhibitor of lactate dehydrogenase A, 40 mM oxamate (Sigma), was applied for 2 h.
Chemicals
Methyl pyruvate, dimethyl α‐ketoglutarate, and EIPA were from Sigma.
Western blot analysis
Proteins from cellular lysates were resolved on NuPAGE™ 4–12% Bis‐Tris Protein Gels, Bolt™ 4–12% Bis‐Tris Protein Gels (Thermo Fisher Scientific, Waltham, MA), or Tris‐Glycine gel and transferred to PVDF membranes. Membranes were then probed with antibodies against the following: KRAS, HA‐probe, Rheb, MCT1 (Abcam, Cambridge, UK), MCT1 (Bethyl Laboratories, Montgomery, Texas), MCT4 (Santa Cruz Biotechnology, Santa Cruz, CA), COUP‐TFII (R&D systems, Minneapolis, MN), LDHA, phospho‐p70S6K (T389), p70S6K, Rheb, phospho‐TSC2 (S664, T1462), TSC2, mTOR, phospho‐ERK1/2 (T202/Y204), ERK1/2, phospho‐AKT (T308), AKT, phospho‐4E‐BP1 (T37/46), 4E‐BP1, phospho‐ULK1 (S757), ULK1, phospho‐Raptor (S792), Raptor (Cell Signaling Technology, Danvers, MA), Rheb (NewEast Biosciences, King of Prussia, PA), FLAG, and β‐actin (Sigma). Secondary antibody was Rabbit/Mouse IgG Antibody (GenTex, Irvine, CA). The quantitative analyses of Western blots were performed using ImageJ software.
Transfection of siRNA and cDNA constructs
Cells were transfected with scrambled siRNA, siKRAS, siCOUP‐TFII, siLDHA (Bioneer, Daejeon, South Korea), HA‐COUP‐TFII expression vector (a gift from Dr. Keesook Lee, Chonnam National University), COUP‐TFII expression vector (GeneCopoeia, Rockville, MD), pRK5 HA GST Rheb1 (referred to as HA‐Rheb) expression vector from David Sabatini (Addgene plasmid # 14951), pcDNA3 Flag TSC2 expression vector from Brendan Manning (Addgene plasmid # 14129), or a control vector using Lipofectamine RNAiMAX and Lipofectamine 2000 Transfection Reagent (Thermo Fisher Scientific) and TransIT‐LT1 Transfection Reagent (Mirus Bio, Madison, WI) according to the manufacturer's instructions. To stably express transfected DNA, cells were selected by addition of G418 (Thermo Fisher Scientific) for 2 weeks.
Measurement of extracellular acidification rate
The glycolysis stress test was conducted in a XF24 Extracellular Flux Analyzer (Seahorse Bioscience, North Billerica, MA). Glucose (10 mM; Sigma), oligomycin (1 μM; Sigma), and 2‐deoxyglucose (100 mM; Sigma) were added at the indicated time points during ECAR measurement. ECAR was normalized to protein contents quantified using Pierce™ BCA Protein Assay Kit (Thermo Fisher Scientific).
Lactate measurements
Lactate production was measured using the Lactate Colorimetric/Fluorometric Assay Kit (Biovision, Milpitas, CA) according to the manufacturer's instructions. The data were normalized to cell number.
Clonogenic assay and cell counting
Cells transfected with siCOUP‐TFII or scrambled siRNA or expressing HA‐COUP‐TFII or control vector were seeded into 6‐well plates (4 × 10³). The cells were maintained in the presence or absence of 20 mM lactate with or without trametinib (Enzo Life Sciences, Farmingdale, NY) in complete media for 14 days. The dose of trametinib was 25 nM, 100 nM, and 25 nM in HCT116, DLD‐1, and MIA PaCa‐2 cells, respectively. Media was replaced every 2 days. Cells were fixed and stained with 0.5% crystal violet. Cell counting was conducted through trypan blue staining using a hemocytometer 72 h after treatment.
Rheb‐GTP assay
Rheb‐GTP levels were measured using the Rheb Activation Assay Kit (NewEast Biosciences) according to the manufacturer's instructions. A configuration‐specific Rheb‐GTP monoclonal antibody that immunoprecipitated Rheb‐GTP was used.
Immunocytochemistry
Cells were fixed with 4% paraformaldehyde (Sigma) and rinsed with PBS. Cells were permeabilized with 0.3% Triton X‐100 for 10 min at room temperature. Following 1 h of blocking in 5% normal goat serum (Vector Laboratories, Burlingame, CA) in PBS, cells were incubated with primary anti‐LAMP2 (1:200; Abcam) and anti‐TSC2 (1:800, Cell Signaling Technology) antibodies overnight at 4°C. After washing with PBS, the cells were incubated with Alexa Fluor® 488 goat anti‐mouse and Alexa Fluor® 568 goat anti‐rabbit (1:100; Thermo Fisher Scientific) secondary antibodies for 2 h at room temperature. Nuclei were stained with DAPI (Vector Laboratories). Colocalization of TSC2/LAMP2 was quantified using the Coloc2 plugin of Fiji software 31 and calculated using Manders’ colocalization coefficient 32. At least 20 cells per group were examined in three images for statistical analysis.
Quantitative RT–PCR
Total RNA was harvested with TRIzol reagent (Thermo Fisher Scientific), and cDNA was synthesized using the RevertAid First Strand cDNA Synthesis Kit (Thermo Fisher Scientific). SYBR Green PCR Master Mix (Applied Biosystems, Foster City, CA) and a VIIA 7 real‐time PCR system instrument (Applied Biosystems) were used for analysis. The primer sequences were as follows: LDHA forward, GGATGAGCTTGCCCTTGTTG, and reverse, ATCCATCATCTCGCCCTTGA; 36B4 forward, ACCTCCTTCTTCCAGGCTTT, and reverse, CTCCAGTCTTTATCAGCTGC. Gene expression was normalized to that of the endogenous reference gene, 36B4.
Immunoprecipitation
HCT116 cells or HCT116 cells overexpressing HA‐Rheb were harvested in lysis buffer (0.3% CHAPS, 25 mM NaCl, 0.5 mM EDTA, 40 mM HEPES (pH 7.4), 10 mM MgCl2) containing EDTA‐free protease inhibitors (Roche, Mannheim, Germany) and phosphatase inhibitors (Sigma) for confirmation of Rheb‐TSC2 interaction or lysis buffer (0.2% CHAPS, 25 mM NaCl, 5 mM EGTA, 20 mM Tris–HCl (pH 7.5), 10 mM MgCl2) containing EDTA‐free protease inhibitors (Roche) and phosphatase inhibitors (Sigma) for confirmation of Rheb‐mTOR interaction 29, 33. The lysates were centrifuged at 16,000 g at 4°C for 15 min. The supernatants were incubated with anti‐HA or anti‐Rheb (Santa Cruz Biotechnology)‐conjugated protein G plus agarose beads (Santa Cruz Biotechnology) for 2 h at 4°C. Following immunoprecipitation, the beads were washed four times with lysis buffer. Samples were denatured by adding sample buffer and boiling for 5 min before Western blot analysis. A secondary antibody was used with VeriBlot for immunoprecipitation secondary antibody (Abcam).
In vitro TSC2‐Rheb binding assay
To assess the binding between TSC2 and Rheb in the presence or absence of lactate, HCT116 cells overexpressed Flag‐TSC2 for 36 h and were then serum‐starved overnight. The cell lysates were prepared as described 34, except that Flag M2 agarose beads (Sigma) were used to pull‐down Flag TSC2. The reaction was performed by mixing GDP‐loaded recombinant Rheb (ProSpec‐Tany TechnoGene Ltd, Ness Ziona, Israel) with equal amounts of Flag agarose beads with or without 20 mM lactate for 1 h at 4°C.
Stable knockdown of COUP‐TFII
Control short hairpin scramble (shScramble) and shCOUP‐TFII constructs (OriGene Technologies, Rockville, MD) were used for stable knockdown of COUP‐TFII in HCT116 cells. The cells were infected using retroviruses containing shScramble and shCOUP‐TFII followed by selection with puromycin (Sigma) for 2 weeks.
Animal experiments
(i) To investigate the effects of COUP‐TFII suppression and lactate on established tumor growth, HCT116 cells (6 × 10⁶) expressing shCOUP‐TFII or carrying a control vector were injected subcutaneously in 7‐week‐old nude mice. Sodium chloride or sodium l‐lactate (60 μl × g−1 body weight; 150 mM) was administered intraperitoneally every 2 or 3 days 35. (ii) To investigate the effect of trametinib and COUP‐TFII overexpression on established tumor growth, HCT116 cells (6 × 10⁶) expressing COUP‐TFII or carrying a control vector were injected subcutaneously in 7‐week‐old nude mice. After confirmation of palpable xenografted tumor, mice were randomized and treated with vehicle or trametinib (3 mg/kg body weight) per os every 2 or 3 days. Tumor volume was calculated as length × width2 × 0.5 (mm3) using calipers every 2 or 3 days. The last dose of drug was administered 3 h before the experimental endpoint. All animal procedures were approved by the Institutional Animal Care and Use Committee of Kyungpook National University.
Statistical analyses
Statistical analyses were performed using an unpaired t‐test and the Mann–Whitney test. Data are presented as the mean ± SEM. P < 0.05 was considered significant.
Author contributions
J‐KB conceptualized the study, designed the research, and performed the experiments. MP performed the experiments. JWY, JL, JSK, SJC, YML, and I‐KL analyzed and interpreted the data. Y‐KC wrote and edited the manuscript. K‐GP designed the experiments, analyzed and interpreted the data, wrote and edited the manuscript, and supervised the project. All authors reviewed the data and provided feedback on the manuscript.
Conflict of interest
The authors declare that they have no conflict of interest.
Supporting information
Expanded View Figures PDF
Review Process File
Source Data for Figure 1
Source Data for Figure 2
Source Data for Figure 3
Source Data for Figure 4
Source Data for Figure 5
Acknowledgements
This work was supported by the National Research Foundation of Korea (NRF) grants (NRF‐2017M3A9G7073086 and NRF‐2018R1A2A1A05077703) funded by the Ministry of Science and ICT, NRF grant (NRF‐2017R1A6A3A04010231) funded by the Ministry of Education, and grants (HI16C1501) from the Korea Health Technology R&D Project through the Korea Health Industry Development Institute funded by the Ministry of Health and Welfare, Republic of Korea.
EMBO Reports (2019) 20: e47451
See also: D Benjamin & MN Hall (June 2019)
Contributor Information
Yeon‐Kyung Choi, Email: exc4932@hanmail.net.
Keun‐Gyu Park, Email: kpark@knu.ac.kr.
References
- 1. Sever R, Brugge JS (2015) Signal transduction in cancer. Cold Spring Harb Perspect Med 5: a006098 [DOI] [PMC free article] [PubMed] [Google Scholar]
- 2. Huang J, Manning BD (2008) The TSC1‐TSC2 complex: a molecular switchboard controlling cell growth. Biochem J 412: 179–190 [DOI] [PMC free article] [PubMed] [Google Scholar]
- 3. Lien EC, Lyssiotis CA, Cantley LC (2016) Metabolic reprogramming by the PI3K‐Akt‐mTOR pathway in cancer. Recent Results Cancer Res 207: 39–72 [DOI] [PubMed] [Google Scholar]
- 4. Ying H, Kimmelman AC, Lyssiotis CA, Hua S, Chu GC, Fletcher‐Sananikone E, Locasale JW, Son J, Zhang H, Coloff JL, et al (2012) Oncogenic Kras maintains pancreatic tumors through regulation of anabolic glucose metabolism. Cell 149: 656–670 [DOI] [PMC free article] [PubMed] [Google Scholar]
- 5. Liberti MV, Locasale JW (2016) The Warburg effect: how does it benefit cancer cells? Trends Biochem Sci 41: 211–218 [DOI] [PMC free article] [PubMed] [Google Scholar]
- 6. Romero‐Garcia S, Moreno‐Altamirano MM, Prado‐Garcia H, Sanchez‐Garcia FJ (2016) Lactate contribution to the tumor microenvironment: mechanisms, effects on immune cells and therapeutic relevance. Front Immunol 7: 52 [DOI] [PMC free article] [PubMed] [Google Scholar]
- 7. Semenza GL (2008) Tumor metabolism: cancer cells give and take lactate. J Clin Invest 118: 3835–3837 [DOI] [PMC free article] [PubMed] [Google Scholar]
- 8. Lee DC, Sohn HA, Park ZY, Oh S, Kang YK, Lee KM, Kang M, Jang YJ, Yang SJ, Hong YK, et al (2015) A lactate‐induced response to hypoxia. Cell 161: 595–609 [DOI] [PubMed] [Google Scholar]
- 9. Tsai SY, Tsai MJ (1997) Chick ovalbumin upstream promoter‐transcription factors (COUP‐TFs): coming of age. Endocr Rev 18: 229–240 [DOI] [PubMed] [Google Scholar]
- 10. Qin J, Wu SP, Creighton CJ, Dai F, Xie X, Cheng CM, Frolov A, Ayala G, Lin X, Feng XH, et al (2013) COUP‐TFII inhibits TGF‐beta‐induced growth barrier to promote prostate tumorigenesis. Nature 493: 236–240 [DOI] [PMC free article] [PubMed] [Google Scholar]
- 11. Lin SC, Kao CY, Lee HJ, Creighton CJ, Ittmann MM, Tsai SJ, Tsai SY, Tsai MJ (2016) Dysregulation of miRNAs‐COUP‐TFII‐FOXM1‐CENPF axis contributes to the metastasis of prostate cancer. Nat Commun 7: 11418 [DOI] [PMC free article] [PubMed] [Google Scholar]
- 12. Wang L, Xu M, Qin J, Lin SC, Lee HJ, Tsai SY, Tsai MJ (2016) MPC1, a key gene in cancer metabolism, is regulated by COUPTFII in human prostate cancer. Oncotarget 7: 14673–14683 [DOI] [PMC free article] [PubMed] [Google Scholar]
- 13. Wu SP, Kao CY, Wang L, Creighton CJ, Yang J, Donti TR, Harmancey R, Vasquez HG, Graham BH, Bellen HJ, et al (2015) Increased COUP‐TFII expression in adult hearts induces mitochondrial dysfunction resulting in heart failure. Nat Commun 6: 8245 [DOI] [PMC free article] [PubMed] [Google Scholar]
- 14. Ceni E, Mello T, Polvani S, Vasseur‐Cognet M, Tarocchi M, Tempesti S, Cavalieri D, Beltrame L, Marroncini G, Pinzani M, et al (2017) The orphan nuclear receptor COUP‐TFII coordinates hypoxia‐independent proangiogenic responses in hepatic stellate cells. J Hepatol 66: 754–764 [DOI] [PubMed] [Google Scholar]
- 15. More E, Fellner T, Doppelmayr H, Hauser‐Kronberger C, Dandachi N, Obrist P, Sandhofer F, Paulweber B (2003) Activation of the MAP kinase pathway induces chicken ovalbumin upstream promoter‐transcription factor II (COUP‐TFII) expression in human breast cancer cell lines. J Endocrinol 176: 83–94 [DOI] [PubMed] [Google Scholar]
- 16. Lee MN, Kim JW, Oh SH, Jeong BC, Hwang YC, Koh JT (2016) FGF2 stimulates COUP‐TFII expression via the MEK1/2 pathway to inhibit osteoblast differentiation in C3H10T1/2 cells. PLoS ONE 11: e0159234 [DOI] [PMC free article] [PubMed] [Google Scholar]
- 17. Kim HK, Lee I, Bang H, Kim HC, Lee WY, Yun SH, Lee J, Lee SJ, Park YS, Kim KM, et al (2018) MCT4 expression is a potential therapeutic target in colorectal cancer with peritoneal carcinomatosis. Mol Cancer Ther 17: 838–848 [DOI] [PubMed] [Google Scholar]
- 18. Kinsman BJ, Browning KN, Stocker SD (2017) NaCl and osmolarity produce different responses in organum vasculosum of the lamina terminalis neurons, sympathetic nerve activity and blood pressure. J Physiol 595: 6187–6201 [DOI] [PMC free article] [PubMed] [Google Scholar]
- 19. Pylayeva‐Gupta Y, Grabocka E, Bar‐Sagi D (2011) RAS oncogenes: weaving a tumorigenic web. Nat Rev Cancer 11: 761–774 [DOI] [PMC free article] [PubMed] [Google Scholar]
- 20. Qin J, Chen X, Yu‐Lee LY, Tsai MJ, Tsai SY (2010) Nuclear receptor COUP‐TFII controls pancreatic islet tumor angiogenesis by regulating vascular endothelial growth factor/vascular endothelial growth factor receptor‐2 signaling. Cancer Res 70: 8812–8821 [DOI] [PMC free article] [PubMed] [Google Scholar]
- 21. Qin J, Chen X, Xie X, Tsai MJ, Tsai SY (2010) COUP‐TFII regulates tumor growth and metastasis by modulating tumor angiogenesis. Proc Natl Acad Sci USA 107: 3687–3692 [DOI] [PMC free article] [PubMed] [Google Scholar]
- 22. Saxton RA, Sabatini DM (2017) mTOR signaling in growth, metabolism, and disease. Cell 168: 960–976 [DOI] [PMC free article] [PubMed] [Google Scholar]
- 23. Sancak Y, Peterson TR, Shaul YD, Lindquist RA, Thoreen CC, Bar‐Peled L, Sabatini DM (2008) The Rag GTPases bind raptor and mediate amino acid signaling to mTORC1. Science 320: 1496–1501 [DOI] [PMC free article] [PubMed] [Google Scholar]
- 24. Kim E, Goraksha‐Hicks P, Li L, Neufeld TP, Guan KL (2008) Regulation of TORC1 by Rag GTPases in nutrient response. Nat Cell Biol 10: 935–945 [DOI] [PMC free article] [PubMed] [Google Scholar]
- 25. Menon S, Dibble CC, Talbott G, Hoxhaj G, Valvezan AJ, Takahashi H, Cantley LC, Manning BD (2014) Spatial control of the TSC complex integrates insulin and nutrient regulation of mTORC1 at the lysosome. Cell 156: 771–785 [DOI] [PMC free article] [PubMed] [Google Scholar]
- 26. Sancak Y, Thoreen CC, Peterson TR, Lindquist RA, Kang SA, Spooner E, Carr SA, Sabatini DM (2007) PRAS40 is an insulin‐regulated inhibitor of the mTORC1 protein kinase. Mol Cell 25: 903–915 [DOI] [PubMed] [Google Scholar]
- 27. Long X, Lin Y, Ortiz‐Vega S, Yonezawa K, Avruch J (2005) Rheb binds and regulates the mTOR kinase. Curr Biol 15: 702–713 [DOI] [PubMed] [Google Scholar]
- 28. Deng L, Chen L, Zhao L, Xu Y, Peng X, Wang X, Ding L, Jin J, Teng H, Wang Y, et al (2019) Ubiquitination of Rheb governs growth factor‐induced mTORC1 activation. Cell Res 29: 136–150 [DOI] [PMC free article] [PubMed] [Google Scholar]
- 29. Fawal MA, Brandt M, Djouder N (2015) MCRS1 binds and couples Rheb to amino acid‐dependent mTORC1 activation. Dev Cell 33: 67–81 [DOI] [PubMed] [Google Scholar]
- 30. San‐Millan I, Brooks GA (2017) Reexamining cancer metabolism: lactate production for carcinogenesis could be the purpose and explanation of the Warburg Effect. Carcinogenesis 38: 119–133 [DOI] [PMC free article] [PubMed] [Google Scholar]
- 31. Schindelin J, Arganda‐Carreras I, Frise E, Kaynig V, Longair M, Pietzsch T, Preibisch S, Rueden C, Saalfeld S, Schmid B, et al (2012) Fiji: an open‐source platform for biological‐image analysis. Nat Methods 9: 676–682 [DOI] [PMC free article] [PubMed] [Google Scholar]
- 32. Dunn KW, Kamocka MM, McDonald JH (2011) A practical guide to evaluating colocalization in biological microscopy. Am J Physiol Cell Physiol 300: C723–C742 [DOI] [PMC free article] [PubMed] [Google Scholar]
- 33. Smith EM, Finn SG, Tee AR, Browne GJ, Proud CG (2005) The tuberous sclerosis protein TSC2 is not required for the regulation of the mammalian target of rapamycin by amino acids and certain cellular stresses. J Biol Chem 280: 18717–18727 [DOI] [PubMed] [Google Scholar]
- 34. Carroll B, Maetzel D, Maddocks OD, Otten G, Ratcliff M, Smith GR, Dunlop EA, Passos JF, Davies OR, Jaenisch R, et al (2016) Control of TSC2‐Rheb signaling axis by arginine regulates mTORC1 activity. Elife 5: e11058 [DOI] [PMC free article] [PubMed] [Google Scholar]
- 35. Angelin A, Gil‐de‐Gomez L, Dahiya S, Jiao J, Guo L, Levine MH, Wang Z, Quinn WJ III, Kopinski PK, Wang L, et al (2017) Foxp3 reprograms T cell metabolism to function in low‐glucose. high‐lactate environments. Cell Metab 25: 1282–1293.e7 [DOI] [PMC free article] [PubMed] [Google Scholar]
Associated Data
This section collects any data citations, data availability statements, or supplementary materials included in this article.
Supplementary Materials
Expanded View Figures PDF
Review Process File
Source Data for Figure 1
Source Data for Figure 2
Source Data for Figure 3
Source Data for Figure 4
Source Data for Figure 5