Abstract
RNA binding proteins, including IMP1/IGF2BP1, are essential regulators of intestinal development and cancer. Imp1 hypomorphic mice exhibit gastrointestinal growth defects, yet the specific role for IMP1 in colon epithelial repair is unclear. Our prior work revealed that intestinal epithelial cell‐specific Imp1 deletion (Imp1 Δ IEC) was associated with better regeneration in mice after irradiation. Here, we report increased IMP1 expression in patients with Crohn's disease and ulcerative colitis. We demonstrate that Imp1 Δ IEC mice exhibit enhanced recovery following dextran sodium sulfate (DSS)‐mediated colonic injury. Imp1 Δ IEC mice exhibit Paneth cell granule changes, increased autophagy flux, and upregulation of Atg5. In silico and biochemical analyses revealed direct binding of IMP1 to MAP1LC3B,ATG3, and ATG5 transcripts. Genetic deletion of essential autophagy gene Atg7 in Imp1 Δ IEC mice revealed increased sensitivity of double‐mutant mice to colonic injury compared to control or Atg7 single mutant mice, suggesting a compensatory relationship between Imp1 and the autophagy pathway. The present study defines a novel interplay between IMP1 and autophagy, where IMP1 may be transiently induced during damage to modulate colonic epithelial cell responses to damage.
Keywords: colonic repair, IGF2BP1, IMP1, inflammatory bowel disease, RNA binding protein
Subject Categories: Autophagy & Cell Death, Molecular Biology of Disease, Protein Biosynthesis & Quality Control
Introduction
Intestinal epithelium maintains its integrity through orchestration of self‐renewal, proliferation, differentiation, and cell death. The rapidity with which intestinal epithelium must respond to environmental stressors suggests a necessity for multiple layers of gene regulation. RNA binding proteins have emerged as critical regulators of intestinal proliferation and stem cell dynamics 1, 2, 3, 4, 5, 6, 7. IGF2 mRNA‐binding protein 1 (IMP1, IGF2BP1) is an RNA binding protein with roles in mRNA trafficking, localization, and stability. Target mRNAs of IMP1 (orthologues include CRD‐BP, ZBP1) include IGF2, ACTB, MYC, H19, CD44, GLI1, and PTGS2 8, 9, 10, 11, 12, 13, 14, 15. In vitro studies demonstrate that IMP1 forms stable complexes with its target mRNAs, confining these transcripts to ribonucleoprotein particles (RNPs) and stabilizing mRNA or inhibiting translation 13, 14, 16, 17, 18, 19, 20, 21, 22, 23. IMP1 also plays a functional role in mRNA transport to aid in cellular processes including movement and polarity 13, 24. Photoactivatable ribonucleoside‐enhanced crosslinking and immunoprecipitation (PAR‐CLIP) and enhanced crosslinking and immunoprecipitation (eCLIP) studies have identified a myriad of IMP1 targets, providing important insight into the diverse roles of IMP1 via regulation of specific transcripts 25, 26. Finally, recent reports suggest that IMP proteins are “readers” of N 6‐methyladenosine (m6A) modified mRNAs, which may impart binding and functional specificity of IMPs to regulate mRNA storage and stability 27.
In mice, Imp1 is expressed in the small intestine and colon during embryonic development through postnatal day 12 and at low levels during adulthood 28. Imp1 hypomorphic mice exhibit dwarfism, intestinal defects, and perinatal lethality 28, 29. In these mice, development of the intestine was impaired and mucosal thickness was significantly reduced. These mice had diminished villi and crypts which was associated with severe malabsorption, but no obvious impairment of cellular lineages. Recent studies in the fetal mouse brain implicate Imp1 as a regulator of differentiation of stem/progenitor cells, where Imp1 deletion leads to neural stem cell depletion 30. In adult mouse colon, IMP1 is expressed in the epithelial crypt base and in mesenchymal cells following injury 15, 31. Our prior published studies demonstrated that IMP1 may promote or suppress colon tumorigenesis based upon its expression and function in the epithelial or mesenchymal compartments, underscoring the notion that IMP1 may exhibit opposing effects in different contexts 32, 33. Taken together, prior in vivo studies suggest that IMP1 is a key regulator of development and cancer, potentially via regulation of stem/progenitor cell maintenance 34. We recently demonstrated that Imp1 is expressed in intestinal epithelial stem cells and that Imp1 deletion in these cells promotes enhanced regeneration following whole body irradiation, suggesting that Imp1 may play an integral role in modulating tissue damage responses in the gut 35.
Prior in vitro reports have suggested a role for IMP1 in cellular stress response. Studies of the IMP1 chicken orthologue, ZBP1, revealed an essential role in the integrated stress response (ISR) via differential regulation of mRNA fates in non‐stressed versus stressed cells 18. Characterization of IMP1 RNP granules in vitro revealed enrichment of mRNAs encoding proteins involved in the secretory pathway, ER stress, and ubiquitin‐dependent metabolism 36. Furthermore, evaluation of processing bodies (P‐bodies) using fluorescence‐activated particle sorting (FAPS) demonstrated enrichment of IMP1 together with translationally repressed mRNAs, suggesting that IMP1 may stabilize and/or repress target mRNAs 37. Despite its considerable importance in normal development and its role in coordinating cellular stress, the specific mechanistic roles of IMP1 in adult tissues have yet to be elucidated in vivo. The focus and goal for the present study is to demonstrate functional roles of IMP1 in the adult gastrointestinal epithelium (where IMP1 is dynamically expressed following damage) in order to understand how these findings may be relevant to human disease.
Results
IMP1 is upregulated in patients with Crohn's disease and ulcerative colitis
Previous studies demonstrated that Imp1 exhibits heterochronic expression in mice during development, has low expression in adult tissues, and is highly expressed in multiple cancers. Our recent study revealed Imp1 upregulation in intestinal epithelial cells in response to whole body irradiation 35; however, the mechanistic role for Imp1 in regulating epithelial damage remains unknown. We evaluated whole tissue biopsies from adult patients with Crohn's disease and ulcerative colitis (Table 1) in order to ascertain IMP1 expression in human disease. We observed a > 5‐fold increase in IMP1 RNA levels in both Crohn's disease (5.3 ± 1.81) and ulcerative colitis mucosal biopsies as compared to those from control subjects (6.6 ± 2.6; Fig 1A). We confirmed IMP1 overexpression in patients with Crohn's disease via immunohistochemistry, where we observed both epithelial and stromal IMP1 staining and confirmed little or absent IMP1 expression in healthy control patients (Fig 1B). Consistent with these findings, analysis of published the Pediatric RISK Stratification Study (RISK) cohort of RNA‐sequencing data 38 from pediatric patients with Crohn's disease (CD) patients revealed that IMP1 is upregulated significantly compared to control patients and that this effect is specific to IMP1 (i.e., other distinct isoforms, IMP2 and IMP3, are not changed; Fig 1C).
Table 1.
Patient demographics
| Analysis | Type | Sex | Age |
|---|---|---|---|
| qPCR | Control | Female | 66 |
| Control | Male | 64 | |
| Control | Male | 76 | |
| Control | Male | 61 | |
| Control | Male | 62 | |
| Control | No info given | No info given | |
| CD | Male | 21 | |
| CD | Female | 73 | |
| CD | Female | 28 | |
| CD | Male | 20 | |
| CD | Female | 32 | |
| CD | Female | 22 | |
| CD | No info given | No info given | |
| CD | Female | 49 | |
| UC | Male | 74 | |
| UC | Male | 32 | |
| UC | Male | 30 | |
| UC | Female | 57 | |
| UC | Male | 64 | |
| UC | Female | 56 | |
| IHC | Control | Female | 40 |
| Control | Male | 38 | |
| Control | Male | 47 | |
| Control | Male | 54 | |
| CD | Male | 65 | |
| CD | Female | 66 | |
| CD | Female | 61 | |
| CD | Female | 55 |
CD, Crohn's disease; IHC, Immunohistochemistry; UC, Ulcerative colitis.
Figure 1. IMP1 is upregulated in patients with Crohn's disease and ulcerative colitis.
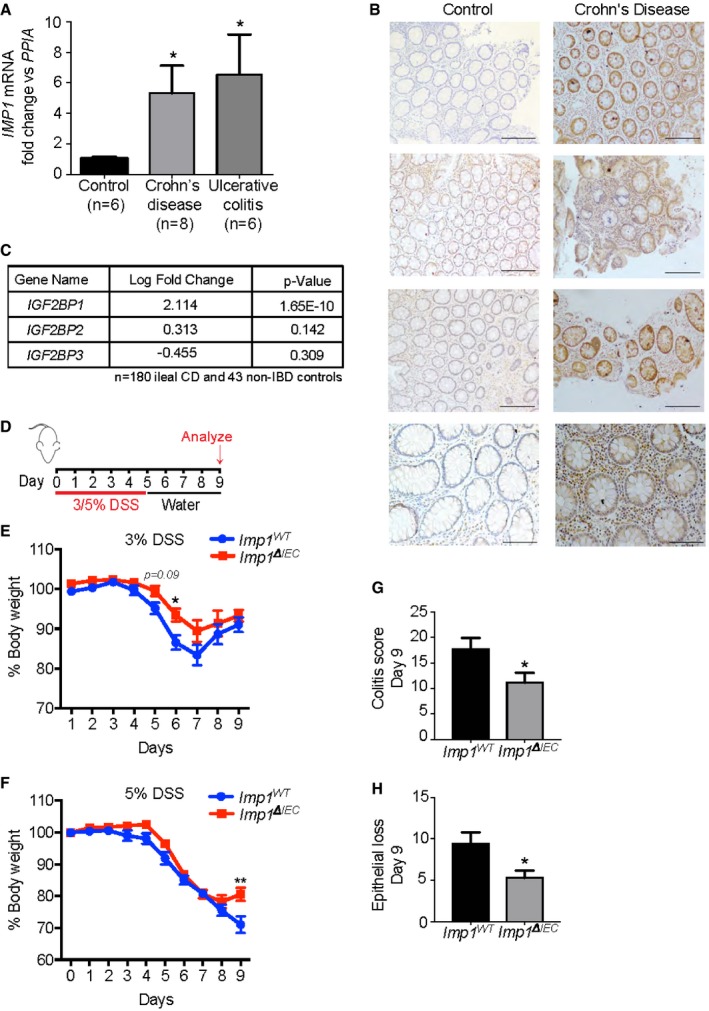
- qPCR analysis for IMP1 expression in colon biopsy samples from adult ulcerative colitis (UC) and Crohn's disease (CD) patients. IMP1 expression is > 5‐fold higher in UC (6.554 ± 2.609, n = 6; P‐value = 0.0302) and CD samples (5.314 ± 1.807, n = 8; P‐value = 0.0343) as compared to control samples (1 ± 0.1245, n = 6).
- Representative immunohistochemistry demonstrating IMP1 expression in colon biopsy samples from CD patients and normal adults (Scale bars = 500 μm).
- Differential gene expression analysis of pediatric ileal CD patient samples (n = 180) shows increased (> 4‐fold) IMP1 expression as compared to non‐inflammatory bowel disease (IBD) pediatric samples (n = 43).
- Experiment schematic. Mice were given either 3% or 5% dextran sodium sulfate (DSS) in drinking water for 5 days followed by 4 days of recovery.
- With 3% DSS, mice with Imp1 deletion [Imp1 ΔIEC (n = 8)] lost significantly less weight compared to controls (Imp1 WT (n = 18); P‐value = 0.0259 at day 6).
- With 5% DSS, Imp1 ΔIEC mice began to regain weight at day 9 compared to controls (Imp1 WT (n = 22) and Imp1 ΔIEC (n = 16; P‐value = 0.0104).
- Imp1 ΔIEC mice show significantly less total colitis (11.14 ± 1.933, n = 7; scored blinded by a pathologist) as compared to Imp1 WT mice (17.75 ± 2.144, n = 8) after 5% DSS (P‐value = 0.0415).
- Imp1 ΔIEC mice show significantly less epithelial loss (5.286 ± 0.865, n = 7) as compared to Imp1 WT mice (9.375 ± 1.375, n = 8) after 5% DSS (P‐value = 0.0303).
Intestinal epithelial Imp1 deletion attenuates the effects of DSS‐mediated colonic damage
Our recent publication revealed that mice with Imp1 deletion in intestinal and colonic epithelium (VillinCre; Imp1 fl/fl, referred to as Imp1 ΔIEC mice; Fig EV1A) exhibit enhanced recovery following 12 Gy whole body irradiation, where Imp1 ΔIEC mice formed significantly more regenerative microcolonies in small intestine compared to control mice 35. To determine the role for Imp1 during colonic injury, we evaluated Imp1 ΔIEC mice using the dextran sodium sulfate (DSS) model, which leads to robust colonic epithelial damage (Fig 1D). Imp1 WT and Imp1 ΔIEC mice exhibited similar weight loss during initial days of 3% DSS treatment, but Imp1 ΔIEC mice exhibited less weight loss during recovery starting at day 6 (1 day following the cessation of DSS treatment, Fig 1E). We next evaluated mice treated with higher (5%) DSS levels and evaluated mice at day 5 when damage level is peak. While we did not observe significant differences in weight loss or histological colitis score between genotypes at day 5 of 5% DSS (Fig EV1B and C), we did observe that 5% DSS‐treated Imp1 ΔIEC mice regain more weight at day 9 (4 days following the cessation of DSS, Fig 1F) and exhibited significantly lower histological colitis and epithelial loss scores compared to controls at this key time point in epithelial recovery (Fig 1G and H). Taken together, these data suggest that IMP1 is robustly upregulated during chronic inflammation in patients with inflammatory bowel disease and mice with intestinal epithelial Imp1 deletion exhibit an increase in recovery following acute colonic damage.
Figure EV1. Effect of IMP1 loss in colitis models.
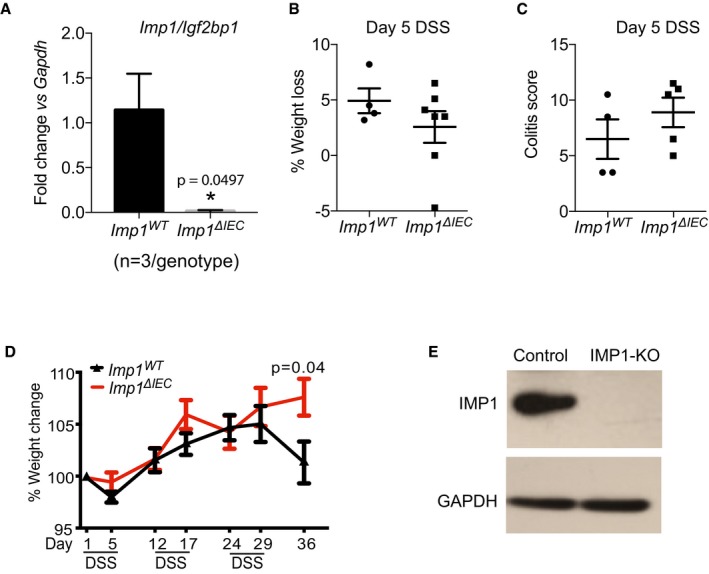
- qPCR data showing expression of Imp1 in epithelium from small intestinal tissue from Imp1 WT (1.142 ± 0.4055) and Imp1 ΔIEC (0.013 ± 0.009) mice (n = 3 per genotype).
- The Imp1 ΔIEC (n = 5) mice show no difference in weight loss as compared to Imp1 WT mice (n = 4) at day 5 during 5% acute dextran sodium sulfate (DSS).
- The Imp1 ΔIEC mice (n = 5) show no difference in colitis score as compared to Imp1 WT mice (n = 4) at day 5 during 5% acute DSS.
- The Imp1 ΔIEC mice (n = 13) show a trend toward decreased percentage weight loss as compared to Imp1 WT mice (n = 7) during chronic DSS significantly at day 36.
- Representative western blot showing IMP1 deletion in SW480 cells after CRISPR transfection as compared to controls.
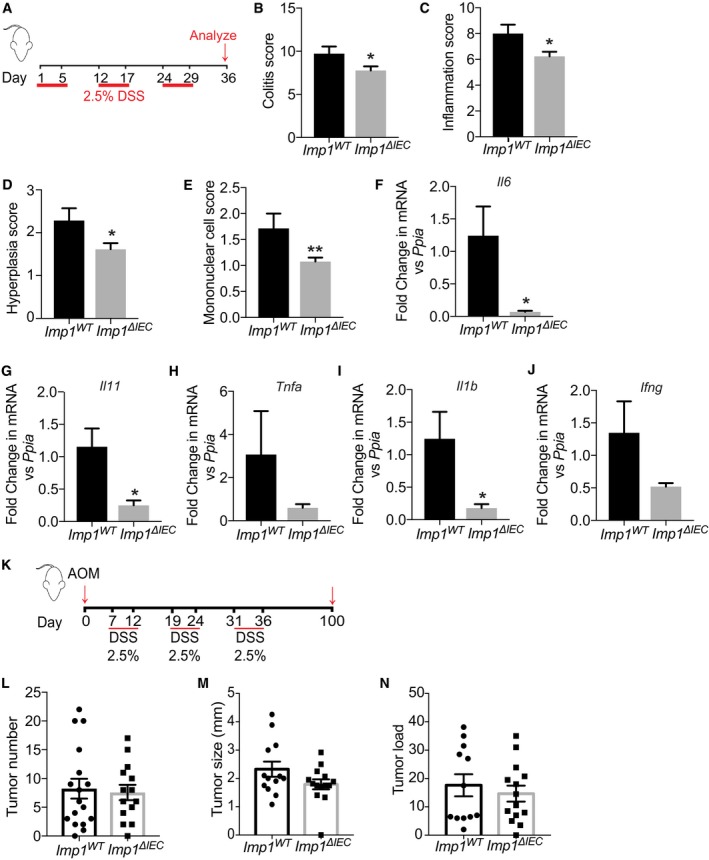
We next evaluated Imp1 ΔIEC mice during chronic DSS (Fig 2A). We found that Imp1 ΔIEC mice exhibited less weight loss at the termination of the chronic DSS protocol compared to controls (Fig EV1B–D), and this was associated with a significant decrease in histological colitis, inflammation, hyperplasia, and mononuclear cell score in Imp1 ΔIEC mice (Fig 2B–E). In addition, expression of Il6, Il11, Tnf, Il1b, and Ifng cytokines in colonic tissue was decreased in Imp1 ΔIEC mice (Fig 2F–J). Together, these observations suggest that Imp1 loss in colonic epithelium is associated with an attenuated response to chronic, DSS‐induced epithelial damage, allowing for better regeneration following inflammation. Because Imp1 loss was associated with less damage/better repair, we evaluated whether Imp1 ΔIEC mice were more susceptible to inflammation (DSS)‐associated tumorigenesis 39. We subjected mice to the azoxymethane (AOM)‐DSS model of colitis‐associated tumorigenesis to determine the phenotypic consequence of Imp1 deletion upon tumor growth (Fig 2K). We did not observe a significant difference in tumor number, size, or load between the Imp1 WT and Imp1 ΔIEC mice (Fig 2L–N). This is intriguing, since our prior studies demonstrated that stromal Imp1 deletion was associated with enhanced tumor growth 33. Taken together, the present findings suggest that colonic epithelial cells with Imp1 deletion regenerate better following damage than mice with wild‐type Imp1; however, these mechanisms do not render Imp1 ΔIEC mice more or less susceptible AOM‐DSS tumorigenesis.
Figure 2. Intestinal epithelial Imp1 deletion attenuates the effects of DSS‐mediated colonic damage.
-
AMice were given three cycles of 2.5% dextran sodium sulfate (DSS) in drinking water for 5 days followed by a week of recovery. Mice were analyzed at day 36.
-
BImp1 ΔIEC mice show significantly less total colitis (7.769 ± 0.4824, n = 13; scored blinded by a pathologist) as compared to Imp1 WT mice (9.714 ± 0.8371, n = 7; P‐value = 0.0435).
-
CImp1 ΔIEC mice show significantly less hyperplasia (1.615 ± 0.1404, n = 13) as compared to Imp1 WT mice (2.286 ± 0.2857, n = 7; P‐value = 0.0287).
-
DImp1 ΔIEC mice show significantly less inflammation score (6.231 ± 0.3608, n = 13) as compared to Imp1 WT mice (8 ± 0.6901, n = 7; P‐value = 0.0213).
-
EImp1 ΔIEC mice show significantly less mononuclear cell infiltration (1.077 ± 0.076, n = 13) as compared to Imp1 WT mice (1.714 ± 0.2857, n = 7; P‐value = 0.0128).
-
F–JqPCR data showing cytokine expression following chronic DSS treatment in colon epithelium of Imp1 WT (n = 4) and Imp1 ΔIEC mice (n = 6) at day 36 (P‐values are as follows: 0.0109 for Il6, 0.0107 for Il11, and 0.0240 for Il1b).
-
KTumors were induced in Imp1 WT and Imp1 ΔIEC mice using the azoxymethane/dextran sodium sulfate (AOM/DSS) model.
-
LTumors were evaluated 14 weeks after the initial AOM injection. Imp1 WT (8.235 ± 1.723, n = 17, 5F/12M) and Imp1 ΔIEC (7.571 ± 1.337, n = 14, 7F/7M) mice do not show any significant difference in tumor initiation.
-
M, NImp1 WT and Imp1 ΔIEC mice do not show any significant differences in tumor size or load. Imp1 WT n = 17, 5F/12M; Imp1 ΔIEC n = 12, 7F/7M.
IMP1 deletion is associated with changes in mRNA abundance and translation efficiency
Our finding that Imp1 ΔIEC mice exhibit better regeneration after chronic DSS compelled us to evaluate putative pathways underlying this phenotype. We demonstrated recently that IMP1 deletion in LIN28B overexpression cells is associated with global changes in translation efficiency 35. We therefore used ribosome profiling to evaluate changes in protein translation in the SW480 colorectal cancer cells with IMP1 deletion (Fig EV1E). Following deep sequencing to compare total RNA abundance, RNA fragments protected by bound ribosomes (ribosome protected fragments, RPFs) were sequenced to define actively translating mRNAs (Data deposited in GEO (GSE112305) [NCBI tracking system #18999297]). We found that IMP1 deletion affected gene expression at both mRNA abundance and RPF levels. Of the 10,043 genes analyzed, 7,386 exhibited no change in mRNA abundance or RPFs. We observed that 642 transcripts were exclusively changed at the mRNA abundance level, whereas 1,264 genes were changed only at the RPF level. The rest of the genes were regulated on both the mRNA abundance and RPF level (Fig 3A).
Figure 3. IMP1 deletion increased level of proteins in the autophagy pathway.
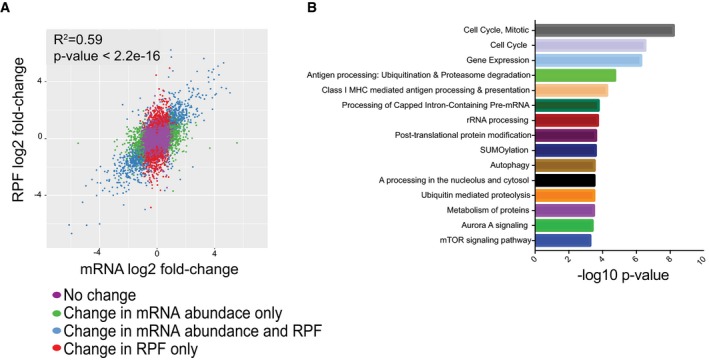
- Scatterplot of differential expression between SW480 cells with and without IMP1 deletion. The log2 fold change between ribosome‐bound RNAs (ribosome protected fragments, or RPF) and total mRNA is plotted. The plot indicates that IMP1 loss is associated with changes in mRNA abundance and RPF.
- Pathway analysis of genes with differential translational efficiencies between SW480 cells with and without IMP1 deletion to define signaling/effector pathways that are enriched with IMP1 deletion.
Translational efficiency of a gene is defined as the ratio of abundance in RPF to that of total mRNA abundance for a gene 40. Cells with IMP1 deletion exhibited differential translational efficiency for 1,469 genes (all translational efficiency data is listed in Dataset EV1). Pathway enrichment analysis for genes with differential translational efficiency 41 revealed a significant representation of pathways linked to cell cycle, gene expression and RNA processing, post‐translational modification, autophagy, and metabolism (Fig 3B and Table EV1). These analyses (i) support the concept that IMP1 levels can globally affect mRNA abundance and translation efficiency, and (ii) compelled us to consider autophagy as a putative pathway underlying a role for IMP1 in colonic epithelial repair based upon evidence for autophagy as a protective mechanism in the gut 42, 43, 44, 45, 46, 47.
Mice with Imp1 deletion exhibit Paneth cell abnormalities and changes in epithelial cell autophagy
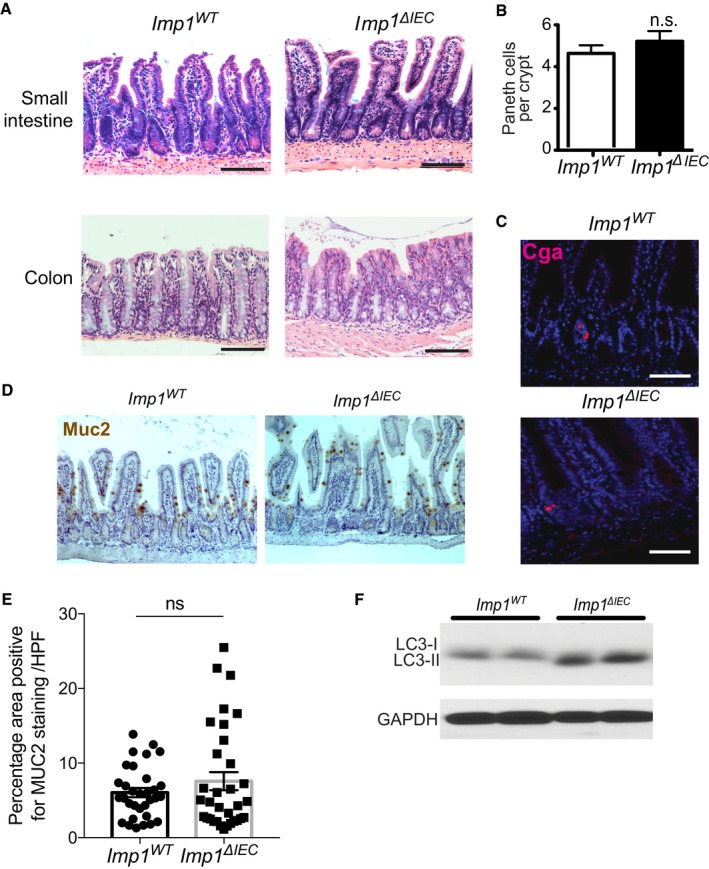
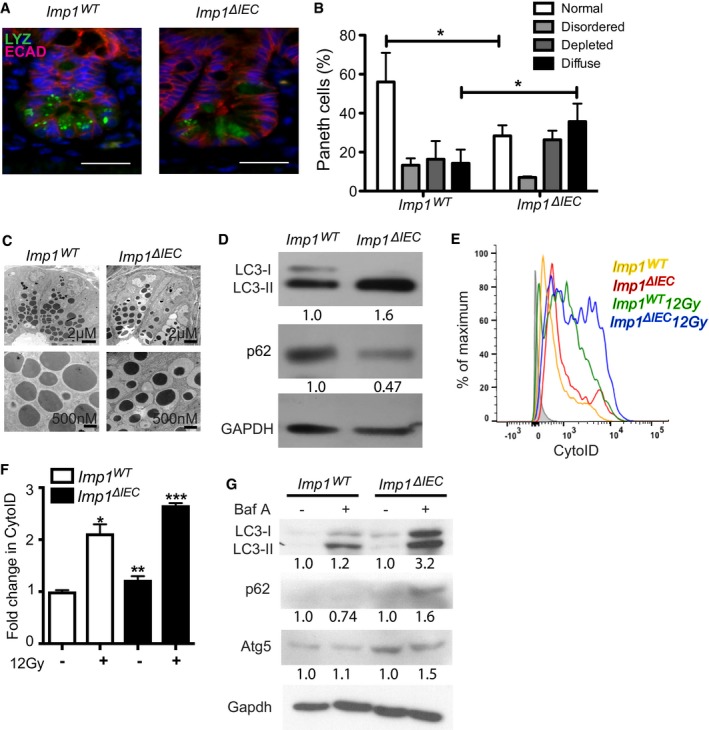
Despite significant morphological defects reported by others in Imp1 hypomorphic mice, including villus blunting and misshapen crypts 28, we did not observe gross phenotypic changes in Imp1 ΔIEC mice where Imp1 is lost solely in intestinal epithelial cells, which suggests that IMP1 is dispensable in this epithelial compartment during homeostasis (Fig EV2A). We analyzed differentiated epithelial cell types and did not observe differences in Paneth, goblet, or enteroendocrine cell numbers between genotypes (Fig EV2B–E); however, we observed diffuse lysozyme staining in Imp1 ΔIEC Paneth cells (Fig 4A and B), which we confirmed using transmission electron microscopy (Fig 4C).
Figure EV2. IMP1 is dispensable during homeostasis.
-
ARepresentative H&E sections showing no overt morphological differences between the small intestine and colon in Imp1 WT and Imp1 ΔIEC mice.
-
BQuantification of Paneth cell number shows no differences between Imp1 WT and Imp1 ΔIEC mice (n = 3 per genotype).
-
CRepresentative immunofluorescence staining showing no differences in enteroendocrine cell (ChromagraninA/CGA) between Imp1 WT and Imp1 ΔIEC mice.
-
D, EGoblet cells from Imp1 WT and Imp1 ΔIEC mice were evaluated histologically using IHC for Muc2. The number of Muc2+ve cells/(high powered field) HPF did not differ between genotypes (n = 3 per genotype). Representative immunohistochemistry staining showing no differences in goblet cell number (Muc2 staining) between Imp1 WT and Imp1 ΔIEC mice.
-
FWestern blot for LC3‐I/LC3‐II in isolated crypts from Imp1 WT and Imp1 ΔIEC mice revealed an increase in cleaved LC3.
Figure 4. Mice with Imp1 deletion exhibit Paneth cell abnormalities and changes in epithelial cell autophagy.
-
APaneth cells from Imp1 WT and Imp1 ΔIEC mice were evaluated histologically using immunofluorescence (IF) for lysozyme (LYZ). E‐cadherin (ECAD) staining was used to demarcate individual epithelial cells. Note presence of diffuse lysozyme staining in Imp1 ΔIEC mice. Scale bar = 25 μm.
-
BPublished lysozyme scoring was utilized to evaluate specific Paneth cell phenotypes. Imp1 ΔIEC mice exhibit a significant shift from normal to diffuse lysozyme phenotype (n = 4 mice per genotype, blinded scoring; P‐value = 0.0116).
-
CTransmission electron microscopy revealed an abundance of smaller, electron dense granules in Imp1 ΔIEC mice compared to control.
-
DWestern blot for cleaved LC3 and p62 in colon epithelial cells from Imp1 WT and Imp1 ΔIEC mice. Blots are representative of three independent experiments with densitometry measurements listed below each band.
-
E, FLive cell staining of autophagic structures with the cationic amphiphilic tracer dye CytoID indicated a significant increase in autophagic vesicle content in crypt epithelial cells from Imp1 ΔIEC mice (n = 8) compared to Imp1 WT mice (n = 7) via flow cytometry (representative histogram plot in E).
-
GCrypt enteroids from control and Imp1 ΔIEC mice treated with Bafilomycin A1 for 12 h. Enteroids were washed with cold PBS and harvested in protein lysis buffer prior to immunoblot. Blot is representative of two independent experiments, representing independent enteroid lines. Densitometry measurements are listed below each band.
Autophagy gene mutations have been associated with Paneth cell granule defects in patients with disease in numerous published studies 48, 49, 50, 51, 52. We therefore evaluated autophagy levels in Imp1 ΔIEC mice. We performed western blotting for cleaved LC3 in freshly isolated colon and jejunum crypt cells, which contain stem, Paneth, and transit‐amplifying cells. An increase in the lipidated form of cleaved LC3 (lower band) coupled with decreased expression of the autophagy cargo‐associated protein p62 suggested that autophagy flux may be increased in Imp1 ΔIEC mice (Fig 4D colon; Fig EV2F jejunum) 53. We observed concurrently a decrease in autophagy cargo‐associated protein p62 in Imp1 ΔIEC colon crypts (Fig 4D). To evaluate changes in autophagy flux by a second method, we utilized freshly isolated, live crypt cells stained with the cationic amphiphilic tracer dye CytoID, which selectively labels autophagic structures 54, 55, 56. We validated CytoID as a tool to measure autophagy in crypt cells via western blot and flow cytometry using Atg7 ΔIEC mice (Fig EV3A and B). CytoID analysis revealed an increase in basal autophagic vesicle content in Imp1 ΔIEC mice compared to Imp1 WT, an effect that was amplified in live cells at day 4 recovery following 12 Gy irradiation (Fig 4E and F). We did not observe significant differences in cell viability between genotypes in this assay (Fig EV3C). Taken together, these data suggest that Imp1 ΔIEC mice exhibit modest, yet significant increases in basal autophagy flux in intestinal epithelium.
Figure EV3. Validation of Atg7 Δ IEC mice.
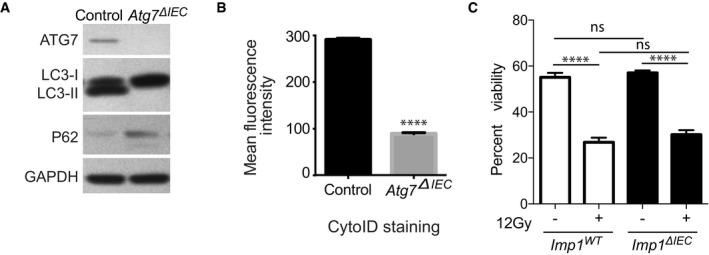
- Representative western blot comparing Atg7 ΔIEC mice and controls. Atg7 ΔIEC mice show no ATG7 expression and decreased autophagic flux indicated by increased p62 and absence of LC3‐II levels.
- Mean fluorescence intensity of CytoID is significantly reduced in epithelial cells From Atg7 ΔIEC mice indicating decreased autophagy (n = 3 per genotype).
- Graph showing percentage of DAPI (4′,6‐diamidino‐2‐phenylindole) negative crypt cells (indicating viability) from Imp1 WT (n = 7) and Imp1 ΔIEC mice (n = 8) using flow cytometry with and without 12 Gy radiation. Although 12 Gy radiation significantly decreased viability, there was a no difference in viability between the two genotypes in either condition.
Ribosome profiling analysis demonstrating increased translation efficiency of the autophagy pathway with IMP1 deletion was consistent with observed increases in LC3 protein levels in both Imp1 ΔIEC mice and IMP1‐KO cells (Figs 4D and EV4A). We observed minimal differences in mRNA levels for autophagy genes in vitro or in vivo (Fig EV4B and C), except for Atg3 and ATG5, which were increased in vitro and in vivo, respectively. We found a significant increase in Atg5 protein levels in Imp1 ΔIEC mice as well (Fig EV4D). To evaluate autophagy flux, we assessed crypt enteroids from Imp1 ΔIEC mice in the presence of the Bafilomycin A, a lysosomotropic agent that inhibits autophagy. We observed a robust increase in cleaved LC3 and accumulated p62 in Bafilomycin A‐treated Imp1 ΔIEC enteroids as compared to Imp1 WT, suggesting higher autophagy flux in knockout enteroids (Fig 4G). These data support Imp1 in intestinal epithelium as a negative regulator of autophagy. Thus, dynamic regulation of Imp1 may serve to modulate autophagy during the reparative response.
Figure EV4. Effect of IMP1 loss on autophagy transcripts and protein in cell lines and mice epithelium.
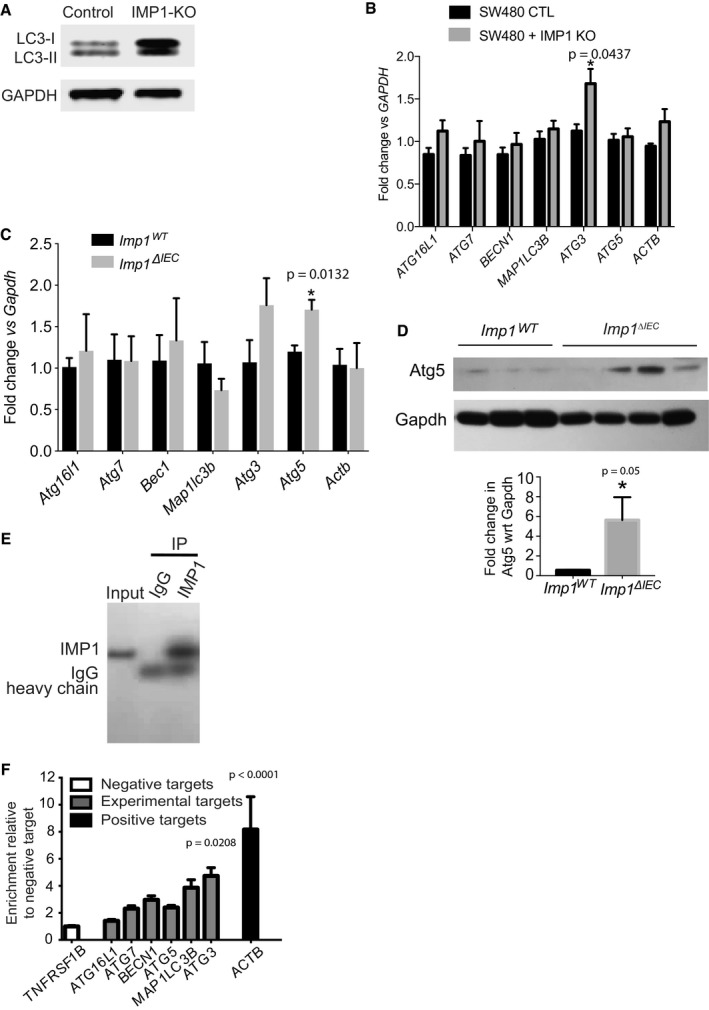
- Representative western blot for LC3‐I/LC3‐II in IMP1‐KO SW480 cells.
- qPCR data showing expression of different autophagy genes in SW480 cells with and without IMP1 deletion (n = 3 per genotype).
- qPCR data showing expression of autophagy genes in purified epithelium from small intestinal tissue from Imp1 WT and Imp1 ΔIEC mice (n = 3 per genotype).
- Immunoblot and quantification (n = 3 WT, four Imp1 ΔIEC) demonstrating upregulation of Atg5 in intestinal epithelium of Imp1 ΔIEC mice compared to controls.
- RIP assay to evaluate binding of endogenous IMP1 to autophagy transcripts in Caco2 cells. Enrichment of IMP1 was confirmed by IP with either IMP1 or control IgG antibodies followed by western blot for IMP1.
- Enrichment of target transcripts over control is represented relative to negative target, TNFRSF1B. Positive control was ACTB (n = 3 independent experiments).
IMP1 interacts with autophagy transcripts
IMP1 is a pleiotropic protein that has been demonstrated to bind directly to a large number of transcripts in cell lines 26, 57. We therefore evaluated putative interactions between IMP1 protein and autophagy transcripts. We first performed in silico analyses to assess binding propensities of IMP1 for autophagy transcripts using catRAPID (fast predictions of RNA and protein interactions and domains at the Center for Genomic Regulation, Barcelona, Catalonia), which predicts RNA:protein interactions based upon nucleotide and polypeptide sequences as well as physicochemical properties 58. These analyses predicted binding of IMP1 to BECN1, MAP1LC3B, and ATG3 transcripts (Fig 5A), as well as the positive control ACTB. IMP1 binding was also predicted to ATG16L1, ATG7, and ATG5, albeit with low binding scores. This algorithm predicted no binding to negative targets TNFRSF1B and ITGA7 26. We next evaluated published IMP1 eCLIP data 26 for the same autophagy transcripts and found positive binding (Fig 5B). We interrogated published eCLIP data for binding location of autophagy transcripts and found that all IMP1 reads on autophagy transcripts were localized on untranslated regions (UTR) regions. Specifically, these analyses revealed IMP1 binding on the 5′UTR for ATG3, ATG5, and BECN1 and 3′UTR for ATG16L1, ATG7, and MAP1LC3B (Table 2).
Figure 5. IMP1 interacts with autophagy transcripts.
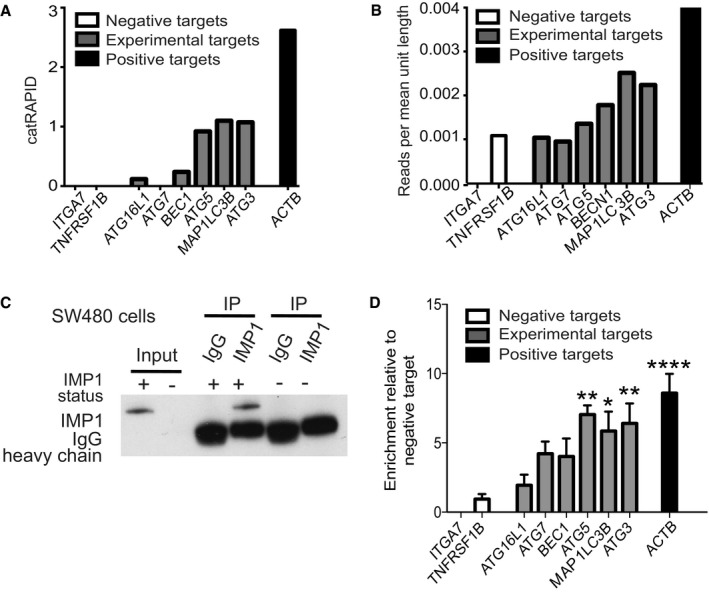
- catRAPID transcript score. For each predicted transcript, we measured the IMP1 interaction propensity with respect to the negative control IgG. Negative targets (ITGA7 and TNFRSF1B) were also evaluated.
- We retrieved CLIP scores from published eCLIP data and compared against the same set of autophagy‐related transcripts analyzed in (A) and found a strong correlation between catRAPID scores and eCLIP data (r = 0.9838465 Pearson correlation coefficient). CLIP data scores were calculated as total number of reads corresponding to the transcript divided by the length of the different isoforms.
- We evaluated binding of endogenous IMP1 to autophagy transcripts using RIP assays in SW480 cells (n = 3). Specific enrichment of IMP1 was confirmed by IP with either IMP1 or control IgG antibodies followed by western blot for IMP1. We used cells with IMP1 deletion as negative control.
- Enrichment of target transcripts over control is represented relative to negative target, TNFRSF1B. ACTB is the positive control (P‐value < 0.0001; n = 3 independent experiments). The targets that are significant are ATG5 (P‐value = 0.0013), MAP1LC3B (P‐value = 0.0148), and ATG3 (P‐value = 0.0052).
Table 2.
eCLIP binding analysis
| Transcript | Number of reads that bind to | ||
|---|---|---|---|
| 5′UTR | CDS | 3′UTR | |
| MAP1LC3B | 0 | 0 | 32 |
| ATG3 | 25 | 0 | 0 |
| ATG16L1 | 0 | 0 | 25 |
| ATG7 | 0 | 0 | 86 |
| ATG5 | 8 | 0 | 0 |
| BECN1 | 20 | 0 | 0 |
CDS, coding determining region; UTR, untranslated regions.
To evaluate IMP1 binding to these targets in colon cancer cell lines, we performed ribonucleoprotein (RNP)‐immunoprecipitation with antibodies to endogenous IMP1 in SW480 (Fig 5C) and Caco2 cells (Fig EV4E and F). Previously confirmed IMP1 target ACTB and negative targets TNFRSF1B and ITGA7 were used as positive and negative controls, respectively. We observed significant enrichment of IMP1 (normalized to input and then negative controls) binding to autophagy genes MAP1LC3B, ATG5, and ATG3 (Fig 5D). ATG7 and BECN1 demonstrated higher enriched binding than negative controls, but these were not significant. Taken together, we demonstrate via three independent methods that IMP1 binds directly to a subset of autophagy transcripts, all of which are required early in the autophagy cascade.
Atg7 deletion augments the response of Imp1 ΔIEC mice to DSS‐induced colonic damage
We reported recently that Imp1 ΔIEC mice recover more efficiently following 12 Gy whole body irradiation 35. To evaluate the relative contribution of autophagy to colonic epithelial responses to DSS in Imp1 ΔIEC mice, we crossed Imp1 ΔIEC mice with mice harboring Atg7‐floxed alleles (Imp1 ΔIEC Atg7 ΔIEC). ATG7 is an essential component of the ATG conjugation system and is critical for early autophagosome formation 59. In addition, prior studies of intestinal epithelial‐specific Atg7 deletion demonstrated loss of autophagic vacuoles via transmission electron microscopy analysis similar to that of intestinal epithelial‐specific knockout of the autophagy genes Atg16L1 or Atg5 43, 60. Interestingly, we found upregulation of Imp1 protein levels with Atg7 deletion (Fig 6A). Prior studies suggest modest enhanced susceptibility to colitis in mice with genetic deletion of Atg7 61. When Atg7 ΔIEC and Imp1 ΔIEC Atg7 ΔIEC mice were treated with 3% DSS and compared to experiments performed in Fig 1E, we found that Imp1 WT, Imp1 ΔIEC, and Atg7 ΔIEC mice exhibited modest weight differences during recovery, whereas Imp1 ΔIEC Atg7 ΔIEC mice exhibited rapid weight loss and did not recover (Fig 6B and C), suggesting a compensatory mechanism between Imp1 and Atg7. Using a higher dose of 5% DSS, we observed that both Atg7 ΔIEC mice and Imp1 ΔIEC Atg7 ΔIEC mice became moribund more rapidly than Imp1 WT and Imp1 ΔIEC mice (Fig EV5A and B).
Figure 6. Atg7 deletion augments the response of Imp1 Δ IEC mice to DSS‐induced colonic damage.
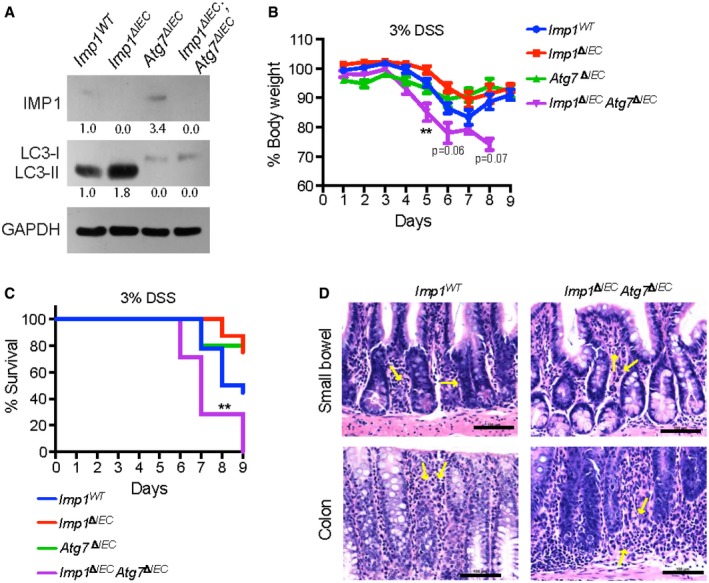
- Representative western blot for cleaved LC3‐II protein in mice with Atg7 deletion (Atg7 ΔIEC and Imp1 ΔIEC ;Atg7 ΔIEC mice). Atg7 ΔIEC mice also exhibit increase in IMP1 expression with densitometry measurements listed below each band.
- Evaluation of weight loss during 3% DSS and recovery for Imp1 WT (n = 18), Imp1 ΔIEC (n = 8), Atg7 ΔIEC (n = 5), and Imp1 ΔIEC ;Atg7 ΔIEC (n = 7) mice. At day 5, Imp1 ΔIEC ;Atg7 ΔIEC mice lose significantly more weight as compared to control mice (P‐value = 0.0076). Note that data for Imp1 WT and Imp1 ΔIEC mice from Fig 1 are presented here for comparison to Atg7 ΔIECand Imp1 ΔIEC ;Atg7 ΔIEC mice, which were performed in a separate cohort.
- Kaplan–Meier curve of the mice used in (B), demonstrating Imp1 ΔIEC Atg7 ΔIEC mice become moribund prior to study endpoint during recovery from 3% DSS compared to controls (P‐value = 0.0082).
- Representative images of blinded examination of small bowel and colon sections from aged Imp1 WT and Imp1 ΔIEC Atg7 ΔIEC mice. Imp1 ΔIEC Atg7 ΔIEC mice exhibited minimal foci of acute inflammation (neutrophils in < 5% of examined mucosa pointed by yellow arrows; Scale bar = 100 μm).
Figure EV5. Effect of acute DSS treatment on mice weight and survival.
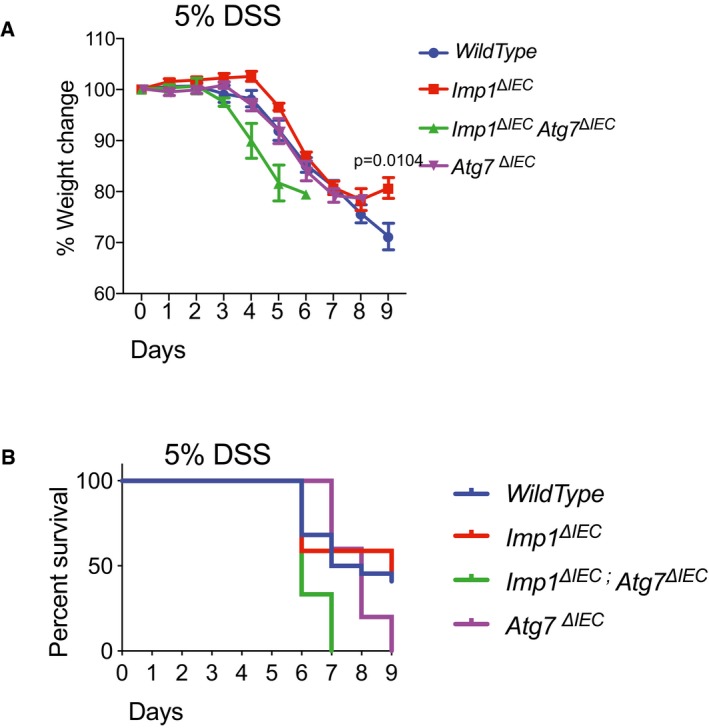
- With 5% DSS treatment, Imp1 ΔIEC mice (n = 17) recover significantly better whereas Imp1 WT mice (n = 22) and Atg7 ΔIEC mice (n = 3) exhibited similar weight loss specifically during recovery, and Imp1 ΔIEC Atg7 ΔIEC mice (n = 5) exhibited rapid weight loss and did not recover.
- Kaplan–Meier curve showing that a significantly higher fraction Imp1 ΔIEC Atg7 ΔIEC mice become moribund before 9 days in acute 5% DSS treatment.
To determine whether concurrent deletion of Imp1 and Atg7 is associated with spontaneous inflammation, we aged these mice for 12 months and evaluated them for histological changes. Blinded examination of colon and small bowel sections revealed no difference between aged Imp1 WT and Imp1 ΔIEC Atg7 ΔIEC mice. Imp1 ΔIEC Atg7 ΔIEC mice exhibited minimal foci of acute inflammation (neutrophils in < 5% of examined mucosa) in 3 of 8 colons and 7 of 8 small bowels; similar findings are seen in control colon (1 of 6) and small bowel (3 of 6; Fig 6D). There were no features that suggest spontaneous chronic enteritis in either group.
Discussion
In the current study, we evaluated roles for the RNA binding protein IMP1 to regulate tissue homeostasis in colonic epithelium. Prior in vivo studies have implicated IMP1's critical function in development, and we and others have demonstrated diverse roles for IMP1 in cancer 28, 32, 33, 35. The present study is the first to uncover in vivo mechanisms for IMP1 during colonic epithelial repair, which could have important implications in human disease. Indeed, we report that IMP1 is upregulated in patients with Crohn's disease and ulcerative colitis and that mice with Imp1 loss exhibit enhanced repair following DSS‐mediated damage.
RNA binding proteins can exhibit pleiotropic roles during homeostasis and stress. IMP1‐containing RNP granules are localized around the nucleus and in cellular projections, containing mRNAs representing up to 3% of the transcriptome in HEK293 cells 36. These granules contain significant enrichment of transcripts encoding proteins involved in ER quality control, Golgi, and secretory vesicles. Recent studies describe IMP1 localization in P‐bodies, which house mRNAs involved in many regulatory processes that are transiently repressed 37. This suggests that IMP1 may modulate repression of target mRNAs in certain contexts. In the present manuscript, we find that IMP1 deletion is associated with increased autophagy, which indicates a putative role for IMP1 to repress this pathway in intestinal epithelial cells (Fig 7). We provide evidence for increased mRNA, protein, and translation efficiency of autophagy pathway components with IMP1 deletion suggesting that IMP1 could affect the autophagy pathway both transcriptionally and translationally, either directly or indirectly. Future studies are required to demonstrate whether IMP1 directly modulates translation of autophagy transcripts in the colonic epithelium.
Figure 7. IMP1 contributes to colonic epithelial repair in part via modulation of autophagy.
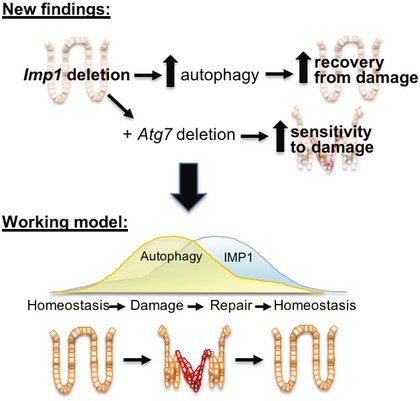
We demonstrate that Imp1 deletion enhances autophagy flux and promotes better recovery from DSS‐induced damage. Deletion of Atg7 in mice with Imp1 deletion increases sensitivity to damage, suggesting that pathways regulated by Imp1 may normally compensate for autophagy loss. These data contribute to a working model whereby dynamic regulation of Imp1 during injury may serve to modulate autophagy during the reparative response.
We cannot exclude a role for IMP1 in regulating autophagy transcript stability. Recent eCLIP studies in human pluripotent stem cells (hPSCs) revealed IMP1 binding largely, but not exclusively, to 3′UTRs to regulate mRNA stability (Conway 26), whereas our analysis of this dataset revealed IMP1 binding to ATG3 and ATG5 transcripts at the 5′UTR. In addition, recent studies described a new role for IMP proteins as “readers” of N 6‐methyladenosine (m6A) modified mRNAs 27. This is intriguing, as emerging studies suggest that autophagy transcripts may be controlled by m6A modification 62. It is therefore likely that IMP1 may modulate the autophagy pathway via multiple mechanisms, which provides one explanation as to why we observe direct binding of some, but not all autophagy transcripts in RIP assays for IMP1 in colon cancer cell lines.
In intestinal epithelial cells (IECs), autophagy can contribute to microbial regulation through packaging and secretion of lysozyme by Paneth cells 63. Independent groups have demonstrated that mice with Atg16l1 gene mutations are more sensitive to colitis or infection, exhibit increased serum IL‐1β and IL‐18, and display diffuse lysozyme staining in Paneth cells 42, 43, 44, 45, 46, 47. Evaluation of Imp1 ΔIEC mice revealed diffuse lysozyme staining. Recent studies have demonstrated that Paneth cells secrete lysozyme via secretory autophagy during bacterial infection through activation of dendritic cell‐innate lymphoid cells circuit 63; however, it remains unclear whether secretory autophagy is engaged as a homeostatic mechanism. As such, it would be interesting to determine whether IMP1 may regulate Paneth cell secretory autophagy in future studies, which could underlie its putative role in patients with inflammatory bowel disease. Our finding that Atg7 deletion sensitizes Imp1 ΔIEC mice to DSS together with data that Imp1 is upregulated with Atg7 deletion suggests a potential compensatory role for pathways regulated by IMP1 and autophagy. Prior studies have demonstrated that the ER stress pathway is upregulated in mice with autophagy deletion and that deletion of both pathways at the same time can promote spontaneous ileitis 60. We therefore evaluated Imp1 ΔIEC Atg7 ΔIEC mice for evidence of spontaneous intestinal inflammation, but did not find any evidence of chronic enteritis in these mice.
We developed recently a transgenic mouse with intestinal epithelial Imp1 overexpression 35 and found that these mice do no exhibit spontaneous inflammation (evaluated up to 16 months of age, unpublished). Therefore, our data demonstrating high IMP1 expression in patients with Crohn's disease and ulcerative colitis suggest that IMP1 may be upregulated as a consequence of chronic stress or inflammation rather than acting as an initiating factor. The upstream signaling pathways that regulate IMP1 expression in intestinal epithelial cells and the fate of IMP1‐bound transcripts (stabilization versus degradation) during chronic inflammation are therefore a key area for future investigation. In summary, the current data contribute to a working model whereby IMP1 may function as a mediator of epithelial repair in part by modulating or compensating for autophagy aberrations in intestinal epithelial cells. More broadly, these studies underscore the importance of evaluating posttranscriptional contributions to gastrointestinal homeostasis and disease.
Materials and Methods
Human sample analyses
Frozen colon tissue and formalin‐fixed paraffin‐embedded (FFPE) samples from adult normal, Crohn's disease, and ulcerative colitis patients were obtained from the Cooperative Human Tissue Network (CHTN) via the University of Pennsylvania Center for Molecular Studies in Digestive and Liver Diseases Molecular Biology and Gene Expression Core. Patient demographics are listed in Table 1. RNA was extracted from frozen tissue using Trizol (Thermo Fisher, Waltham, MA). Publicly available RNA‐sequencing data from the RISK cohort of pediatric ileal Crohn's 38 were evaluated for differential expression of IGF2BP1 (IMP1), IMP2, and IMP3. Sequenced reads were trimmed using Trim Galore! (version 0.4.4), and aligned to the GRCh37 reference genome using STAR, version 2.5.3a. Uniquely mapped reads were quantified by Ensembl gene IDs using featureCounts from Subread version 1.6.0. Lowly or unexpressed genes were removed from the analysis if they showed < 2 counts per million in < 5 samples across all conditions. Read counts were transformed with voom and evaluated for differential expression using limma. Immunohistochemistry for IMP1 in human tissue sections was performed using anti‐IMP1 (Santa Cruz, sc‐21026, Table EV4) using Animal‐Free Blocker (Vector Laboratories).
Mice
Mice were cared for in accordance with University Laboratory Animal Resources requirements under an Institutional Animal Care and Use Committee‐approved protocol. VillinCre;Imp1‐floxed (Imp1 ΔIEC) mice were generated previously 32 and maintained on a C57Bl/6 background. Control mice had floxed, intact alleles (Imp1 WT). Male and female mice were both used at 8–12 weeks. Atg7‐floxed mice were kindly provided by RIKEN BRC through National Bio‐Resource Project of MEXT, Japan 59. Genotyping primers are listed in Table EV2. Mice were housed in specific pathogen‐free conditions and fed standard, irradiated chow and water ad libitum.
Co‐housed control and experimental genotypes were randomized at weaning across multiple cages. Mice were given 3% or 5% dextran sodium sulfate (40,000–50,000 kDa molecular weight; Affymetrix CAS 9011‐18‐1) in drinking water for acute or 2.5% DSS for chronic colitis. During all experiments, body weights were recorded daily, and mice were euthanized before losing a maximum of 25% total body weight or if they began to show poor body condition. Mice that died or were euthanized prior to the study endpoint due to poor body condition were included in weight loss calculations where data points were available. Histological scoring was performed blinded by expert veterinary pathologist Enrico Radaelli and human pathologist Benjamin Wilkins according to published protocols 64. Sample sizes were determined based upon the investigators’ prior experience with specific models (KEH, GDW). Animal numbers are listed in Table EV3. Data for both sexes were combined and analyzed with specific statistical tests indicated in each figure legend.
For AOM/DSS tumor model, adult (8–12 weeks) male and female control and Imp1 ΔIEC mice were given a single intraperitoneal injection of azoxymethane (AOM, Sigma, St Louis, MO) at a dose of 10 mg/kg, followed by three cycles of 2.5% dextran sodium sulfate (DSS, Affymetrix, Santa Clara, CA) for 5 days in the drinking water ad libitum with 1 week of normal water in between each cycle. Mice were sacrificed 14 weeks after the AOM injection. A total of ≥ 14 mice per genotype were tested across two independent experiments. Upon sacrifice, gross colon lesions were evaluated in a blinded fashion (KEH) using a Nikon SMZ645 dissecting stereomicroscope.
qRT‐PCR
Cell line, small intestine, or colon crypt epithelial RNA was isolated using GeneJet RNA purification kit (ThermoFisher). Equal amounts of total RNA were reverse‐transcribed using Taqman RT Reagents kit and resulting cDNA used with Power SYBR Green PCR Master Mix (Applied Biosystems/ThermoFisher) or Taqman Fast Universal PCR Master Mix (Applied Biosystems/ThermoFisher) and validated primer sets (Table EV5). Non‐reverse‐transcribed samples were used as no RT controls. Gene expression was calculated using R = method, where changes in C t values for the genes of interest were normalized to housekeeping genes. All experiments were replicated in at least three independent experiments with technical replicates (duplicates).
Histology
Small intestines were fixed in 10% formalin, processed, and paraffin‐embedded. Immunofluorescence (IF) staining was performed using heat antigen‐retrieval in citric acid buffer (pH 6.0) and staining with antibodies listed in Table EV4. For all staining, no‐primary and/or biological negative controls (Imp1 ΔIEC) were used. Lysozyme scoring was performed according to published protocols 42, 60 by a blinded investigator (ETL). Muc2 scoring was performed by counting the number of Muc2‐positive in 10 high powered (10×) fields taken at random throughout the small intestinal epithelium. Images were taken and counted by an observer blinded to genotype (SFA). Counting was performed using the ImageJ Cell Counter plugin.
Transmission electron microscopy
Mouse small intestine tissues were fixed in cacodylate‐buffered 2.5% (w/v) glutaraldehyde, post‐fixed in 2.0% osmium tetroxide, and then embedded in epoxy resin and ultrathin sections post‐stained in the University of Pennsylvania Electron Microscopy Resource Laboratory. Images were obtained using Jeol‐1010 transmission electron microscope fitted with a Hamamatsu digital camera and AMT Advantage imaging software. A total of four mice per genotype were evaluated by two investigators for Paneth cell granule morphology and representative photographs presented (KEH and BJW) 53. Image contrast was enhanced equally in all photographs.
Western blot
SW480 and Caco2 cells or isolated mouse epithelial cells were harvested in western lysis buffer (Cell Signaling #9803, 10 mM NaF, 1 mM Na3VO4, Halt protease cocktail ThermoFisher #78430), resolved in reducing conditions on 4–12% gradient gels, and detected with ECL Prime Western Blotting Detection Reagent (Amersham; RPN2232). Antibodies are listed in Table EV4. Western blots were reproduced in at least three independent passages of cells representing individual experiments.
Autophagy analyses via CytoID
CytoID Autophagy Detection Kit (Enzo Life Sciences) was used to stain single cell suspensions of crypt‐enriched intestinal epithelium (1:100 in DPBS supplemented with 10% FBS at 37°C for 30 min) and co‐stained with DAPI (4′,6‐diamidino‐2‐phenylindole). Flow cytometry was performed using FACSCanto or LSR II cytometers (BD Biosciences) and FlowJo software (Tree Star). Unstained cells from each specimen were utilized to establish background fluorescence. The percent of CytoID‐positive cells was determined in the live cell fraction (DAPI‐negative). The geometric mean fluorescence intensity for live cells was determined for each specimen following subtraction of background fluorescence. Blinded analysis was utilized (KAW) 54, 65.
Cell lines
Human colon cancer cell line SW480 (ATCC CCL‐228) and Caco2 (ATCC HTB‐37) cells were obtained from ATCC. Cells are tested for mycoplasma at least every 3 months. IMP1 was deleted in SW480 cells by co‐transfecting cells with IMP1 CRISPR/Cas9 KO Plasmid (h) (Santa Cruz; sc‐401703) and IMP‐1 HDR Plasmid (h) (Santa Cruz; sc‐401703 HDR) followed by sorting and clonal expansion of RFP+ve cells.
Ribosome profiling
Ribosome profiling libraries from three pooled cell culture plates were prepared using a standard protocol 66, with minor modifications. Separate 5′ and 3′ linkers were ligated to the RNA‐fragment instead of 3′ linker followed by circularization 67. 5′ linkers contained four random nt unique molecular identifier (UMI) similar to a 5 nt UMI in 3′ linkers. During size selection, we restricted the footprint lengths to 18–34 nts. Matched RNA‐seq libraries were prepared using RNA that was randomly fragmentation by incubating for 15 min at 95°C with 1 mM EDTA, 6 mM Na2CO3, and 44 mM NaHCO3, pH 9.3. RNA‐seq fragments were restricted to 18–50 nts. Ribosomal rRNA was removed from pooled RNA‐seq and footprinting samples using RiboZero (Epicenter MRZH116). cDNA for the pooled library was PCR‐amplified for 15 cycles. RNA‐seq and footprinting reads were mapped to the human transcriptome using the riboviz pipeline 68. Complete TE analyses and pathway analyses are provided in Dataset EV1 and Table EV1, respectively.
Enteroid analyses
Crypt isolation and culture was performed as described previously 69. An equal number of crypts were plated in 24‐well plates at a density of 300 crypts per well in an 80/20 mixture of Matrigel Matrix (Corning) and complete media (containing 50 ng/ml mouse EGF (R&D Systems) and 2.5% Noggin/R‐spondin conditioned media 70. Enteroids were treated with 100 ng/ml Bafilomycin A for 12 h and harvested using western lysis buffer. Two independent enteroid lines from each of Imp1 WT and Imp1 ΔIEC mice were generated and used at passage 1. Imp1 knockout was confirmed by qPCR.
catRAPID analyses
We used the catRAPID fragment approach 71, 72 to predict IMP1 binding to autophagy‐related transcripts (i.e., MAP1LC3B, ATG3, BECN1, ATG5, ATG16L1, and ATG7). ACTB and TNFRSF1B/ITGA7 were also included as positive and negative controls, respectively. In our analysis, we included different isoforms for each transcript, for a total of 25 different targets, including the positive and negative controls (http://s.tartaglialab.com/page/catrapid_group).
Transcript score
Given a transcript isoform r i, we used catRAPID uniform fragmentation to generate j overlapping fragments that cover the entire sequence. The fragments r i,j are then used to compute catRAPID interacting propensities with IMP1 and IgG (negative control). We define the interaction threshold θ(r i) as the highest interaction propensity score that IgG has with the j fragments generated from sequence r i:
| (1) |
For every IMP1 interaction with fragments, we computed the normalized interaction π′ by subtracting the interaction threshold of the corresponding transcript to the catRAPID interaction score.
| (2) |
Fragments with normalized interaction score π′ > 0 are predicted to interact with IMP1. The Isoform Score of each isoform Πi is computed as the average normalized interaction score of interacting fragments π′ > 0 over the total number of fragments n(i):
| (3) |
We define the Transcript Score Πr (Fig 5A) as a global interaction propensity of all isoforms belonging to a certain transcript. The Transcript Score is defined as the average of the Isoform Scores for all the isoforms analyzed for each transcript:
| (4) |
Where N(r) is the number of isoforms considered for each transcript.
Ribonucleoprotein particle (RNP)‐immunoprecipitation
RNP‐immunoprecipitations (RIPs) were performed in Caco2 and SW480 cells using the RiboCluster Prolifer™ RIP‐Assay Kit (Medical & Biological Laboratories) according to manufacturer's instructions. Anti‐IMP1 (MBL RN007P, which targets 561–577aa) or control IgG (supplied in kit) was used. Quality control samples for total protein and RNA input as well as immunoprecipitated proteins were evaluated for each experiment. Isolated RNA was reverse‐transcribed using the Taqman RT Reagents kit and qPCR performed using the oligonucleotides listed in Table EV5. Raw C t values from IMP1‐ and IgG‐ immunoprecipitated samples were used to determine “percent input” for each target, followed by dividing IMP1‐immunoprecipitated signal by the respective IgG signal. Data for each individual target were then normalized to input and expressed as fold‐enrichment relative to negative control targets TNFRSF1B. Positive control was previously identified IMP1 target ACTB 9, 15. Three independent RIP experiments were performed. Cells with IMP1 deletion were used as negative control.
Statistical analyses
Applying unpaired, two‐tailed Student's t‐tests or one‐way ANOVA, with P < 0.05 as statistically significant, determined statistical significance of comparisons between control and experimental conditions unless otherwise noted in the figure legends. For weight analyses in DSS experiments, statistical significance is determined using the non‐parametric Mann–Whitney test. Cox regression was used to calculate statistical significance for Kaplan–Meier curves. For all analyses, unless noted otherwise, data from a minimum of three experiments are presented as mean ± standard error of mean (SEM). Sample sizes for individual experiments, including biological and technical replicates, are described in each figure legend, as well as number of experimental replicates.
Author contributions
Conceptualization: PC, KAW, KEH. Software and Formal Analyses: DSML, SL, HRSW, FCS, GGT, SM, PS. Investigation: PC, KAW, SFA, FCS, LAS, RM, ETL, SL, HRSW, SM, LC, PAW, LRP, VG, BJW, KEH. Writing‐Original Draft: PC, KEH. Writing‐ Review and Editing: PC, PAW, KAW, SFA, GGT, PS, GDW, KEH. Funding acquisition: KEH.
Conflict of interest
The authors declare that they have no conflict of interest.
Supporting information
Expanded View Figures PDF
Dataset EV1
Table EV1
Table EV2
Table EV3
Table EV4
Table EV5
Review Process File
Acknowledgements
We wish to thank Dr. Anil K. Rustgi (UPenn) and laboratory for support, discussions, and technical input. We thank UPenn Core Facilities: Molecular Pathology and Imaging, Human and Microbial Analytic Repository, Cell Culture/iPS, Flow Cytometry, and Electron Microscopy. We thank Dr. Donita Brady (UPenn) and laboratory for technical advice. We thank also Drs. T. Stappenbeck, A. Rodriguez, P. Vedula, L. Ghanem, and Y. Barash for discussions and advice. We thank Drs. Speigelman and Noubissi for Imp1‐floxed mice. Research reported in this publication was supported by the National Center for Advancing Translational Sciences of the National Institutes of Health under Award Number UL1TR001878. NIH K01DK100485 (KEH), Crohn's and Colitis Foundation Career Development Award (KEH), NIH R03DK114463 (KEH); Institute for Translational Medicine and Therapeutics of the Perelman School of Medicine at the University of Pennsylvania (KEH); NIH P30DK050306 and its pilot grant program (KEH); start‐up funds from the Children's Hospital of Philadelphia Research Institute (KEH); NIH T32CA115299‐09 (SFA); NIH R01DK056645 (PC, RM, SFA); NIH K08DK099379 (BJW); European Union Seventh Framework Programme (FP7/2007‐2013), through the European Research Council and RIBOMYLOME_309545 (GGT), the Spanish Ministry of Economy and Competitiveness (BFU2014‐55054‐P and fellowship to FCS), AGAUR (2014 SGR 00685), the Spanish Ministry of Economy and Competitiveness, Centro de Excelencia Severo Ochoa 2013–2017’ (SEV‐2012‐0208), NIH F32DK107052 (SFA), NIH K01DK103953 (KAW), NIH R03DK118304 (KAW), HHMI Medical Research Fellows Program (ETL), and Fonds de Recherche en Santé du Québec (P‐Giroux‐27692 and P‐Giroux‐31601), NIH R01GM103591 (GDW). NIH R35GM124976 (SL, HRSW, PS), NIGMS T32GM008216‐29 (SWF), start‐up funds from Human Genetics Institute of New Jersey and Rutgers University (SL, HRSW, PS).
EMBO Reports (2019) 20: e47074
References
- 1. Li N, Yousefi M, Nakauka‐Ddamba A, Li F, Vandivier L, Parada K, Woo DH, Wang S, Naqvi AS, Rao S et al (2015) The Msi family of RNA‐binding proteins function redundantly as intestinal oncoproteins. Cell Rep 13: 2440–2455 [DOI] [PMC free article] [PubMed] [Google Scholar]
- 2. Wang S, Li N, Yousefi M, Nakauka‐Ddamba A, Li F, Parada K, Rao S, Minuesa G, Katz Y, Gregory BD et al (2015) Transformation of the intestinal epithelium by the MSI2 RNA‐binding protein. Nat Commun 6: 6517 [DOI] [PMC free article] [PubMed] [Google Scholar]
- 3. Madison BB, Liu Q, Zhong X, Hahn CM, Lin N, Emmett MJ, Stanger BZ, Lee JS, Rustgi AK (2013) LIN28B promotes growth and tumorigenesis of the intestinal epithelium via Let‐7. Genes Dev 27: 2233–2245 [DOI] [PMC free article] [PubMed] [Google Scholar]
- 4. Madison BB, Jeganathan AN, Mizuno R, Winslow MM, Castells A, Cuatrecasas M, Rustgi AK (2015) Let‐7 represses carcinogenesis and a stem cell phenotype in the intestine via regulation of Hmga2. PLoS Genet 11: e1005408 [DOI] [PMC free article] [PubMed] [Google Scholar]
- 5. Tu HC, Schwitalla S, Qian Z, LaPier GS, Yermalovich A, Ku YC, Chen SC, Viswanathan SR, Zhu H, Nishihara R et al (2015) LIN28 cooperates with WNT signaling to drive invasive intestinal and colorectal adenocarcinoma in mice and humans. Genes Dev 29: 1074–1086 [DOI] [PMC free article] [PubMed] [Google Scholar]
- 6. Yousefi M, Li N, Nakauka‐Ddamba A, Wang S, Davidow K, Schoenberger J, Yu Z, Jensen ST, Kharas MG, Lengner CJ (2016) Msi RNA‐binding proteins control reserve intestinal stem cell quiescence. J Cell Biol 215: 401–413 [DOI] [PMC free article] [PubMed] [Google Scholar]
- 7. Parham LR, Williams PA, Chatterji P, Whelan KA, Hamilton KE (2018) RNA regulons are essential in intestinal homeostasis. Am J Physiol Gastrointest Liver Physiol 316: G197–G204 [DOI] [PMC free article] [PubMed] [Google Scholar]
- 8. Nielsen J, Christiansen J, Lykke‐Andersen J, Johnsen AH, Wewer UM, Nielsen FC (1999) A family of insulin‐like growth factor II mRNA‐binding proteins represses translation in late development. Mol Cell Biol 19: 1262–1270 [DOI] [PMC free article] [PubMed] [Google Scholar]
- 9. Ross AF, Oleynikov Y, Kislauskis EH, Taneja KL, Singer RH (1997) Characterization of a beta‐actin mRNA zipcode‐binding protein. Mol Cell Biol 17: 2158–2165 [DOI] [PMC free article] [PubMed] [Google Scholar]
- 10. Leeds P, Kren BT, Boylan JM, Betz NA, Steer CJ, Gruppuso PA, Ross J (1997) Developmental regulation of CRD‐BP, an RNA‐binding protein that stabilizes c‐myc mRNA in vitro . Oncogene 14: 1279–1286 [DOI] [PubMed] [Google Scholar]
- 11. Runge S, Nielsen FC, Nielsen J, Lykke‐Andersen J, Wewer UM, Christiansen J (2000) H19 RNA binds four molecules of insulin‐like growth factor II mRNA‐binding protein. J Biol Chem 275: 29562–29569 [DOI] [PubMed] [Google Scholar]
- 12. Lemm I, Ross J (2002) Regulation of c‐myc mRNA decay by translational pausing in a coding region instability determinant. Mol Cell Biol 22: 3959–3969 [DOI] [PMC free article] [PubMed] [Google Scholar]
- 13. Vikesaa J, Hansen TV, Jonson L, Borup R, Wewer UM, Christiansen J, Nielsen FC (2006) RNA‐binding IMPs promote cell adhesion and invadopodia formation. EMBO J 25: 1456–1468 [DOI] [PMC free article] [PubMed] [Google Scholar]
- 14. Noubissi FK, Goswami S, Sanek NA, Kawakami K, Minamoto T, Moser A, Grinblat Y, Spiegelman VS (2009) Wnt signaling stimulates transcriptional outcome of the Hedgehog pathway by stabilizing GLI1 mRNA. Cancer Res 69: 8572–8578 [DOI] [PMC free article] [PubMed] [Google Scholar]
- 15. Manieri NA, Drylewicz MR, Miyoshi H, Stappenbeck TS (2012) Igf2 bp1 is required for full induction of Ptgs2 mRNA in colonic mesenchymal stem cells in mice. Gastroenterology 143: 110–121.e10 [DOI] [PMC free article] [PubMed] [Google Scholar]
- 16. Huttelmaier S, Zenklusen D, Lederer M, Dictenberg J, Lorenz M, Meng X, Bassell GJ, Condeelis J, Singer RH (2005) Spatial regulation of beta‐actin translation by Src‐dependent phosphorylation of ZBP1. Nature 438: 512–515 [DOI] [PubMed] [Google Scholar]
- 17. Stohr N, Kohn M, Lederer M, Glass M, Reinke C, Singer RH, Huttelmaier S (2012) IGF2BP1 promotes cell migration by regulating MK5 and PTEN signaling. Genes Dev 26: 176–189 [DOI] [PMC free article] [PubMed] [Google Scholar]
- 18. Stohr N, Lederer M, Reinke C, Meyer S, Hatzfeld M, Singer RH, Huttelmaier S (2006) ZBP1 regulates mRNA stability during cellular stress. J Cell Biol 175: 527–534 [DOI] [PMC free article] [PubMed] [Google Scholar]
- 19. Noubissi FK, Elcheva I, Bhatia N, Shakoori A, Ougolkov A, Liu J, Minamoto T, Ross J, Fuchs SY, Spiegelman VS (2006) CRD‐BP mediates stabilization of betaTrCP1 and c‐myc mRNA in response to beta‐catenin signalling. Nature 441: 898–901 [DOI] [PubMed] [Google Scholar]
- 20. Elcheva I, Goswami S, Noubissi FK, Spiegelman VS (2009) CRD‐BP protects the coding region of betaTrCP1 mRNA from miR‐183‐mediated degradation. Mol Cell 35: 240–246 [DOI] [PMC free article] [PubMed] [Google Scholar]
- 21. Bernstein PL, Herrick DJ, Prokipcak RD, Ross J (1992) Control of c‐myc mRNA half‐life in vitro by a protein capable of binding to a coding region stability determinant. Genes Dev 6: 642–654 [DOI] [PubMed] [Google Scholar]
- 22. Weidensdorfer D, Stohr N, Baude A, Lederer M, Kohn M, Schierhorn A, Buchmeier S, Wahle E, Huttelmaier S (2009) Control of c‐myc mRNA stability by IGF2BP1‐associated cytoplasmic RNPs. RNA 15: 104–115 [DOI] [PMC free article] [PubMed] [Google Scholar]
- 23. Gu W, Wells AL, Pan F, Singer RH (2008) Feedback regulation between zipcode binding protein 1 and beta‐catenin mRNAs in breast cancer cells. Mol Cell Biol 28: 4963–4974 [DOI] [PMC free article] [PubMed] [Google Scholar]
- 24. Gu W, Katz Z, Wu B, Park HY, Li D, Lin S, Wells AL, Singer RH (2012) Regulation of local expression of cell adhesion and motility‐related mRNAs in breast cancer cells by IMP1/ZBP1. J Cell Sci 125: 81–91 [DOI] [PMC free article] [PubMed] [Google Scholar]
- 25. Hafner M, Landthaler M, Burger L, Khorshid M, Hausser J, Berninger P, Rothballer A, Ascano M Jr, Jungkamp AC, Munschauer M et al (2010) Transcriptome‐wide identification of RNA‐binding protein and microRNA target sites by PAR‐CLIP. Cell 141: 129–141 [DOI] [PMC free article] [PubMed] [Google Scholar]
- 26. Conway AE, Van Nostrand EL, Pratt GA, Aigner S, Wilbert ML, Sundararaman B, Freese P, Lambert NJ, Sathe S, Liang TY et al (2016) Enhanced CLIP uncovers IMP Protein‐RNA targets in human pluripotent stem cells important for cell adhesion and survival. Cell Rep 15: 666–679 [DOI] [PMC free article] [PubMed] [Google Scholar]
- 27. Huang H, Weng H, Sun W, Qin X, Shi H, Wu H, Zhao BS, Mesquita A, Liu C, Yuan CL et al (2018) Recognition of RNA N(6)‐methyladenosine by IGF2BP proteins enhances mRNA stability and translation. Nat Cell Biol 20: 285–295 [DOI] [PMC free article] [PubMed] [Google Scholar]
- 28. Hansen TV, Hammer NA, Nielsen J, Madsen M, Dalbaeck C, Wewer UM, Christiansen J, Nielsen FC (2004) Dwarfism and impaired gut development in insulin‐like growth factor II mRNA‐binding protein 1‐deficient mice. Mol Cell Biol 24: 4448–4464 [DOI] [PMC free article] [PubMed] [Google Scholar]
- 29. Fakhraldeen SA, Clark RJ, Roopra A, Chin EN, Huang W, Castorino J, Wisinski KB, Kim T, Spiegelman VS, Alexander CM (2015) Two isoforms of the RNA binding protein, coding region determinant‐binding protein (CRD‐BP/IGF2BP1), are expressed in breast epithelium, and support clonogenic growth of breast tumor Cells. J Biol Chem 290: 13386–13400 [DOI] [PMC free article] [PubMed] [Google Scholar]
- 30. Nishino J, Kim S, Zhu Y, Zhu H, Morrison SJ (2013) A network of heterochronic genes including Imp1 regulates temporal changes in stem cell properties. Elife 2: e00924 [DOI] [PMC free article] [PubMed] [Google Scholar]
- 31. Dimitriadis E, Trangas T, Milatos S, Foukas PG, Gioulbasanis I, Courtis N, Nielsen FC, Pandis N, Dafni U, Bardi G et al (2007) Expression of oncofetal RNA‐binding protein CRD‐BP/IMP1 predicts clinical outcome in colon cancer. Int J Cancer 121: 486–494 [DOI] [PubMed] [Google Scholar]
- 32. Hamilton KE, Noubissi FK, Katti PS, Hahn CM, Davey SR, Lundsmith ET, Klein‐Szanto AJ, Rhim AD, Spiegelman VS, Rustgi AK (2013) IMP1 promotes tumor growth, dissemination and a tumor‐initiating cell phenotype in colorectal cancer cell xenografts. Carcinogenesis 34: 2647–2654 [DOI] [PMC free article] [PubMed] [Google Scholar]
- 33. Hamilton KE, Chatterji P, Lundsmith ET, Andres SF, Giroux V, Hicks PD, Noubissi FK, Spiegelman VS, Rustgi AK (2015) Loss of stromal IMP1 promotes a tumorigenic microenvironment in the colon. Mol Cancer Res 13: 1478–1486 [DOI] [PMC free article] [PubMed] [Google Scholar]
- 34. Degrauwe N, Suva ML, Janiszewska M, Riggi N, Stamenkovic I (2016) IMPs: an RNA‐binding protein family that provides a link between stem cell maintenance in normal development and cancer. Genes Dev 30: 2459–2474 [DOI] [PMC free article] [PubMed] [Google Scholar]
- 35. Chatterji P, Hamilton KE, Liang S, Andres SF, Wijeratne HRS, Mizuno R, Simon LA, Hicks PD, Foley SW, Pitarresi JR et al (2018) The LIN28B‐IMP1 post‐transcriptional regulon has opposing effects on oncogenic signaling in the intestine. Genes Dev 32: 1020–1034 [DOI] [PMC free article] [PubMed] [Google Scholar]
- 36. Jonson L, Vikesaa J, Krogh A, Nielsen LK, Hansen T, Borup R, Johnsen AH, Christiansen J, Nielsen FC (2007) Molecular composition of IMP1 ribonucleoprotein granules. Mol Cell Proteomics 6: 798–811 [DOI] [PubMed] [Google Scholar]
- 37. Hubstenberger A, Courel M, Benard M, Souquere S, Ernoult‐Lange M, Chouaib R, Yi Z, Morlot JB, Munier A, Fradet M et al (2017) P‐body purification reveals the condensation of repressed mRNA regulons. Mol Cell 68: 144–157.e5 [DOI] [PubMed] [Google Scholar]
- 38. Haberman Y, Tickle TL, Dexheimer PJ, Kim MO, Tang D, Karns R, Baldassano RN, Noe JD, Rosh J, Markowitz J et al (2014) Pediatric Crohn disease patients exhibit specific ileal transcriptome and microbiome signature. J Clin Invest 124: 3617–3633 [DOI] [PMC free article] [PubMed] [Google Scholar]
- 39. Huber S, Gagliani N, Zenewicz LA, Huber FJ, Bosurgi L, Hu B, Hedl M, Zhang W, O'Connor W Jr, Murphy AJ et al (2012) IL‐22BP is regulated by the inflammasome and modulates tumorigenesis in the intestine. Nature 491: 259–263 [DOI] [PMC free article] [PubMed] [Google Scholar]
- 40. Zhong Y, Karaletsos T, Drewe P, Sreedharan VT, Kuo D, Singh K, Wendel HG, Ratsch G (2017) RiboDiff: detecting changes of mRNA translation efficiency from ribosome footprints. Bioinformatics 33: 139–141 [DOI] [PMC free article] [PubMed] [Google Scholar]
- 41. Chen J, Bardes EE, Aronow BJ, Jegga AG (2009) ToppGene Suite for gene list enrichment analysis and candidate gene prioritization. Nucleic Acids Res 37: W305–W311 [DOI] [PMC free article] [PubMed] [Google Scholar]
- 42. Cadwell K, Liu JY, Brown SL, Miyoshi H, Loh J, Lennerz JK, Kishi C, Kc W, Carrero JA, Hunt S et al (2008) A key role for autophagy and the autophagy gene Atg16 l1 in mouse and human intestinal Paneth cells. Nature 456: 259–263 [DOI] [PMC free article] [PubMed] [Google Scholar]
- 43. Cadwell K, Patel KK, Komatsu M, Virgin HW IV, Stappenbeck TS (2009) A common role for Atg16L1, Atg5 and Atg7 in small intestinal Paneth cells and Crohn disease. Autophagy 5: 250–252 [DOI] [PMC free article] [PubMed] [Google Scholar]
- 44. Saitoh T, Fujita N, Jang MH, Uematsu S, Yang BG, Satoh T, Omori H, Noda T, Yamamoto N, Komatsu M et al (2008) Loss of the autophagy protein Atg16L1 enhances endotoxin‐induced IL‐1beta production. Nature 456: 264–268 [DOI] [PubMed] [Google Scholar]
- 45. Pott J, Kabat AM, Maloy KJ (2018) Intestinal epithelial cell autophagy is required to protect against TNF‐induced apoptosis during chronic colitis in mice. Cell Host Microbe 23: 191–202.e4 [DOI] [PubMed] [Google Scholar]
- 46. Burger E, Araujo A, Lopez‐Yglesias A, Rajala MW, Geng L, Levine B, Hooper LV, Burstein E, Yarovinsky F (2018) Loss of Paneth cell autophagy causes acute susceptibility to Toxoplasma gondii‐mediated inflammation. Cell Host Microbe 23: 177–190.e4 [DOI] [PMC free article] [PubMed] [Google Scholar]
- 47. Matsuzawa‐Ishimoto Y, Shono Y, Gomez LE, Hubbard‐Lucey VM, Cammer M, Neil J, Dewan MZ, Lieberman SR, Lazrak A, Marinis JM et al (2017) Autophagy protein ATG16L1 prevents necroptosis in the intestinal epithelium. J Exp Med 214: 3687–3705 [DOI] [PMC free article] [PubMed] [Google Scholar]
- 48. VanDussen KL, Liu TC, Li D, Towfic F, Modiano N, Winter R, Haritunians T, Taylor KD, Dhall D, Targan SR et al (2014) Genetic variants synthesize to produce paneth cell phenotypes that define subtypes of Crohn's disease. Gastroenterology 146: 200–209 [DOI] [PMC free article] [PubMed] [Google Scholar]
- 49. Liu TC, Gurram B, Baldridge MT, Head R, Lam V, Luo C, Cao Y, Simpson P, Hayward M, Holtz ML et al (2016) Paneth cell defects in Crohn's disease patients promote dysbiosis. JCI Insight 1: e86907 [DOI] [PMC free article] [PubMed] [Google Scholar]
- 50. Liu TC, Gao F, McGovern DP, Stappenbeck TS (2014) Spatial and temporal stability of paneth cell phenotypes in Crohn's disease: implications for prognostic cellular biomarker development. Inflamm Bowel Dis 20: 646–651 [DOI] [PMC free article] [PubMed] [Google Scholar]
- 51. Liu TC, Naito T, Liu Z, VanDussen KL, Haritunians T, Li D, Endo K, Kawai Y, Nagasaki M, Kinouchi Y et al (2017) LRRK2 but not ATG16L1 is associated with Paneth cell defect in Japanese Crohn's disease patients. JCI Insight 2: e91917 [DOI] [PMC free article] [PubMed] [Google Scholar]
- 52. Stappenbeck TS, McGovern DPB (2017) Paneth cell alterations in the development and phenotype of Crohn's disease. Gastroenterology 152: 322–326 [DOI] [PMC free article] [PubMed] [Google Scholar]
- 53. Klionsky DJ, Abdelmohsen K, Abe A, Abedin MJ, Abeliovich H, Acevedo Arozena A, Adachi H, Adams CM, Adams PD, Adeli K et al (2016) Guidelines for the use and interpretation of assays for monitoring autophagy (3rd edition). Autophagy 12: 1–222 [DOI] [PMC free article] [PubMed] [Google Scholar]
- 54. Whelan KA, Merves JF, Giroux V, Tanaka K, Guo A, Chandramouleeswaran PM, Benitez AJ, Dods K, Que J, Masterson JC et al (2017) Autophagy mediates epithelial cytoprotection in eosinophilic oesophagitis. Gut 66: 1197–1207 [DOI] [PMC free article] [PubMed] [Google Scholar]
- 55. Whelan KA, Merves JF, Giroux V, Tanaka K, Guo A, Chandramouleeswaran PM, Benitez AJ, Dods K, Que J, Masterson JC et al (2016) Autophagy mediates epithelial cytoprotection in eosinophilic oesophagitis. Gut 66: 1197–1207 [DOI] [PMC free article] [PubMed] [Google Scholar]
- 56. Kijima T, Nakagawa H, Shimonosono M, Chandramouleeswaran PM, Hara T, Sahu V, Kasagi Y, Kikuchi O, Tanaka K, Giroux V et al (2019) Three‐dimensional organoids reveal therapy resistance of esophageal and oropharyngeal squamous cell carcinoma cells. Cell Mol Gastroenterol Hepatol 7: 73–91 [DOI] [PMC free article] [PubMed] [Google Scholar]
- 57. Ascano M, Hafner M, Cekan P, Gerstberger S, Tuschl T (2012) Identification of RNA‐protein interaction networks using PAR‐CLIP. Wiley Interdiscip Rev RNA 3: 159–177 [DOI] [PMC free article] [PubMed] [Google Scholar]
- 58. Cirillo D, Blanco M, Armaos A, Buness A, Avner P, Guttman M, Cerase A, Tartaglia GG (2016) Quantitative predictions of protein interactions with long noncoding RNAs. Nat Methods 14: 5–6 [DOI] [PubMed] [Google Scholar]
- 59. Komatsu M, Waguri S, Ueno T, Iwata J, Murata S, Tanida I, Ezaki J, Mizushima N, Ohsumi Y, Uchiyama Y et al (2005) Impairment of starvation‐induced and constitutive autophagy in Atg7‐deficient mice. J Cell Biol 169: 425–434 [DOI] [PMC free article] [PubMed] [Google Scholar]
- 60. Adolph TE, Tomczak MF, Niederreiter L, Ko HJ, Bock J, Martinez‐Naves E, Glickman JN, Tschurtschenthaler M, Hartwig J, Hosomi S et al (2013) Paneth cells as a site of origin for intestinal inflammation. Nature 503: 272–276 [DOI] [PMC free article] [PubMed] [Google Scholar]
- 61. Tsuboi K, Nishitani M, Takakura A, Imai Y, Komatsu M, Kawashima H (2015) Autophagy protects against colitis by the maintenance of normal gut microflora and secretion of mucus. J Biol Chem 290: 20511–20526 [DOI] [PMC free article] [PubMed] [Google Scholar]
- 62. Jin S, Zhang X, Miao Y, Liang P, Zhu K, She Y, Wu Y, Liu DA, Huang J, Ren J et al (2018) m6A RNA modification controls autophagy through upregulating ULK1 protein abundance. Cell Res 28: 955–957 [DOI] [PMC free article] [PubMed] [Google Scholar]
- 63. Bel S, Pendse M, Wang Y, Li Y, Ruhn KA, Hassell B, Leal T, Winter SE, Xavier RJ, Hooper LV (2017) Paneth cells secrete lysozyme via secretory autophagy during bacterial infection of the intestine. Science 357: 1047–1052 [DOI] [PMC free article] [PubMed] [Google Scholar]
- 64. Washington MK, Powell AE, Sullivan R, Sundberg JP, Wright N, Coffey RJ, Dove WF (2013) Pathology of rodent models of intestinal cancer: progress report and recommendations. Gastroenterology 144: 705–717 [DOI] [PMC free article] [PubMed] [Google Scholar]
- 65. Merves JF, Whelan KA, Benitez AJ, Muir AB, Furuta GT, Wang ML, Falk GW, Spergel JM, Nakagawa H (2016) ATG7 gene expression as a novel tissue biomarker in eosinophilic esophagitis. Am J Gastroenterol 111: 151–153 [DOI] [PMC free article] [PubMed] [Google Scholar]
- 66. McGlincy NJ, Ingolia NT (2017) Transcriptome‐wide measurement of translation by ribosome profiling. Methods 126: 112–129 [DOI] [PMC free article] [PubMed] [Google Scholar]
- 67. Subtelny AO, Eichhorn SW, Chen GR, Sive H, Bartel DP (2014) Poly(A)‐tail profiling reveals an embryonic switch in translational control. Nature 508: 66–71 [DOI] [PMC free article] [PubMed] [Google Scholar]
- 68. Carja O, Xing T, Wallace EWJ, Plotkin JB, Shah P (2017) riboviz: analysis and visualization of ribosome profiling datasets. BMC Bioinformatics 18: 461 [DOI] [PMC free article] [PubMed] [Google Scholar]
- 69. Hamilton KE, Crissey MA, Lynch JP, Rustgi AK (2015) Culturing adult stem cells from mouse small intestinal crypts. Cold Spring Harb Protoc 2015: 354–358 [DOI] [PubMed] [Google Scholar]
- 70. Sato T, Vries RG, Snippert HJ, van de Wetering M, Barker N, Stange DE, van Es JH, Abo A, Kujala P, Peters PJ et al (2009) Single Lgr5 stem cells build crypt‐villus structures in vitro without a mesenchymal niche. Nature 459: 262–265 [DOI] [PubMed] [Google Scholar]
- 71. Bellucci M, Agostini F, Masin M, Tartaglia GG (2011) Predicting protein associations with long noncoding RNAs. Nat Methods 8: 444–445 [DOI] [PubMed] [Google Scholar]
- 72. Cirillo D, Agostini F, Klus P, Marchese D, Rodriguez S, Bolognesi B, Tartaglia GG (2013) Neurodegenerative diseases: quantitative predictions of protein‐RNA interactions. RNA 19: 129–140 [DOI] [PMC free article] [PubMed] [Google Scholar]
Associated Data
This section collects any data citations, data availability statements, or supplementary materials included in this article.
Supplementary Materials
Expanded View Figures PDF
Dataset EV1
Table EV1
Table EV2
Table EV3
Table EV4
Table EV5
Review Process File


