
Fig 2.
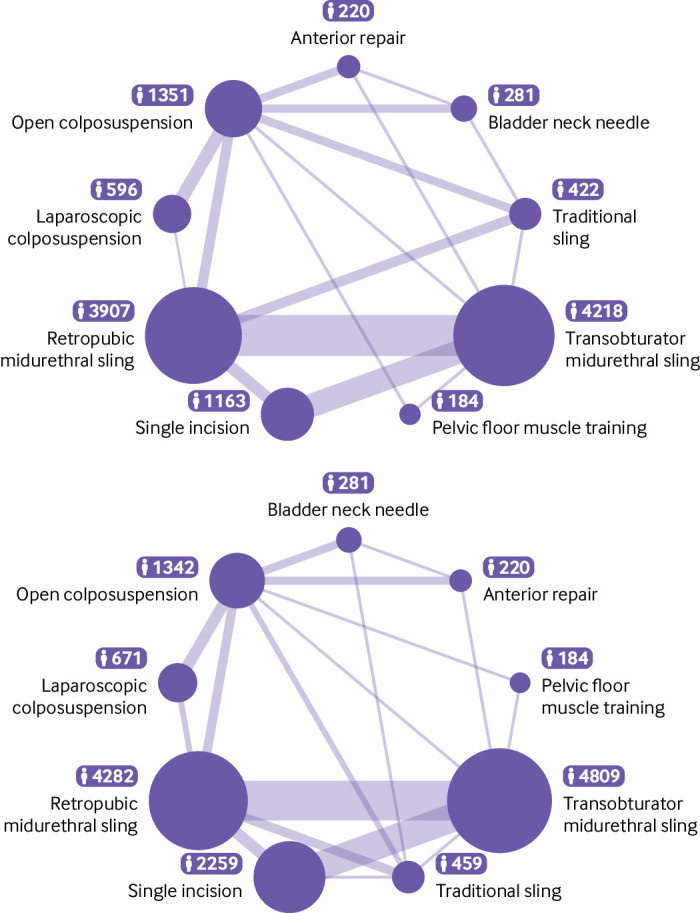
Network plot for number of women showing cure (top panel) and improvement (bottom panel) of stress urinary incontinence symptoms. Circle size reflects number of women and line width reflects number of direct comparisons
Official websites use .gov
A
.gov website belongs to an official
government organization in the United States.
Secure .gov websites use HTTPS
A lock (
) or https:// means you've safely
connected to the .gov website. Share sensitive
information only on official, secure websites.
Network plot for number of women showing cure (top panel) and improvement (bottom panel) of stress urinary incontinence symptoms. Circle size reflects number of women and line width reflects number of direct comparisons