Abstract
Background and objective: ITGA3 is a cell surface adhesion protein that interacts with extracellular matrix proteins which function in cancer metastasis. We examined the relationship of pancreatic ITGA3 expression with the clinical and pathological characteristics of patients with pancreatic cancer.
Methods: Data mining was used to analyze pancreatic cancer data from The Cancer Genome Atlas database. A Chi squared test was used to evaluate correlations of ITGA3 expression with clinical and pathological parameters. Receiver operating characteristic (ROC) analysis was used to evaluate the diagnostic performance of ITGA3 expression. Survival analysis and Cox regression analysis were used to examine the prognostic value of ITGA3 expression. Gene Set Enrichment Analysis (GSEA) was used to identify signaling pathways related to ITGA3 expression.
Results: Pancreatic expression of ITGA3 was greater in patients with pancreatic cancer than those without cancer, and was also associated with histological type, histological grade, stage, T classification, vital status, and relapse. ROC analysis indicated that ITGA3 had significant diagnostic value, in that high expression correlated with poor overall survival and relapse-free survival, especially in patients with early-stage cancer. Cox analysis indicated that high ITGA3 expression was an independent prognostic factor for pancreatic cancer. GSEA analysis identified 9 signaling pathways that were enriched in the presence of high ITGA3 expression.
Conclusion: Expression of ITGA3 can be used as a diagnostic and prognostic biomarker in pancreatic cancer.
Keywords: pancreatic cancer, diagnosis, prognosis, ITGA3, TCGA
Introduction
Pancreatic cancer is associated with a high mortality rate and poor prognosis, especially in patients with advanced-stage cancer. Although there have been improvements in the treatments for this cancer, such as surgery and neoadjuvant therapies, the overall survival rate has not improved. Many patients diagnosed with advanced-stage disease experience relapse and metastasis. Thus, the identification of new biomarkers for pancreatic cancer that provide detection of early-stage disease may allow earlier initiation of treatment and help to improve patient prognosis.
The ITGA3 gene encodes integrin alpha-3, a member of the integrin family of proteins. ITGA3 is located on the cell membrane and functions as a cell surface adhesion molecule. A previous study reported that ITGA3 interacts with extracellular matrix proteins, including members of the laminin family, and that its expression correlates with cancer metastasis.1 In addition, many omics studies have identified ITGA3 as a key molecular marker in several cancers,2,3 although its value in clinical settings is uncertain. In particular, little is known about the correlation of ITGA3 expression with the clinical and pathological parameters of pancreatic cancer.
The present study of pancreatic cancer patients measured the association of ITGA3 expression with clinical characteristics of patients, determined its diagnostic performance using survival curve analysis, and performed Cox regression analysis to evaluate its ability to predict overall survival and relapse-free survival.
Materials and methods
Data source
The expression of ITGA3 (from RNA-seq data) and the clinical data of patients with pancreatic cancer were extracted at The Cancer Genome Atlas-Pancreatic Adenocarcinoma (TCGA-PAAD) cohort (https://cancergenome.nih.gov/). Data processing and analyses were performed using R (version 3.5.1).4
Statistical analysis
Expression of ITGA3 mRNA is presented as box-plots using ggplot2 software.5 The Wilcoxon rank-sum test was used to determine the significance of differences. The chi-square test and Fisher’s exact test were used to evaluate the significance of the correlations of IGTA3 expression with clinical and pathological parameters. The diagnostic performance of ITGA3 was evaluated using receiver operating characteristic (ROC) analysis and calculation of the area under the curve (AUC) using the pROC package for R.6 In this analysis, patients were divided into two groups (high ITGA3 expression and low ITGA3 expression), and ROC curves were used to determine the best cutoff value based on survival.
Survival analysis was also used to examine the use of ITGA3 expression in prediction of overall survival and relapse-free survival using Survival package in R.7,8 Univariate and multivariate Cox analysis was used to determine the prognostic value of ITGA3 expression.
Gene set enrichment analysis (GSEA)
GSEA determines whether an a priori defined set of genes has statistically significant differences in expression under two different biological conditions.9,10 This analysis, performed using GSEA software 3.0 from the Broad Institute, was used for analysis of RNAseq data from TCGA-PAAD. The gene set of “h.all.v6.2.symbols.gmt”, which summarizes and represents specific, well-defined biological states or processes, was downloaded from the Molecular Signatures Database (http://software.broadinstitute.org/gsea/msigdb/index.jsp). The normalized enrichment score (NES) was determined by analysis of 1000 permutations. A gene set was considered significantly enriched when the p-value was less than 0.05 and the false discovery rate (FDR) was less than 0.25.
Results
Patient characteristics
We used data mining to analyze pancreatic expression of ITGA3 from the TCGA-PAAD cohort. Table 1 shows the clinical data of the patients, including age, sex, cancer stage, TNM classification, vital status, relapse, histologic grade, and histological type.
Table 1.
Patient characteristics of TCGA-PAAD cohort
| Characteristics | Numbers of cases (%) |
|---|---|
| Age | |
| <55 | 34(18.99) |
| ≥55 | 145(81.01) |
| Gender | |
| Female | 80(44.69) |
| Male | 99(55.31) |
| Alcohol history | |
| No | 65(36.31) |
| Yes | 102(56.98) |
| NA | 12(6.7) |
| Anatomic subdivision | |
| Body of pancreas | 14(7.82) |
| Head of pancreas | 139(77.65) |
| Other (please specify) | 11(6.15) |
| Tail of pancreas | 15(8.38) |
| Histological type | |
| Adenocarcinoma other subtype | 26(14.53) |
| Adenocarcinoma ductal type | 147(82.12) |
| Colloid carcinoma | 4(2.23) |
| Undifferentiated carcinoma | 1(0.56) |
| NA | 1(0.56) |
| Histologic grade | |
| G1 | 31(17.32) |
| G2 | 96(53.63) |
| G3 | 48(26.82) |
| G4 | 2(1.12) |
| GX | 2(1.12) |
| Stage | |
| I | 21(11.73) |
| II | 147(82.12) |
| III | 4(2.23) |
| IV | 5(2.79) |
| NA | 2(1.12) |
| T classification | |
| T1 | 7(3.91) |
| T2 | 24(13.41) |
| T3 | 143(79.89) |
| T4 | 3(1.68) |
| TX | 1(0.56) |
| NA | 1(0.56) |
| N classification | |
| N0 | 50(27.93) |
| N1 | 124(69.27) |
| NX | 4(2.23) |
| NA | 1(0.56) |
| M classification | |
| M0 | 80(44.69) |
| M1 | 5(2.79) |
| MX | 94(52.51) |
| Residual tumor | |
| R0 | 107(59.78) |
| R1 | 53(29.61) |
| R2 | 5(2.79) |
| RX | 4(2.23) |
| NA | 10(5.59) |
| Vital status | |
| Deceased | 93(51.96) |
| Living | 86(48.04) |
| Relapse | |
| Yes | 98(62.82) |
| No | 58(37.18) |
| ITGA3 | |
| High | 123(68.72) |
| Low | 56(31.28) |
Abbreviation: TCGA-PAAD, The Cancer Genome Atlas-Pancreatic Adenocarcinoma.
High expression of ITGA3 in pancreatic cancer
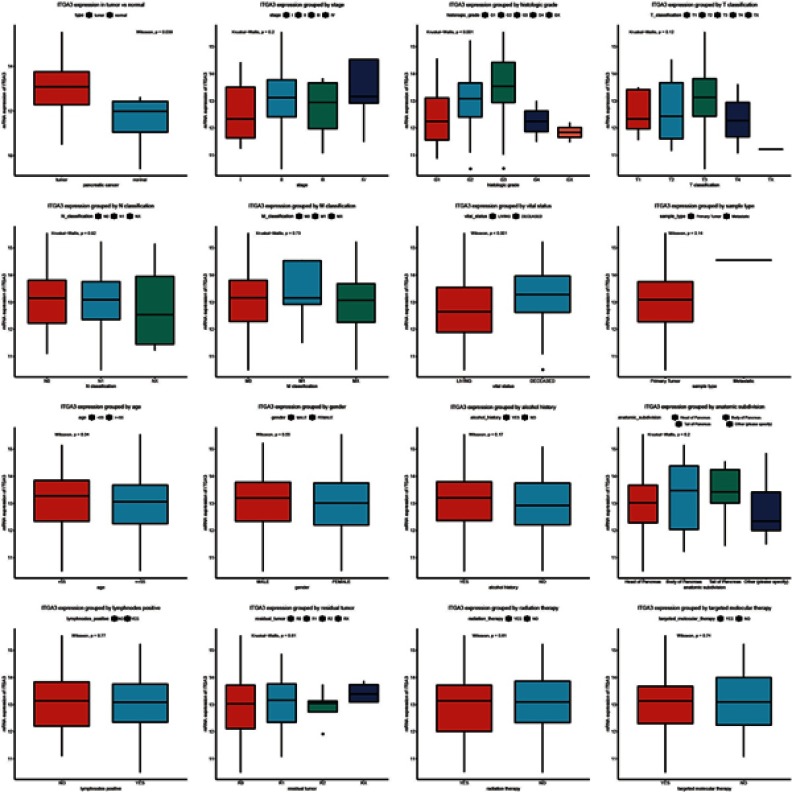
Analysis of pancreatic ITGA3 expression indicated greater levels in patients with pancreatic cancer than in those without this cancer (Figure 1). In addition, ITGA3 expression was greater in tumors with more advanced histologic grade and in deceased patients than living patients.
Figure 1.
Pancreatic expression of ITGA3 according to cancer histological type, stage, T classification, N classification, M classification, histologic grade, residual tumor, and vital status. Box plots show medians, first and third quartiles, and maxima and minima.
Diagnostic performance of ITGA3 expression
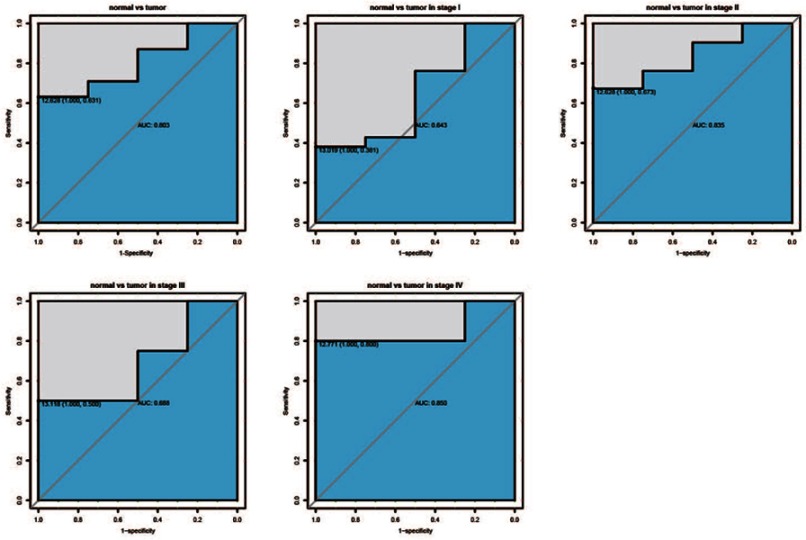
Comparison of cancerous and non-cancerous pancreatic tissues using ROC analysis indicated the AUC of ITGA3 expression was 0.803, indicating moderate diagnostic performance (Figure 2). In addition, subgroup analysis which compared non-cancerous tissues and tissues with different stages of cancer indicated that the AUC was 0.643 for stage I cancer, 0.835 for stage II cancer, 0.688 for stage III cancer, and 0.850 for stage IV cancer.
Figure 2.
ROC curves of pancreatic ITGA3 expression in the PAAD cohort. Comparison of non-tumor sample vs tumor sample; comparison of non-tumor sample vs tumor samples of stage I, II, III, and IV.
Correlation of ITGA3 expression with clinical and pathological parameters
We first divided patients into two groups (high and low expression of ITGA3), and then calculated ROC curves to identify the optimal cutoff value for pancreatic cancer (Table 2). The results indicated that high ITGA3 expression was positively associated with histological type (p=0.025), advanced histological grade (p<0.001), advanced stage (p=0.005), high T classification (p=0.005), mortality (p<0.001), and relapse (p=0.004).
Table 2.
Correlation between the clinicopathologic variables and ITGA3 mRNA expression in pancreatic cancer.
| Parameter | Variable | N | ITGA3 mRNA expression | χ2 | pvalue | |||
|---|---|---|---|---|---|---|---|---|
| High | % | Low | % | |||||
| Age | <55 | 34 | 24 | 19.51 | 10 | 17.86 | 0.003 | 0.955 |
| ≥55 | 145 | 99 | 80.49 | 46 | 82.14 | |||
| Gender | Female | 80 | 54 | 43.90 | 26 | 46.43 | 0.023 | 0.878 |
| Male | 99 | 69 | 56.10 | 30 | 53.57 | |||
| Alcohol history | No | 65 | 42 | 36.21 | 23 | 45.10 | 0.834 | 0.361 |
| Yes | 102 | 74 | 63.79 | 28 | 54.90 | |||
| Anatomic subdivision | Body of Pancreas | 14 | 10 | 8.13 | 4 | 7.14 | 3.713 | 0.309* |
| Head of Pancreas | 139 | 96 | 78.05 | 43 | 76.79 | |||
| Other | 11 | 5 | 4.07 | 6 | 10.71 | |||
| Tail of Pancreas | 15 | 12 | 9.76 | 3 | 5.36 | |||
| Histological type | Adenocarcinoma-Other Subtype | 26 | 13 | 10.66 | 13 | 23.21 | 9.351 | 0.025* |
| Adenocarcinoma Ductal Type | 147 | 107 | 87.70 | 40 | 71.43 | |||
| Colloid Carcinoma | 4 | 1 | 0.82 | 3 | 5.36 | |||
| Undifferentiated Carcinoma | 1 | 1 | 0.82 | 0 | 0.00 | |||
| Histologic grade | G1 | 31 | 12 | 9.76 | 19 | 33.93 | 24.376 | 0.000* |
| G2 | 96 | 69 | 56.10 | 27 | 48.21 | |||
| G3 | 48 | 41 | 33.33 | 7 | 12.50 | |||
| G4 | 2 | 1 | 0.81 | 1 | 1.79 | |||
| GX | 2 | 0 | 0.00 | 2 | 3.57 | |||
| Stage | I | 21 | 8 | 6.50 | 13 | 24.07 | 12.246 | 0.005* |
| II | 147 | 109 | 88.62 | 38 | 70.37 | |||
| III | 4 | 2 | 1.63 | 2 | 3.70 | |||
| IV | 5 | 4 | 3.25 | 1 | 1.85 | |||
| T classification | T1 | 7 | 3 | 2.44 | 4 | 7.27 | 12.587 | 0.005* |
| T2 | 24 | 12 | 9.76 | 12 | 21.82 | |||
| T3 | 143 | 107 | 86.99 | 36 | 65.45 | |||
| T4 | 3 | 1 | 0.81 | 2 | 3.64 | |||
| TX | 1 | 0 | 0.00 | 1 | 1.82 | |||
| N classification | N0 | 50 | 31 | 25.20 | 19 | 34.55 | 2.568 | 0.220* |
| N1 | 124 | 90 | 73.17 | 34 | 61.82 | |||
| NX | 4 | 2 | 1.63 | 2 | 3.64 | |||
| M classification | M0 | 80 | 55 | 44.72 | 25 | 44.64 | 0.314 | 0.855* |
| M1 | 5 | 4 | 3.25 | 1 | 1.79 | |||
| MX | 94 | 64 | 52.03 | 30 | 53.57 | |||
| Residual tumor | R0 | 107 | 66 | 58.41 | 41 | 73.21 | 4.749 | 0.215* |
| R1 | 53 | 39 | 34.51 | 14 | 25.00 | |||
| R2 | 5 | 4 | 3.54 | 1 | 1.79 | |||
| RX | 4 | 4 | 3.54 | 0 | 0.00 | |||
| Vital status | Deceased | 93 | 77 | 62.60 | 16 | 28.57 | 16.515 | 0.000 |
| Living | 86 | 46 | 37.40 | 40 | 71.43 | |||
| Relapse | No | 98 | 58 | 54.72 | 40 | 80.00 | 8.247 | 0.004 |
| Yes | 58 | 48 | 45.28 | 10 | 20.00 | |||
Notes: Bold represents p<0.05; *represents Fisher's exact test.
Prognostic performance of ITGA3 expression
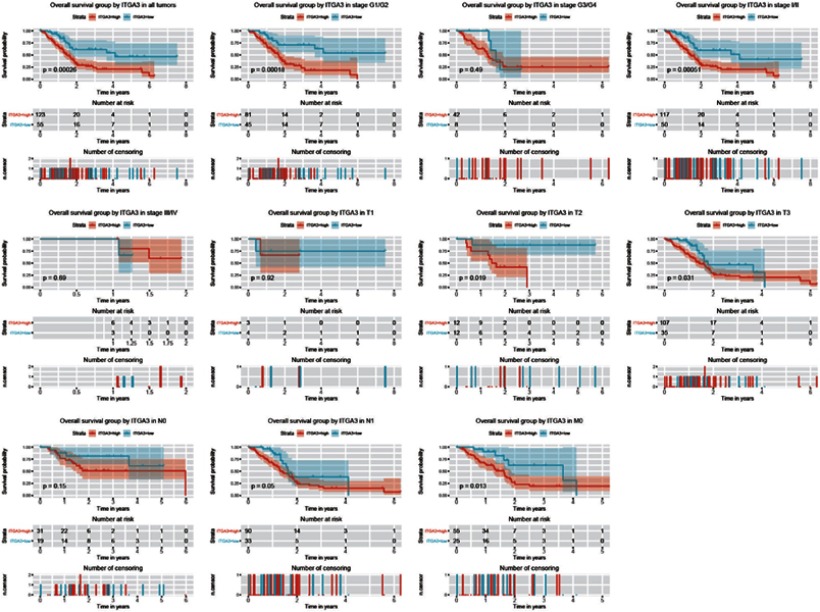
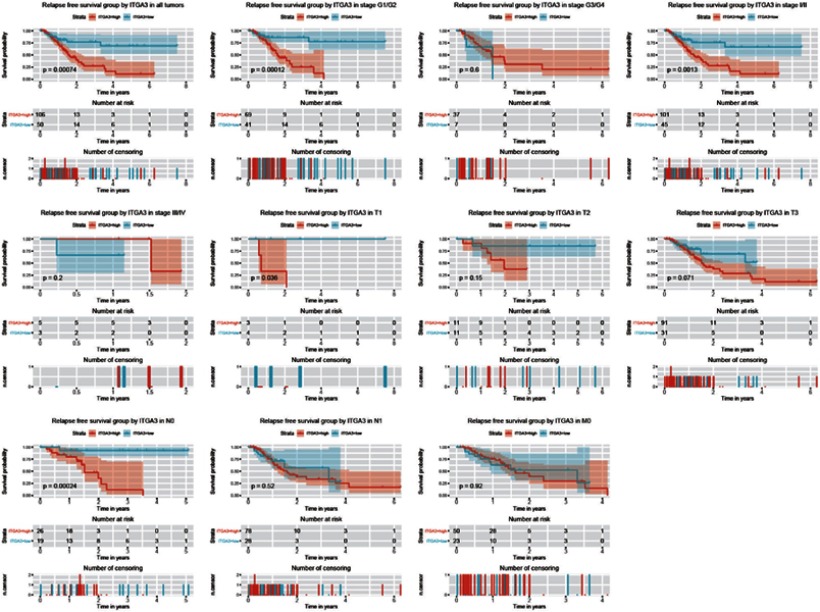
Survival analysis showed that patients with high ITGA3 expression had poorer overall survival (p=0.00026, Figure 3). In addition, expression of ITGA3 was significantly different in grade 1 (G1) and grade 2 (G2) tumors (p=0.00018), in patients with stage I/II and stage III/IV cancer (p=0.00051), in T2 (p=0.019) and T3 (p=0.031) tumors relative to T1 tumors, and in patients with M0 cancer (p=0.013). Further analysis indicated that high ITGA3 expression was associated with poor relapse-free survival (p=0.00074), especially in those with G1/G2 tumors (p=0.00012), stage I/II cancer (p=0.0013), stage T1 cancer (p=0.036), and stage N0 cancer (p=0.00024) (Figure 4).
Figure 3.
Relationship of pancreatic expression of ITGA3 with overall survival. Kaplan– Meier curves show overall survival following subgrouping according to clinical stage (I/II and III/IV), histological grade (G1/G2 and G3/G4), T classification (T1, T2, and T3), N classification (N0 and N1), and M classification (M0).
Figure 4.
Relationship of pancreatic ITGA3 expression with relapse-free survival. Kaplan– Meier curves show relapse-free survival following subgrouping for clinical stage (I/II and III/IV), histological grade (G1/G2 and G3/G4), T classification (T1, T2, and T3), N classification (N0 and N1), and M classification (M0).
We also performed univariate and multivariate Cox regression analysis to identify variables associated with survival (Tables 3 and 4). The multivariate analysis indicated that ITGA3 expression was a significant and independent prognostic factor for overall survival (HR =1.97, p=0.015) and relapse-free survival (HR =2.14, p=0.042).
Table 3.
Univariate and multivariate analysis of overall survival in patients with pancreatic cancer
| Parameters | Univariate analysis | Multivariate analysis | ||||
|---|---|---|---|---|---|---|
| Hazard ratio | 95% CI | p-value | Hazard ratio | 95% CI | p-value | |
| Age (≥55/<55) | 1.22 | 0.73-2.05 | 0.446 | |||
| Gender (male/female) | 0.81 | 0.54-1.22 | 0.320 | |||
| alcohol history (yes/no) | 1.09 | 0.79-1.5 | 0.604 | |||
| histological type (Undifferentiated/ Colloid/ Ductal Type/ Other Subtype) |
2.07 | 1.36-3.16 | 0.001 | 1.75 | 1.09-2.81 | 0.021 |
| Histologic grade (G4/G3/G2/G1) | 1.33 | 1.04-1.7 | 0.021 | 1.18 | 0.89-1.56 | 0.245 |
| Stage (IV/III/II/I) | 1.33 | 0.96-1.84 | 0.089 | |||
| T classification (T4/T3/T2/T1/NX) | 1.64 | 1.08-2.49 | 0.021 | 1.17 | 0.72-1.89 | 0.535 |
| N classification (N1/N0/NX) | 1.93 | 1.23-3.03 | 0.005 | 1.36 | 0.85-2.2 | 0.203 |
| M classification (M1/M0/MX) | 1.13 | 0.79-1.64 | 0.500 | |||
| Residual tumor (RX/R2/R1/R0) | 1.36 | 1.06-1.76 | 0.018 | 1.37 | 1.07-1.77 | 0.014 |
| ITGA3 (high/low) | 2.65 | 1.54-4.56 | 0.000 | 1.97 | 1.14-3.4 | 0.015 |
Note: Bold represents p<0.05.
Table 4.
Univariate and multivariate analysis of relapse-free survival in patients with pancreatic cancer
| Parameters | Univariate analysis | Multivariate analysis | ||||
|---|---|---|---|---|---|---|
| Hazard ratio | 95% CI | p-value | Hazard ratio | 95% CI | p-value | |
| Age (≥55/<55) | 0.93 | 0.51-1.71 | 0.827 | |||
| Gender (male/female) | 1.12 | 0.67-1.89 | 0.667 | |||
| Alcohol history (yes/no) | 1.22 | 0.79-1.87 | 0.364 | |||
| Histological type (Undifferentiated/ Colloid/ Ductal Type/ Other Subtype) |
1.09 | 0.65-1.84 | 0.733 | |||
| Histologic grade (G4/G3/G2/G1) | 1.56 | 1.13-2.17 | 0.007 | 1.39 | 0.96-2.01 | 0.083 |
| Stage (IV/III/II/I) | 1.41 | 0.98-2.04 | 0.064 | |||
| T classification (T4/T3/T2/T1/NX) | 1.51 | 0.94-2.41 | 0.088 | |||
| N classification (N1/N0/NX) | 2.03 | 1.17-3.52 | 0.012 | 1.53 | 0.87-2.7 | 0.143 |
| M classification (M1/M0/MX) | 1.42 | 0.92-2.21 | 0.116 | |||
| Residual tumor (RX/R2/R1/R0) | 1.73 | 1.23-2.42 | 0.002 | 1.66 | 1.2-2.29 | 0.002 |
| ITGA3 (high/low) | 3.12 | 1.56-6.24 | 0.001 | 2.14 | 1.03-4.43 | 0.042 |
Note: Bold represents p<0.05.
GSEA identifies ITGA3-related signaling pathway
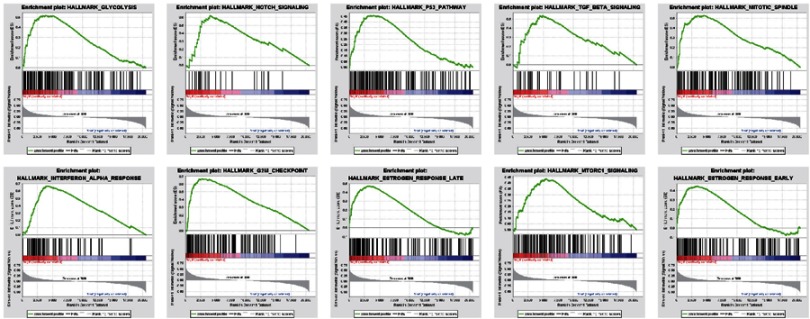
We compared the data sets for low and high ITGA3 expression using GSEA to identify signaling pathways activated during pancreatic cancer. The results indicated significant differences (FDR <0.25, NOM p-value <0.05) in the enrichment of the MSigDB collection (h.all.v6.2.symbols.gmt; Table 5). We selected the most significantly enriched signaling pathways, based on normalized enrichment score (NES) (Figure 5, Table 5). The results indicated the data set with high ITGA3 expression was enriched for glycolysis, notch signaling, P53 signaling, TGF-β signaling, the mitotic spindle, interferon alpha response, G2M checkpoint, estrogen response, and mTOR signaling.
Table 5.
Gene sets enriched in phenotype high.
| NAME | ES | NES | NOM p-val | FDR q-val |
|---|---|---|---|---|
| HALLMARK_GLYCOLYSIS | 0.52 | 1.96 | 0.00 | 0.08 |
| HALLMARK_NOTCH_SIGNALING | 0.63 | 1.86 | 0.00 | 0.10 |
| HALLMARK_MITOTIC_SPINDLE | 0.53 | 1.83 | 0.01 | 0.09 |
| HALLMARK_MTORC1_SIGNALING | 0.44 | 1.77 | 0.03 | 0.09 |
| HALLMARK_P53_PATHWAY | 0.46 | 1.77 | 0.01 | 0.08 |
| HALLMARK_TGF_BETA_SIGNALING | 0.54 | 1.77 | 0.01 | 0.06 |
| HALLMARK_G2M_CHECKPOINT | 0.67 | 1.74 | 0.02 | 0.07 |
| HALLMARK_INTERFERON_ALPHA_RESPONSE | 0.67 | 1.70 | 0.01 | 0.08 |
| HALLMARK_ESTROGEN_RESPONSE_LATE | 0.47 | 1.58 | 0.02 | 0.15 |
| HALLMARK_ESTROGEN_RESPONSE_EARLY | 0.45 | 1.52 | 0.03 | 0.19 |
Notes: Gene sets with NOM p<0.05 and FDR q<0.25 are considered significance.
Abbreviations: ES, enrichment score; NES, normalized enrichment score; NOM, nominal; FDR, false discovery rate.
Figure 5.
Gene set enrichment analysis (GSEA) of signaling pathways activated during pancreatic cancer. Comparison of data sets with low and high expression of ITGA3 indicated the high expression phenotype had enrichment of glycolysis, notch signaling, P53 signaling, TGF-β signaling, the mitotic spindle, interferon alpha response, G2M checkpoint, estrogen response, and mTOR signaling.
Discussion
Pancreatic cancer is one of the most deadly malignancies. The prognosis is poor because most patients are diagnosed with late-stage disease, when available treatments are less effective. Therefore, identification of novel prognostic and diagnostic biomarkers that can help to diagnose early-stage cancers may help to improve the outcomes of patients with pancreatic cancer. Our team previously identified diagnostic and prognostic biomarkers for several other cancers.11–13 In the present study, we found that high pancreatic expression of ITGA3 correlated with histological type, histological grade, cancer stage, T classification, vital status, and relapse. We also found that high ITGA3 expression was an independent prognostic factor for poor overall survival and relapse-free survival. Thus, ITGA3 expression appears to be a useful diagnostic and prognostic biomarker for pancreatic cancer.
Previous studies reported elevated expression of ITGA3 in many cancers, including gastric cancer,14 esophageal adenocarcinoma,15 non-small cell lung cancer,16 prostate cancer,17 thyroid carcinoma,18 head and neck cancer,19 tongue cancer,20 colorectal cancer,21 and bladder cancer.22 However, there is only limited evidence for increased expression of ITGA3 in pancreatic cancer.23 Our data mining analysis indicated elevated expression of ITGA3 in pancreatic cancer, suggesting that ITGA3 may be a potential biomarker or therapeutic target for pancreatic cancer. Although there was a previous report that ITGA3 has a role in pancreatic duct adenocarcinoma,23 we examined this issue in more detail by performing subgroup analysis. An interesting finding of our subgroup analysis is that ITGA3 expression gradually increased from histological G1 to G3, but was lower in G4. Therefore, ITGA3 might contribute to cancer onset and initial progression, so its measurement might help to detect patients with early-stage or rapidly progressing pancreatic cancer. Moreover, the higher expression of ITGA3 in deceased than living patients suggests it may also be useful as a prognostic indicator for pancreatic cancer.
A previous study found that ITGA3 may facilitate cancer development by activating the PI3K-Akt signaling pathway, which increases proliferation, migration, and invasion in many cancers.20 Our results also indicated that high pancreatic expression of ITGA3 was associated with the histological type, histological grade, stage, T classification, vital status, and relapse. ITGA3-activation of the PI3K-Akt signaling pathway may be the mechanism underlying these clinical correlations. We also used GSEA to analyze the potential ITGA3-related signaling pathways. The results indicated that ITGA3 influences glycolysis, notch signaling, P53 signaling, TGF-β signaling, the mitotic spindle, interferon alpha response, G2M checkpoint, estrogen response, and mTOR signaling. These findings require verification by future studies with different data sets.
Because of the important role of ITGA3 in multiple cancers, recent research has examined its potential as a prognostic marker. These studies found that ITGA3 was a useful prognostic marker for endometrioid endometrial cancer,24 head and neck cancer,19,25 tongue cancer,20 and bladder cancer.22 We found that ITGA3 expression was also a useful prognostic marker for overall survival and relapse-free survival in patients with pancreatic cancer, in accordance with previous work.23 Furthermore, our subgroup analysis indicated that ITGA3 expression was useful for distinguishing cancer G1 and G2 and stage I and II, suggesting its use as a prognostic indicator might be most effective for patients with mild or early pancreatic cancer.
Relapse and metastasis are the most serious problems in pancreatic and other cancers. The biology that underlies relapse and metastasis includes the epithelial-mesenchymal transition (EMT), cell migration, and invasion, and there is evidence that ITGA3 promotes these three processes in many cancers.1,26 In addition, previous studies verified the prognostic value of ITGA3 expression on relapse and metastasis in colorectal cancer,3,27 oral squamous cell carcinoma,28 lung cancer,2 breast cancer,2 prostate cancer17,26 and gastric cancer.29 We verified the prognostic potential of ITGA3 for relapse-free survival, especially in G1/G2 and stage I/II cancer, and that ITGA3 may be an independent prognostic biomarker for relapse and metastasis of early-stage pancreatic cancer.
We used data mining to examine the relationship of ITGA3 expression with pancreatic cancer. Together with previous research, the present study contributed to the identification of novel diagnostic and prognostic biomarkers for pancreatic cancer. However, the rather small sample size of our study is a limitation that must be considered. Thus, we plan to extend the current study by using a larger sample size and a different data set to assess the diagnostic and prognostic value of ITGA3 expression in pancreatic cancer, and to determine its potential use as a biomarker for pancreatic cancer.
Disclosure
The authors report no conflicts of interest in this work.
References
- 1.Kawataki T, Yamane T, Naganuma H, et al. Laminin isoforms and their integrin receptors in glioma cell migration and invasiveness: evidence for a role of alpha5-laminin(s) and alpha3beta1 integrin. Experimental Cell Research 2007;313(18):3819–3831. [DOI] [PubMed] [Google Scholar]
- 2.Hsu YC, Chen HY, Yuan S, et al. Genome-wide analysis of three-way interplay among gene expression, cancer cell invasion and anti-cancer compound sensitivity. BMC Med. 2013;11:106. doi: 10.1186/1741-7015-11-106 [DOI] [PMC free article] [PubMed] [Google Scholar]
- 3.Bauer KM, Watts TN, Buechler S, Hummon AB. Proteomic and functional investigation of the colon cancer relapse-associated genes NOX4 and ITGA3. J Proteome Res. 2014;13(11):4910–4918. doi: 10.1021/pr500557n [DOI] [PMC free article] [PubMed] [Google Scholar]
- 4.Team RDCJC. R: A Language and Environment for Statistical Computing. Vol. 14 Vienna, Austria: R Foundation for Statistical Computing; 2009:12–21. [Google Scholar]
- 5.Wickham H. Ggplot2:elegantgraphics for data analysis. J R Stat Soc. 2011;174(1):245–246. doi: 10.1111/j.1467-985X.2010.00676_9.x [DOI] [Google Scholar]
- 6.Robin X, Turck N, Hainard A, et al. pROC: an open-source package for R and S+ to analyze and compare ROC curves. BMC Bioinf. 2011;12:77. doi: 10.1186/1471-2105-12-77 [DOI] [PMC free article] [PubMed] [Google Scholar]
- 7.Therneau TM. A Package for Survival Analysis in S; April 1994. [Google Scholar]
- 8.Therneau TM, Grambsch PM. Modeling Survival Data: Extending the Cox Model. Vol. 97 New York: Springer; 2000. [Google Scholar]
- 9.Mootha VK, Lindgren CM, Eriksson KF, et al. PGC-1alpha-responsive genes involved in oxidative phosphorylation are coordinately downregulated in human diabetes. Nat Genet. 2003;34(3):267–273. doi: 10.1038/ng1180 [DOI] [PubMed] [Google Scholar]
- 10.Subramanian A, Tamayo P, Mootha VK, et al. Gene set enrichment analysis: a knowledge-based approach for interpreting genome-wide expression profiles. Proc Natl Acad Sci U S A. 2005;102(43):15545–15550. doi: 10.1073/pnas.0506580102 [DOI] [PMC free article] [PubMed] [Google Scholar]
- 11.Jiao Y, Fu Z, Li Y, Meng L, Liu Y. High EIF2B5 mRNA expression and its prognostic significance in liver cancer: a study based on the TCGA and GEO database. Cancer Manag Res. 2018;10:6003–6014. doi: 10.2147/CMAR.S185459 [DOI] [PMC free article] [PubMed] [Google Scholar]
- 12.Jiao Y, Li Y, Lu Z, Liu Y. High trophinin-associated protein expression is an independent predictor of poor survival in liver cancer. Dig Dis Sci. 2019;64(1):137–143. doi: 10.1007/s10620-018-5315-x [DOI] [PubMed] [Google Scholar]
- 13.Jiao Y, Fu Z, Li Y, Zhang W, Liu Y. Aberrant FAM64A mRNA expression is an independent predictor of poor survival in pancreatic cancer. PLoS One. 2019;14(1):e0211291. doi: 10.1371/journal.pone.0211291 [DOI] [PMC free article] [PubMed] [Google Scholar]
- 14.Varis A, Wolf M, Monni O, et al. Targets of gene amplification and overexpression at 17q in gastric cancer. Cancer Res. 2002;62(9):2625–2629. [PubMed] [Google Scholar]
- 15.Hourihan RN, O‘Sullivan GC, Morgan JG. Transcriptional gene expression profiles of oesophageal adenocarcinoma and normal oesophageal tissues. Anticancer Res. 2003;23(1A):161–165. [PubMed] [Google Scholar]
- 16.Boelens MC, van Den Berg A, Vogelzang I, et al. Differential expression and distribution of epithelial adhesion molecules in non-small cell lung cancer and normal bronchus. J Clin Pathol. 2007;60(6):608–614. doi: 10.1136/jcp.2005.031443 [DOI] [PMC free article] [PubMed] [Google Scholar]
- 17.Kurozumi A, Goto Y, Matsushita R, et al. Tumor-suppressive microRNA-223 inhibits cancer cell migration and invasion by targeting ITGA3/ITGB1 signaling in prostate cancer. Cancer Sci. 2016;107(1):84–94. doi: 10.1111/cas.12842 [DOI] [PMC free article] [PubMed] [Google Scholar]
- 18.Lu JC, Zhang YP. E2F, HSF2, and miR-26 in thyroid carcinoma: bioinformatic analysis of RNA-sequencing data. Genet Mol Res. 2016;15(1):15017576. [DOI] [PubMed] [Google Scholar]
- 19.Koshizuka K, Hanazawa T, Kikkawa N, et al. Regulation of ITGA3 by the anti-tumor miR-199 family inhibits cancer cell migration and invasion in head and neck cancer. Cancer Sci. 2017;108(8):1681–1692. doi: 10.1111/cas.13298 [DOI] [PMC free article] [PubMed] [Google Scholar]
- 20.Chen WL, Wang XK, Wu W. Identification of ITGA3 as an oncogene in human tongue cancer via integrated bioinformatics analysis. Curr med sci. 2018;38(4):714–720. [DOI] [PubMed] [Google Scholar]
- 21.Sa KD, Zhang X, Li XF, et al. A miR-124/ITGA3 axis contributes to colorectal cancer metastasis by regulating anoikis susceptibility. Biochem Biophys Res Commun. 2018;501(3):758–764. doi: 10.1016/j.bbrc.2018.05.062 [DOI] [PubMed] [Google Scholar]
- 22.Sakaguchi T, Yoshino H, Yonemori M, et al. Regulation of ITGA3 by the dual-stranded microRNA-199 family as a potential prognostic marker in bladder cancer. Br J Cancer. 2017;116(8):1077–1087. doi: 10.1038/bjc.2017.43 [DOI] [PMC free article] [PubMed] [Google Scholar]
- 23.Li J, Tan W, Peng L, et al. Integrative analysis of gene expression profiles reveals specific signaling pathways associated with pancreatic duct adenocarcinoma. Cancer Commun (Lond). 2018;38(1):13. doi: 10.1186/s40880-018-0289-9 [DOI] [PMC free article] [PubMed] [Google Scholar]
- 24.Bateman NW, Dubil EA, Wang G, et al. Race-specific molecular alterations correlate with differential outcomes for black and white endometrioid endometrial cancer patients. Cancer. 2017;123(20):4004–4012. doi: 10.1002/cncr.30813 [DOI] [PubMed] [Google Scholar]
- 25.Koshizuka K, Nohata N, Hanazawa T, et al. Deep sequencing-based microRNA expression signatures in head and neck squamous cell carcinoma: dual strands of pre-miR-150 as antitumor miRNAs. Oncotarget. 2017;8(18):30288–30304. doi: 10.18632/oncotarget.16327 [DOI] [PMC free article] [PubMed] [Google Scholar]
- 26.Bijnsdorp IV, Geldof AA, Lavaei M, Piersma SR, van Moorselaar RJA, Jimenez CR. Exosomal ITGA3 interferes with non-cancerous prostate cell functions and is increased in urine exosomes of metastatic prostate cancer patients. J Extracell Vesicles. 2013;2. doi: 10.3402/jev.v3402i3400.22097. [DOI] [PMC free article] [PubMed] [Google Scholar]
- 27.Linhares MM, Affonso RJ Jr., Viana Lde S, et al. Genetic and immunohistochemical expression of Integrins ITGAV, ITGA6, and ITGA3 as prognostic factor for colorectal cancer: models for global and disease-free survival. PLoS One. 2015;10(12):e0144333. doi: 10.1371/journal.pone.0144333 [DOI] [PMC free article] [PubMed] [Google Scholar]
- 28.Nagata M, Noman AA, Suzuki K, et al. ITGA3 and ITGB4 expression biomarkers estimate the risks of locoregional and hematogenous dissemination of oral squamous cell carcinoma. BMC Cancer. 2013;13:410. doi: 10.1186/1471-2407-13-410 [DOI] [PMC free article] [PubMed] [Google Scholar]
- 29.Scartozzi M, Loretelli C, Bearzi I, et al. Allele polymorphisms of tumor integrins correlate with peritoneal carcinosis capability of gastric cancer cells in radically resected patients. Ann Oncol. 2011;22(4):897–902. doi: 10.1093/annonc/mdq542 [DOI] [PubMed] [Google Scholar]


