

Abstract
The present study aimed to select anti‐tumor‐associated antigen (TAA) autoantibodies as biomarkers in the immunodiagnosis of gastric adenocarcinoma (GAC) by the recursive partitioning approach (RPA) and further construct and evaluate a predictive model. A case‐control study was designed including 407 GAC patients as the case group and 407 normal controls. In addition, 67 serial serum samples from 25 GAC patients were collected at different time points before and after gastrectomy treatment. Autoantibodies against 14 TAA were measured in sera from all subjects by enzyme immunoassay. Finally, RPA resulted in the selection of nine‐panel TAA (c‐Myc, p16, HSPD1, PTEN, p53, NPM1, ENO1, p62, HCC1.4) from all detected TAA in the case‐control study; the classification tree based on this nine‐TAA panel had area under curve (AUC) of 0.857, sensitivity of 71.5% and specificity of 71.3%; The optimal panel also can identify GAC patients at an early stage from normal individuals, with AUC of 0.737, sensitivity of 64.9% and specificity of 70.5%. However, frequencies of the nine autoantibodies showed no correlation with GAC stage, tumor size, lymphatic metastasis or differentiation. GAC patients positive for more than two autoantibodies in the nine‐TAA panel had a worse prognosis than that of the GAC patients positive for no or one antibody. Titers of 10 autoantibodies in serial serum samples were significantly higher in GAC patients after surgical resection than before. In conclusion, this study showed that the panel of nine multiple TAAs could enhance the detection of anti‐TAA antibodies in GAC, and may be potential prognostic biomarkers in GAC.
Keywords: autoantibody, biomarker, gastric adenocarcinoma, recursive partitioning approach, tumor‐associated antigen
1. INTRODUCTION
Gastric adenocarcinoma (GAC) is the main histopathological type of gastric cancer (GC). Gastric cancer is the main leading cause of cancer‐related death worldwide. In 2012, more than 950 000 new GC cases were reported and 723 000 deaths occurred.1 High mortality rates have been reported in East Asia, including China, Japan, and Korea.2, 3 This is mostly as a result of detection at an advanced stage. Less than 20% of cases are detected at a localized stage and the 5‐year survival rate of these cases is approximately 75%.4 Early detection of GC is hampered by a lack of specific symptoms before it has spread beyond the original site and the lack of reliable noninvasive screening tests.
Currently, the diagnosis of GC is based on endoscopic examination followed by histopathological examination, which is an invasive technique not applicable for the screening of the asymptomatic population. Hence, noninvasive tests for screening high‐risk groups, such as current biomarkers, are important to reduce the morbidity and mortality of GC. A variety of serum protein biomarkers has been used for GC diagnosis and prognosis in clinics (eg, carcinoembryonic antigen, carbohydrate antigen 19‐9 [CA19‐9], carbohydrate antigen 72‐4 [CA72‐4], and carbohydrate antigen 50 [CA50]). Presence of these biomarkers in serum is usually used as an indicator of cancer risk. However, generally, these serum biomarkers lack sufficient sensitivity and specificity to be implemented as a screening test for GAC.5, 6
Tumor‐associated antigens (TAAs) aberrantly expressed in GC and other cancers could activate the immune system to produce corresponding autoantibodies.7 Autoantibodies against TAAs are usually more stable and longer‐lasting than other potential markers, including TAAs themselves. TAA and anti‐TAA antibody systems have been extensively used as early cancer biomarkers to monitor therapeutic outcomes or predict cancer progression.8 Several studies have reported the diagnostic value of autoantibodies in gastric cancer.9, 10, 11 In 2015, Werner et al reviewed 39 articles reporting the detection of 34 different anti‐TAA autoantibodies and gave an overview of known autoantibodies and their diagnostic value in GC. The results showed that ELISA was the most common method and that anti‐p53 was the most frequently assessed autoantibody.12 However, except for a study from Zhou's group, few studies have explored the diagnostic value of autoantibodies in GAC. Zhou et al13 used the traditional statistical method to evaluate the diagnostic values of a panel of eight TAA (p53, Koc, p62, c‐Myc, IMP1, Survivin, p16 and CyclinB1) for early detection of patients with gastric cardia adenocarcinoma (GCA), and also reported that a combination of multiple autoantibodies to TAAs might be helpful in distinguishing GCA patients from normal individuals. Their study suggested that a larger sample size of GCA patients and a panel of multiple TAAs might improve the sensitivity and specificity in GCA detection. Our previous study created and evaluated a logistic regression model (a panel of six TAAs) to predict the risk of diagnosis with GC in a training cohort (n = 558) and in a validation cohort (n = 372).14 The predictive model showed good diagnostic performance of GC with AUC of 0.841 in the training cohort and 0.856 in the validation cohort.
On the basis of the previous study,14 we further explored the diagnostic value of 14 antibodies (p53, p62, c‐Myc, PTEN, ENO1, HSPD1, p16, HCC1.4, NPM1, 14‐3‐3zeta, MDM2, Cyclin B1, IMP1, and RalA) in GAC, and the association of these anti‐TAA and clinical characteristics, including tumor stage, tumor size, differentiation degree, and lymphatic metastasis. Recursive partitioning approach (RPA) was used to customize an optimal panel from 14 TAAs. In addition, the prognostic role of autoantibodies in GAC patients was also explored.
2. MATERIALS AND METHODS
2.1. Patients and serum samples
In the present study, a case‐control study was designed. The case group consisted of 407 sera from GAC patients with detailed clinical information and was from the First Affiliated Hospital of Zhengzhou University (January 2011 to Jun 2017). All patients were confirmed by histopathological examination. Sera from these patients were collected before treatment with surgery, chemotherapy, radiotherapy and other therapies. A total of 407 normal human sera (NHS) were matched to GAC patients by age and gender collected during an epidemiological survey of the general population during August 2013 to August 2015 in Henan, China.
In addition, a separate set of samples from the First Affiliated Hospital of Zhengzhou University consisted of 25 GAC patients with 67 serial serum samples collected at different time points before and after gastrectomy treatment, without other treatment. Detailed characteristics of the two cohorts are shown in Table 1. The current study was carried out in accordance with the ethical guidelines of the 2013 Declaration of Helsinki and was approved by the Institutional Review Board of Zhengzhou University. Informed consent forms were obtained from all subjects.
Table 1.
Characteristics of GAC patients and normal individuals in the current study
| Group | Case‐control study | P‐value | Serial serum samples from GAC patients (N = 25) | |
|---|---|---|---|---|
| GAC patients (N = 407) | Healthy controls (N = 407) | |||
| Age (y) | ||||
| Mean ± SD | 58.76 ± 11.88 | 58.78 ± 11.69 | 0.986a | 56.16 ± 10.66 |
| Range | 23‐89 | 23‐88 | 34‐77 | |
| ≤60 | 210 (51.6) | 209 (51.4) | 0.944b | 17 (68.0%) |
| >60 | 197 (48.4) | 198 (48.6) | 8 (32.0%) | |
| Gender, n (%) | ||||
| Male | 307 (75.4) | 308 (75.7) | 0.935b | 8 (32.0%) |
| Female | 100 (24.6) | 99 (24.3) | 17 (68.0%) | |
| Family history of tumor | ||||
| No | 322 (79.1) | 308 (75.7) | 0.003b | 5 (20.0%) |
| Yes | 77 (18.9) | 40 (9.8) | 20 (80.0%) | |
| Unknown | 8 (2.0) | 59 (14.5) | 0 (0.0%) | |
| TNM stage, n (%) | ||||
| Stage I | 67 (16.5) | 2 (8.0%) | ||
| Stage II | 87 (21.4) | 6 (24.0%) | ||
| Stage III | 142 (34.9) | 14 (56.0%) | ||
| Stage IV | 40 (9.8) | 2 (8.0%) | ||
| Unknown | 71 (17.4) | 1 (4.0%) | ||
| Differentiation | ||||
| Poor | 168 (41.3) | 18 (72.0%) | ||
| Moderate | 173 (42.5) | 5 (20.0%) | ||
| High | 6 (1.5) | 0 (0.0%) | ||
| Unknown | 60 (14.7) | 2 (8.0%) | ||
| Tumor size, n (%) | ||||
| <5 cm | 152 (37.3) | 20 (80.0%) | ||
| ≥5 cm | 83 (20.4) | 4 (16.0%) | ||
| Unknown | 172 (42.3) | 1 (4.0%) | ||
| Lymph node metastasis, n (%) | ||||
| No | 112 (27.5) | 4 (16.0%) | ||
| Yes | 181 (44.5) | 20 (80.0%) | ||
| 1‐3 | 73 (17.9) | 10 (40.0%) | ||
| 4‐9 | 62 (15.2) | 5 (20.0%) | ||
| ≥10 | 46 (11.3) | 5 (20.0%) | ||
| Unknown | 114 (28.0) | 1 (4.0%) | ||
Wilcoxon matched‐pairs signed rank test.
Chi‐squared test.
GAC, gastric adenocarcinoma.
2.2. Detection of 14 anti‐TAA autoantibodies by ELISA
All of the recombinant TAA proteins in the present study, including p53, p62/IMP2, c‐Myc, PTEN, ENO1, HSPD1, p16, HCC1.4, NPM1, 14‐3‐3zeta, MDM2, Cyclin B1, IMP1, and RalA, were expressed and purified through the prokaryotic expression system in our laboratory.
All sera were collected and stored at −80°C. Autoantibodies against 14 TAAs were detected in serum samples by ELISA, which was described in detail in our previous study.14 In brief, purified proteins were coated onto 96‐well microliter plates at a concentration of 0.5 μg/mL and 100 μL/well. Sera at 1:200 dilution were used as first antibody and HRP‐rec‐Protein A (REF:101123; Camarillo, CA, USA) at 1:3000 dilution was used as secondary antibody. 3,3,5,5‐Tetramethylbenzidine (TMB)‐H2O2‐urea was used as detecting reagent. Optical density (OD) value of each well was read at 450 and 620 nm by a microplate reader (Thermo Fisher Scientific, Waltham, MA, USA). Three controls were set in each plate.
2.3. Statistical analysis
All statistical analyses were carried out using Prism software (version 7.0; GraphPad) and SPSS (version 20.0). Shapiro‐Wilk and Kolmogorov‐Smirnov tests were used to detect normal distribution of data. Wilcoxon matched‐pairs signed rank test was used to analyze difference in age and autoantibody levels between case and control group in the case‐control study as a result of abnormal distribution of the data, and chi‐squared test was used to compare the frequency of autoantibodies in the case group compared with the control group. Receiver operating characteristic (ROC) curves were generated by MedCalc (Version 11.4.2.0). Areas under curves (AUC), sensitivity, and specificity were used to evaluate the diagnostic performance of all anti‐TAA antibodies. All statistical tests are two‐tailed. P < .05 was considered as significant difference and vice versa in all statistical analyses.
Recursive partitioning approach was used in the current study to select optimal TAA for GAC detection. RPA is a multivariate and nonparametric statistical methodology,15, 16 the algorithm of which is simple and intuitive. In brief, the recursive partitioning program determines every variable's cutoff point (the titer of each of the 14 antibodies), which optimally splits all subjects into cancer and normal and, finally, selects the variable that performs best. Then, it repeats the process on every variable until no additional partitioning is warranted.17 RPART software package which was implemented in R (version 3.4.3; Mathsoft)18 was used to generate the decision trees depicting the classification rules generated through recursive partitioning. To correct overtraining, the trees were pruned using the 1 SE rule described by Breiman.19
The original levels of 14 anti‐TAA antibodies in 407 GAC sera and 407 NHS were analyzed in the RPART program based on the RPA. In addition, considering that the choice of cutoffs could affect the diagnostic values of anti‐TAA antibodies, we planned to set five common decision rules (cutoff values). If the OD value of an anti‐TAA antibody exceeded the cutoff value, an individual was considered positive for this antibody. The five cutoff values are as follows: (i) mean plus one SD of the normal OD values (mean + 1SD); (ii) mean plus two SD of the normal OD values (mean + 2SD); (iii) mean plus three SD of the normal OD values (mean + 3SD); (iv) the cutoff is chosen when the Youden index reached the highest while specificity is >90%; and (v) the cutoff is chosen while Youden's index is the highest. Data of dichotomous variables were then analyzed using RPA. In addition, the overall survival curves of the patients positive for autoantibodies in the panel of nine anti‐TAA were generated by SPSS 21.0
3. RESULTS
3.1. Characteristics of study subjects
In total, 407 GAC patients and 407 normal controls were included in the case‐control study. In addition, 25 GAC patients who had received gastrectomy treatment only were included and followed up for approximately 10 months to observe the titers of anti‐TAA autoantibodies after tumor resection. Detailed characteristics of all subjects are shown in Table 1. There were no significant differences of age and gender between the case group and the control group (P > .05), but the GAC group showed a higher frequency of family cancer history compared with that in the control group (P < .05).
3.2. Performance of single autoantibody to each of 14 TAAs in the diagnosis of GAC
The 14 recombinant TAA proteins (p53, p62/IMP2, c‐Myc, PTEN, ENO1, HSPD1, p16, HCC1.4, NPM1, 14‐3‐3zeta, MDM2, CyclinB1, IMP1, and RalA) were used as antigens to detect the corresponding autoantibody in 407 GAC sera and 407 normal human sera by ELISA. Figure 1 shows that it was obvious that antibodies to certain TAA proved useful for distinguishing GAC from NHS. All anti‐TAA autoantibodies showed higher titers in GAC cases compared to controls except anti‐RalA and anti‐IMP1 antibodies.
Figure 1.
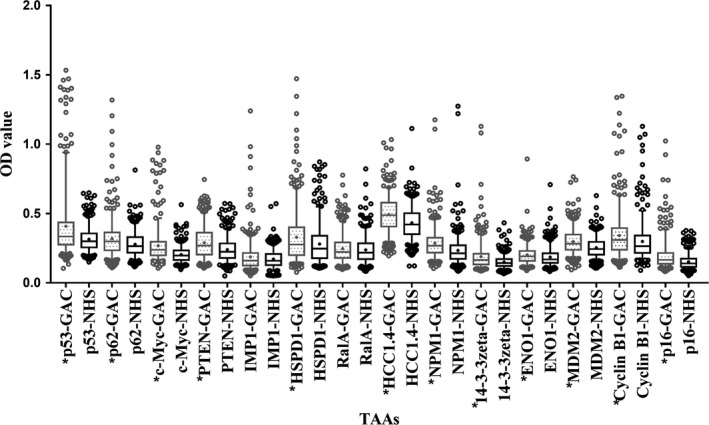
Levels (optical density, OD) of antibodies to 14 tumor‐associated antigens (TAAs) in the gastric adenocarcinoma (GAC) and normal human sera (NHS) groups. Line and “+” within a box mark the median and mean, respectively. Whiskers mark 5‐95 percentiles. NHS (N = 407); GAC (N = 407). *P < .0036 (Wilcoxon matched‐pairs signed rank test) showed that the average OD value was significantly higher in GAC sera than in NHS
Receiver operating characteristic curves were generated to evaluate the diagnostic value of a single anti‐TAA antibody in GAC. Detailed information is shown in Figure 2. Anti‐c‐Myc antibody showed the highest AUC of 0.702 with sensitivity of 33.17% and specificity of 90.17%. AUC of the top 13 anti‐TAA (p53, p62/IMP2, c‐Myc, PTEN, ENO1, HSPD1, p16, HCC1.4, NPM1, 14‐3‐3zeta, MDM2, CyclinB1, RalA) ranged from 0.702 to 0.564 (P < .05). However, anti‐IMP1 antibodies showed low AUC of 0.507 (P > .05). The results showed that a single antibody with a sensitivity of 33.17% could not be used in the diagnosis of GAC. Studies showed that the combination of multiple TAAs can improve the diagnostic performance of cancer.20, 21, 22 However, it is problematic to customize a panel of TAAs. RPA was used to find optimal subsets of the 14 antigen‐antibody panel to distinguish cancer patients from normal individuals.
Figure 2.
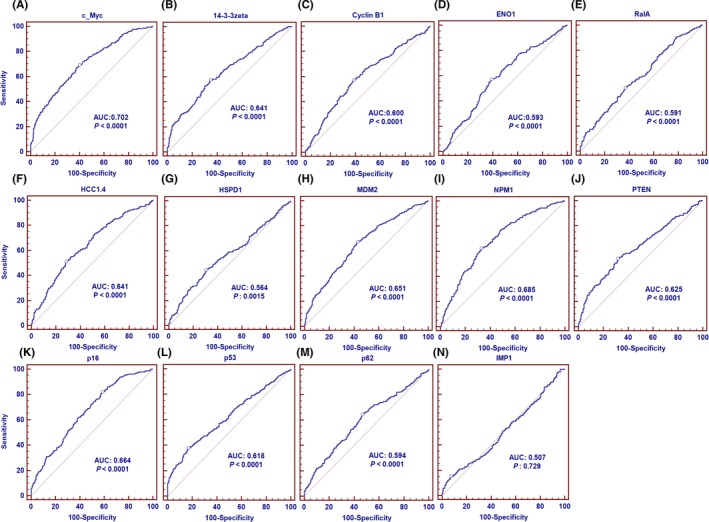
Receiver operating characteristic curves of a single antibody against 14 tumor‐associated antigens in gastric adenocarcinoma patients and normal human sera. AUC, area under the curve
3.3. Classification trees
Classification trees are shown in Figure 3. In the tree of the original OD value, the positive branch of the first node (antibody to c‐Myc) detected 162 normal controls and 281 GAC patients (Figure 3A). The remaining subsets to the left of the node (245 normal controls and 126 cases) were additionally partitioned for antibody to p16, which detected 163 normal controls and 112 cases in the positive branch. Then, the negative normal and GAC patients to the right side of the node (antibody to p16) were again partitioned for antibody to HSPD1. In the terminal leaves, 17 patients were positive for anti‐HCC1. Four and 16 cases were positive for anti‐c‐Myc. Following the above principle, the tree has a total of 11 nodes and nine antibodies to c‐Myc, p16, HSPD1, PTEN, p53, NPM1, ENO1, p62/IMP2, and HCC1.4. In this tree, 206 of 407 controls were correctly classified as normal and, similarly, 260 of 407 GAC patients were correctly classified as GAC. The trees for other cutoff values in Figure 3B‐F follow the same principle as that described for GAC (Figure 3A).
Figure 3.
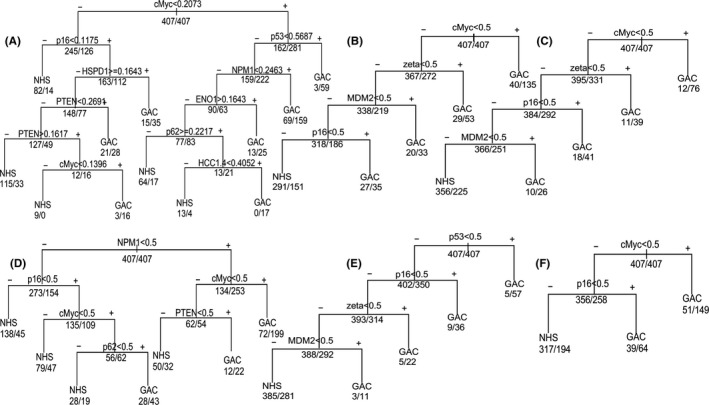
Classification trees for gastric adenocarcinoma (GAC) on the basis of recursive partitioning analysis. A, Original optical density (OD). B, The cutoff is chosen when the Youden index is the highest, while specificity is >90%. C, Cutoff: Mean + 2SD of normal OD values. D, The cutoff is chosen while Youden's index is the highest. E, Cutoff: mean + 3SD of normal OD values. F, Cutoff: mean + 1SD of normal OD values. In each tree, the decision point is labeled with a tumor‐associated antigen (TAA), and the numbers below each node represent the number of normal individuals (initially 407) and the number of GAC patients (initially 407). NHS, normal human sera
The trees associated with five cutoff standards were consistent and had the same node (anti‐p16 antibody). c‐Myc also appeared in five of six trees and is the first determinant in four trees. Interestingly, Figure 3B,C shows that trees consist of four antibodies to the same antigens (c‐Myc, MDM2, p16, 14‐3‐3zeta). In addition, antibodies to MDM2, p16 and 14‐3‐3zeta also appear in Figure 3E. Figure 4 shows the ROC of these six trees. The AUC of the original OD tree was 0.857 (P < .05), the highest among six trees (Figure 4A). Also, the AUCs vary as the cutoffs vary. The AUC of the mean + 2SD tree was 0.667, more than that of the mean + 1SD tree and the mean + 3SD tree. Also, the AUCs of the mean plus SD trees (Figure 4D‐F) were less than those of the other two trees (Figure 4B,C), which were 0.717 and 0.690, respectively.
Figure 4.
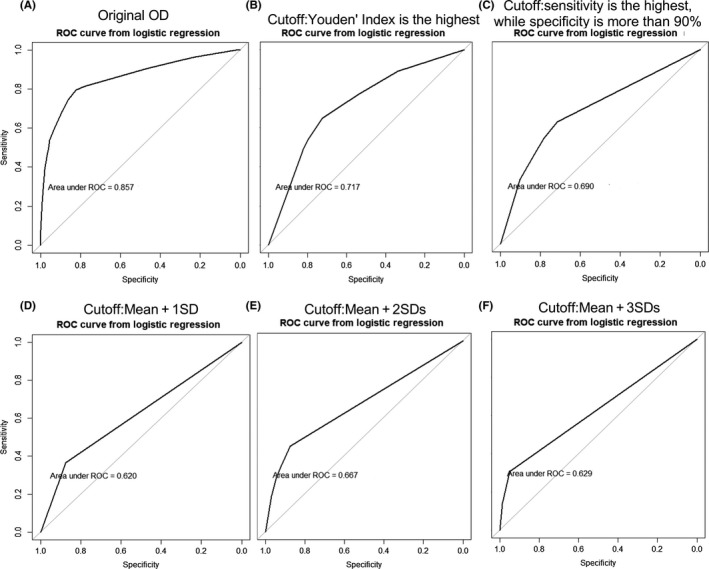
Receiver operating characteristic (ROC) curves of the six trees in the diagnosis of gastric adenocarcinoma based on logistic regression of the corresponding panel. AUC, area under the curve
3.4. Association of antibodies to nine TAA with clinical characteristics of GAC
The first participation tree showed the highest performance in the diagnosis of GAC among the six trees, which consisted of anti‐TAA antibodies against c‐Myc, p16, HSPD1, PTEN, p53, NPM1, ENO1, p62/IMP2, and HCC1.4. Next, this panel was evaluated to distinguish GAC from controls. In addition, we explored the association of the antibody titers with the clinical characteristics of GAC, including tumor stage, differentiation, tumor size and lymphatic metastasis.
The cutoff value was chosen while the Youden index was the largest, and the specificity was more than 90% to ensure high specificity and AUC in GAC. The results showed a statistically significant increase trend in the frequency of positive reactivity of these nine autoantibodies in GAC patients compared to normal controls (Figure 5A). In addition, 71.7% of all GAC patients showed positive reactivity to one or more of these nine TAAs (c‐Myc, p16, HSPD1, PTEN, p53, NPM1, ENO1, p62/IMP2, and HCC1.4) compared to 28.7% in normal controls (P < .05) (Figure 5A). We further assessed whether the clinical characteristics of tumor stage, differentiation, tumor size and lymph node metastasis affected the expression of autoantibodies to nine TAAs in GAC patients (Figure 6). When GAC patients were confined to the early‐stage (stage I‐II) subsets and late‐stage (stage III‐IV) subsets, AUC of antibodies were 0.737 in the early‐stage subsets, with sensitivity of 64.9% and specificity of 70.5%, and 0.771 in the late‐stage subsets, with sensitivity of 67.0% and specificity of 72.5% (Figure 6A). AUC of other subsets were similar to that of the tumor stage, ranging from 0.737 to 0.803, in the subsets of lymphatic metastasis versus without lymphatic metastasis (Figure 6B), poor differentiation versus moderate and high differentiation (Figure 6C), and tumor size ≥5 cm versus tumor size <5 cm (Figure 6D). In addition, chi‐squared tests were used to compare the positive rates of nine anti‐TAA antibodies in subgroups of clinical characteristics. The results showed no significant differences of antibodies against these nine TAA among the subgroups of stage (Figure 6E), lymph node metastasis (Figure 6F), differentiation (Figure 6G), or tumor size (Figure 6H).
Figure 5.
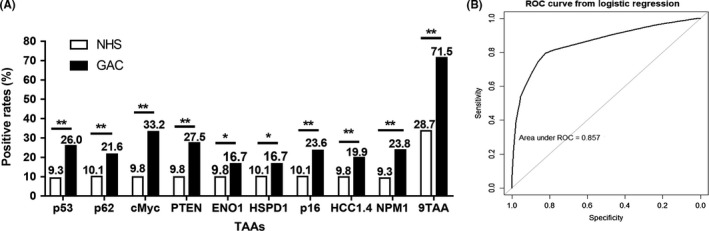
Positive rates of nine antibodies in gastric adenocarcinoma (GAC) patients and normal human sera (NHS). A, The cutoff is chosen when the sensitivity is the highest, while specificity is >90%. Chi‐squared test was used to compare the frequency between case and control groups. B, Receiver operating characteristic (ROC) curve of the panel of nine tumor‐associated antigens (TAA) in the diagnosis of GAC based on logistic regression. *P < .05; **P < .01.
Figure 6.
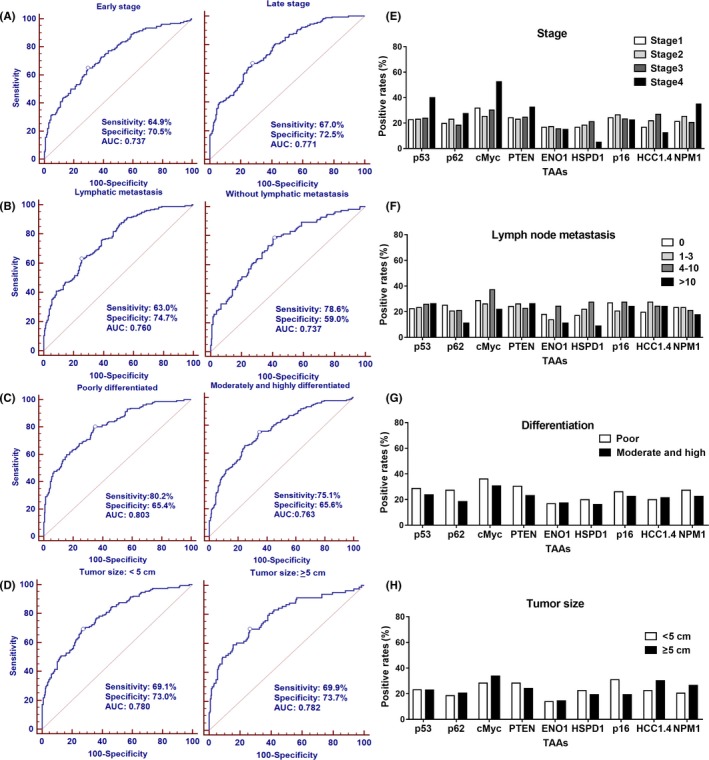
Diagnostic performances of antibodies to nine tumor‐associated antigens (TAAs) in the subgroups of gastric adenocarcinoma (GAC) patients based on tumor stage, differentiation, tumor size and lymphatic metastasis. A–D, the ROCs of autoantibodies in subgroups of GAC compared to NHS. E–H, the positive rates of autoantibodies in subgroups of GAC. Chi‐squared tests showed no difference between the subgroups among the 14 antibodies. AUC, area under the curve
3.5. Prognostic performance of antibodies against nine TAA in patients with GAC
We followed up the 407 GAC patients for 36 months and obtained their outcomes (death from GAC or survival). All GAC patients were divided into autoantibody‐positive and ‐negative groups based on nine antibodies, and survival rates of these two groups were evaluated and showed no differences (Figure 7A). All GAC patients were also divided into patients with two or more positive autoantibodies and patients with one positive autoantibody or all negative autoantibodies based on nine antibodies and survival rates were also evaluated. The results showed that GAC patients positive for two or more autoantibodies had a worse prognosis than that of the group with patients positive for no or one antibody (Figure 7B).
Figure 7.
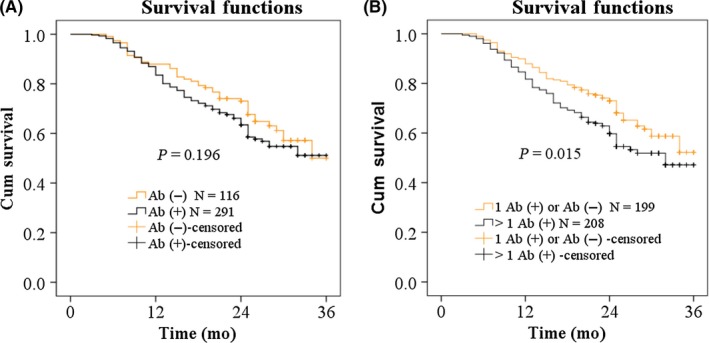
Overall survival curves of gastric adenocarcinoma (GAC) patients with different autoantibody status in the panel of nine anti‐tumor‐associated antigens. A, GAC patients with positive autoantibody and negative autoantibody. B, GAC patients with one positive autoantibody or negative autoantibodies and GAC patients with more than one positive autoantibody. Ab(+), positive autoantibody; Ab(−), negative autoantibody
3.6. Titers of antibodies against 14 TAA in serial sera before and after cancer resection
A total of 67 serial serum samples from 25 GAC patients collected before and after cancer resection were analyzed to investigate the temporal changes of these 14 autoantibodies. The cutoff value was chosen while the Youden index was the largest, and the specificity was more than 90%. Figure 8 shows the temporal changes for some autoantibodies with significant changes in sera from 25 GAC patients before and after cancer resection. Interestingly, several antibodies showed a significant rise in many patients after resection. For example, in patient 1 that donated two sera, one month before resection and nine months after resection, the levels of antibodies against p53, p62/IMP2, c‐Myc, PTEN, ENO1, HCC1.4, NPM1, 14‐3‐3zeta, IMP1, and RalA showed an increase from negative status to positive status after resection whereas anti‐CyclinB1, p16, HSPD1, and MDM2 antibody showed no significant difference (Figure 8). In addition, if a single GAC patient had more than one serum before and after surgery, the means of OD values from the sera before resection and after resection were calculated, respectively. Figure 9 shows that the levels of 10 antibodies were significantly higher in patients after resection than before resection, including ENO1, PTEN, p62/IMP2, NPM1, HCC1.4, HSPD1, IMP1, c‐Myc, RalA, and 14‐3‐3zeta antibodies, whereas other four antibodies against CyclinB1, p53, p16, and MDM2 showed no significant difference (P > .05).
Figure 8.
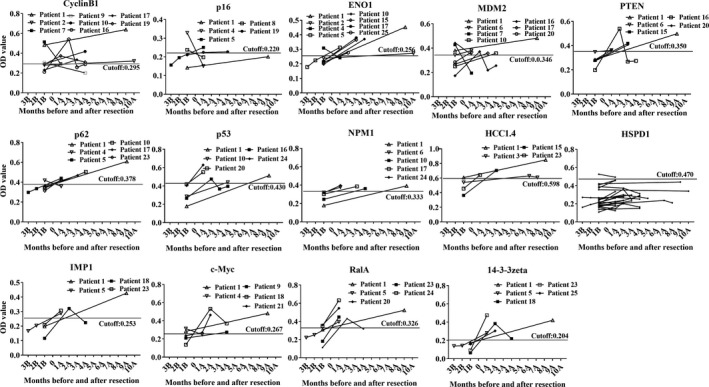
Levels of autoantibodies against 14 tumor‐associated antigens in serial serum samples before and after gastric adenocarcinoma resection. 1B, 1 mo before resection; 1A, 1 mo after resection. OD, optical density
Figure 9.
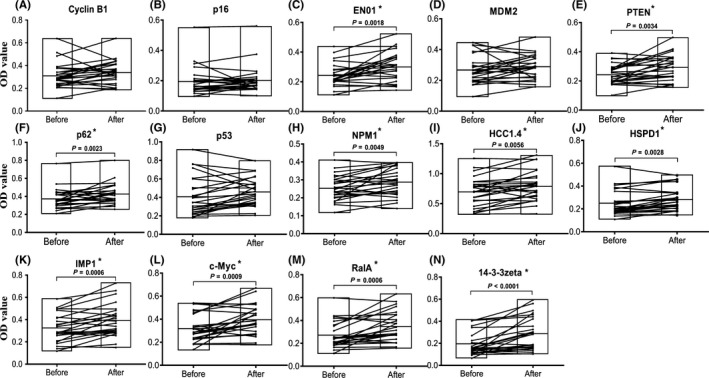
Comparison of autoantibody serum levels to 14 tumor‐associated antigens in serial serum samples before and after resection for gastric adenocarcinoma patients. The line within a box marks the mean OD of a single antibody in sera before or after resection. Floating bars are from min to max. *P < .01
4. DISCUSSION
We detected antibodies against 14 TAAs in 407 GAC sera and in 407 NHS using ELISA. Of these TAAs, c‐Myc, p62/IMP2, 14‐3‐3zeta, MDM2 and IMP1 are oncogene products,23, 24, 25, 26, 27 and PTEN, p16, p53, and ENO1 are tumor suppressor gene products.28, 29 NPM1 has both tumor suppressor gene and oncogene roles.30 Studies showed that RalA, a member of the Ras GTPase family, promotes anchorage‐independent growth in cancer.31 HCC1/CAPERα has been reported in several types of cancer.32 Cyclin B1, a member of the cyclin family, promotes the cell cycle from G2 to M phase, the overexpression of which can lead to uncontrolled cell growth by binding to its partner CKD.33 HSPD1 is also called heat shock protein family D (Hsp60) member 1 and has been shown to influence apoptosis in tumor cells, whereas negative expression is thought to play a role “in activation of apoptosis”.34 Although the exact mechanisms remain unclear, these TAA play an important role in carcinogenesis. This was confirmed by the results of higher average titers of 12 TAA in GAC sera than in NHS.
In the current study, RPA was used to classify GAC patients and normal healthy individuals based on titers of antibodies to 14 TAA. We observed that the nine‐TAA classification tree (c‐Myc, p16, HSPD1, PTEN, p53, NPM1, ENO1, p62/IMP2, and HCC1.4) can obtain the highest diagnostic values in GAC cancer, with AUC of 0.857. The panel of multiple TAA yielded higher values of AUC than a single TAA, which was consistent with the results of previous studies.13, 22, 35 Cutoffs for positive reaction in immunoassays could dramatically affect the performance of classification trees. In general, stringent cutoffs often lead to high false‐negative rates, and low cutoffs lead to high false‐positive rates. Our results confirmed that selection of the normal mean + 2SD for positivity in each immunoassay led to better performance for the classification tree than selection of the normal mean + 1SD and the normal mean + 3SD. In addition, two selections of cutoffs based on ROC obtained higher AUC than the cutoffs of normal mean plus SD.
Recursive partitioning approach is a well‐established statistical methodology and has often been used to solve classification problems in oncology for 20 years.36 There have been many studies reporting the use of recursive partitioning to address different problems related to cancer, such as selection of immune markers for tumor diagnosis,17 prediction of overall survival for patients undergoing spine stereotactic radiosurgery,37 tumor classification with gene expression microarray data,38 and identifying clusters in genomics data.39 Compared with other statistical methods, such as logistic regression and discriminant analysis, an advantage of RPA for classification is that the trees are easy to interpret and often capture much of the relevant covariate structure of the data, including complex interactions and nonlinearities.17
In the current study, nine from 14 serum autoantibodies (c‐Myc, p16, HSPD1, PTEN, p53, NPM1, ENO1, p62, and HCC1.4) were identified from GAC patients using RPA. The panel performed a higher sensitivity of 71.5%, and lower specificity of 71.3%, but did not show a correlation with GAC stage, tumor size, lymph node metastasis or differentiation, indicating that the appearance of these autoantibodies may have less association with the progression of GAC. In line with our results, many previous studies showed similar performance of other biomarkers in gastric cancer (GC). A panel of six antibodies to p53, heat shock protein 70, HCC‐22‐5, peroxiredoxin VI, KM‐HN‐1, and p90 was reported to have a sensitivity of 52.0% and a specificity of 90.5% in GC, and was also observed to have no significant differences based on depth of tumor invasion, lymph node metastasis, distant metastasis, peritoneal dissemination, or TNM stage.9 Werner et al40 reported that a combination of five autoantibodies to MAGEA4, CTAG1, TP53, ERBB2_C and SDCCAG8 could detect 32% of GC patients at a specificity of 87%, and also showed no difference between early stage and late stage. Zayakin et al reported that a 45‐autoantibody signature could discriminate GC and healthy controls with AUC of 0.79 (59% sensitivity and 90% specificity) and could detect early GC with equal sensitivity as advanced GC (however, the P‐value they showed was 0.09).41 Meistere et al42 reported that six antigens of CTAG1B/CTAG2, DDX53, IGF2BP2, TP53, and MAGEA3 were predominantly reacting with sera from GC patients when compared with healthy controls, and that the seroreactivity was associated with intestinal‐type GC, but not with stage. Comparatively, our results suggested that the nine TAA as a panel may have the potential to distinguish GAC patients from normal individuals.
Specific TAA panels not only have sufficient sensitivity in differentiating tumor and normal individuals, but also have association with the survival of tumor patients. Hoshino et al9 reported that patients positive for more than two antibodies in the panel of p53, heat shock protein 70, HCC‐22‐5, peroxiredoxin VI, KM‐HN‐1, and p90 TAA tended to have a worse prognosis than those who were positive for one or no antibody. Therefore, we also evaluated the survival rate of patients with different autoantibody status of the nine anti‐TAA panel, and the results were in accordance with this study. Another study also reported that TAA can be used as monitors of therapeutic response.43 For a patient whose specific anti‐TAA antibody has been detected, changes in antibody levels might reflect change in tumor status or tumor burden related to therapy.7 Shimada44 reviewed all studies of p53‐Ab titers in esophageal squamous cell carcinoma (ESCC) and reported that p53‐Ab is a useful molecular target both in the diagnosis and in the treatment of ESCC. Our previous study observed that the titer of anti‐NPM1 antibody significantly increased in prostate cancer sera after surgical treatment,45 which might reflect the autoimmune responses to the removal of tumor after cancer resection. Thereby, in the present study, we observed the temporal change of 14 antibodies in 67 sera from 25 GAC patients before and after resection. The results showed that 10 from 14 antibodies were significantly higher in GAC patients after surgery than before surgery, which was consist with the previous results.45 In addition, another four antibodies (cyclin B1, p53, p16, MDM2) showed no difference. However, Shimada et al46 followed up 110 patients with esophageal carcinoma before and 1 month after surgery, and reported that p53‐Abs titer generally decreased after surgery. They also followed up a 68‐year old male patient with GAC for 5 years and observed that the p53‐Ab titer decreased after surgery and finally converted from positive to negative at 31 months postoperatively,47 which is different from our results. This may be caused by the different cutoff values and the small sample size and short follow‐up time (10 months) of our study. The specific mechanism of the increased antibody titer after surgery is not completely clear. It is likely that patients with large‐sized tumor are frequently immunosuppressed, and the surgical removal of the tumor could reverse immune suppression owing to the reduction of the quantity of tumor‐related immunosuppression factors, thereby allowing immune response to recover in the absence of the inhibitory cytokines.45, 48 A few studies also assessed immunosuppression after primary tumor removal in humans and reported at least partial recovery of immune function following tumor resection.49, 50
In summary, our study showed that the panel of nine TAA could enhance the detection of GAC regardless of tumor stage, tumor size, differentiation and lymph node metastasis. In addition, antibodies to antigens may be potential prognostic biomarkers. Further prospective studies with comprehensive follow‐up information on GAC patients before and after resection may determine how potential antibodies predict GAC clinical outcome after resection.
CONFLICTS OF INTEREST
Authors declare no conflicts of interest for this article.
ACKNOWLEDGMENTS
This work was supported by the National Science and Technology Major Project of China [number 2018ZX10302205], the Major Project of Science and Technology in Henan Province [number 16110311400], the Program of Natural Science Foundation of Henan Province [number 182300410009], and the Key Project of Tackling Key Problems in Science and Technology of Henan Province [number 182102310110 and 192102310042].
Qin J, Wang S, Shi J, et al. Using recursive partitioning approach to select tumor‐associated antigens in immunodiagnosis of gastric adenocarcinoma. Cancer Sci. 2019;110:1829‐1841. 10.1111/cas.14013
REFERENCES
- 1. Torre LA, Bray F, Siegel RL, Ferlay J, Lortet-Tieulent J, Jemal A. Global cancer statistics, 2012. CA Cancer J Clin. 2015;65:87‐108. [DOI] [PubMed] [Google Scholar]
- 2. Gu XY, Zheng RS, Sun KX, et al. Incidence and mortality of cervical cancer in China, 2014. Chin J Oncol. 2018;40:241‐246. [DOI] [PubMed] [Google Scholar]
- 3. Oh CM, Won YJ, Jung KW, et al. Community of Population‐Based Regional Cancer Registries. Cancer statistics in Korea: incidence, mortality, survival, and prevalence in 2013. Cancer Res Treat. 2016;48:436‐450. [DOI] [PMC free article] [PubMed] [Google Scholar]
- 4. Park JM, Kim YH. Current approaches to gastric cancer in Korea. Gastrointest Cancer Res. 2008;2:137‐144. [PMC free article] [PubMed] [Google Scholar]
- 5. Zhao J, Zhou R, Zhang Q, et al. Establishment of risk evaluation model of peritoneal metastasis in gastric cancer and its predictive value. Chin J Gastrointest Surg. 2017;20:47‐52. [PubMed] [Google Scholar]
- 6. Li Y, Yang Y, Lu M, Shen L. Predictive value of serum CEA, CA19‐9 and CA72.4 in early diagnosis of recurrence after radical resection of gastric cancer. Hepatogastroenterology. 2011;58:2166‐2170. [DOI] [PubMed] [Google Scholar]
- 7. Tan EM, Zhang J. Autoantibodies to tumor‐associated antigens: reporters from the immune system. Immunol Rev. 2008;222:328‐340. [DOI] [PMC free article] [PubMed] [Google Scholar]
- 8. Zhang JY, Tan EM. Autoantibodies to tumor‐associated antigens as diagnostic biomarkers in hepatocellular carcinoma and other solid tumors. Expert Rev Mol Diagn. 2010;10:321‐328. [DOI] [PMC free article] [PubMed] [Google Scholar]
- 9. Hoshino I, Nagata M, Takiguchi N, et al. Panel of autoantibodies against multiple tumor‐associated antigens for detecting gastric cancer. Cancer Sci. 2017;108:308‐315. [DOI] [PMC free article] [PubMed] [Google Scholar]
- 10. Yang L, Wang J, Li J, et al. Identification of serum biomarkers for gastric cancer diagnosis using a human proteome microarray. Mol Cell Proteomics. 2016;15:614‐623. [DOI] [PMC free article] [PubMed] [Google Scholar]
- 11. Imai K, Hirata S, Irie A, et al. Identification of a novel tumor‐associated antigen, cadherin 3/P‐cadherin, as a possible target for immunotherapy of pancreatic, gastric, and colorectal cancers. Clin Cancer Res. 2008;14:6487‐6495. [DOI] [PubMed] [Google Scholar]
- 12. Werner S, Chen H, Tao S, Brenner H. Systematic review: serum autoantibodies in the early detection of gastric cancer. Int J Cancer. 2015;136:2243‐2252. [DOI] [PubMed] [Google Scholar]
- 13. Zhou SL, Ku JW, Fan ZM, et al. Detection of autoantibodies to a panel of tumor‐associated antigens for the diagnosis values of gastric cardia adenocarcinoma. Dis Esophagus. 2015;28:371‐379. [DOI] [PubMed] [Google Scholar]
- 14. Wang S, Qin J, Ye H, et al. Using a panel of multiple tumor‐associated antigens to enhance autoantibody detection for immunodiagnosis of gastric cancer. Oncoimmunology. 2018;7:e1452582. [DOI] [PMC free article] [PubMed] [Google Scholar]
- 15. Lemon SC, Roy J, Clark MA, Friedmann PD, Rakowski W. Classification and regression tree analysis in public health: methodological review and comparison with logistic regression. Ann Behav Med. 2003;26:172‐181. [DOI] [PubMed] [Google Scholar]
- 16. Hess KR, Abbruzzese MC, Lenzi R, Raber MN, Abbruzzese JL. Classification and regression tree analysis of 1000 consecutive patients with unknown primary carcinoma. Clin Cancer Res. 1999;5:3403‐3410. [PubMed] [Google Scholar]
- 17. Koziol JA, Zhang JY, Casiano CA, et al. Recursive partitioning as an approach to selection of immune markers for tumor diagnosis. Clin Cancer Res. 2003;9:5120‐5126. [PubMed] [Google Scholar]
- 18. Therneau TM, Atkinson EJ. An Introduction to Recursive Partitioning Using the RPART Routines. Rochester NY: Mayo Clinic Division of Biostatistics; 2018. [Google Scholar]
- 19. Breiman L. Introduction to tree classification In: Jerome H, Friedman RA, Olshen CJ, eds. Classification and Regression Trees. New York, NY: Routledge; 1984:18‐58. [Google Scholar]
- 20. Shi JX, Qin JJ, Ye H, et al. Tumor associated antigens or anti‐TAA autoantibodies as biomarkers in the diagnosis of ovarian cancer: a systematic review with meta‐analysis. Expert Rev Mol Diagn. 2015;15:829‐852. [DOI] [PubMed] [Google Scholar]
- 21. Dai L, Lei N, Liu M, Zhang JY. Autoantibodies to tumor‐associated antigens as biomarkers in human hepatocellular carcinoma (HCC). Exp Hematol Oncol. 2013;2:15‐21. [DOI] [PMC free article] [PubMed] [Google Scholar]
- 22. Zhang JY, Casiano CA, Peng XX, Koziol JA, Chan EK, Tan EM. Enhancement of antibody detection in cancer using panel of recombinant tumor‐associated antigens. Cancer Epidemiol Biomarkers Prev. 2003;12:136‐143. [PubMed] [Google Scholar]
- 23. Nielsen J, Christiansen J, Lykke‐Andersen J, AH Johnsen, UM Wewer, FC Nielsen. A family of insulin‐like growth factor II mRNA‐binding proteins represses translation in late development. Mol Cell Biol. 1999;19:1262‐1270. [DOI] [PMC free article] [PubMed] [Google Scholar]
- 24. Zhang JY, Chan EKL, Peng XX, Tan EM. A novel cytoplasmic protein with RNA‐binding motifs is an autoantigen in human hepatocellular carcinoma. J Exp Med. 1999;189:1101‐1110. [DOI] [PMC free article] [PubMed] [Google Scholar]
- 25. Dang CV. MYC on the path to cancer. Cell. 2012;149:22‐35. [DOI] [PMC free article] [PubMed] [Google Scholar]
- 26. Murata T, Takayama K, Urano T, et al. 14‐3‐3zeta, a novel androgen‐responsive gene, is upregulated in prostate cancer and promotes prostate cancer cell proliferation and survival. Clin Cancer Res. 2012;18:5617‐5627. [DOI] [PubMed] [Google Scholar]
- 27. Qin JJ, Nag S, Voruganti S, Wang W, Zhang R. Natural product MDM2 inhibitors: anticancer activity and mechanisms of action. Curr Med Chem. 2012;19:5705‐5725. [DOI] [PMC free article] [PubMed] [Google Scholar]
- 28. Lee HS, Lee HK, Kim HS, Kim WH. Tumour suppressor gene expression correlates with gastric cancer prognosis. J Pathol. 2003;200:39‐46. [DOI] [PubMed] [Google Scholar]
- 29. Lawniczak M, Bielicki D, Sulzyc‐Bielicka V, Marlicz K, Starzynska T. Serum anti‐p53 antibodies in gastric cancer patients. Pol Merkur Lekarski. 2007;23:192‐195. [PubMed] [Google Scholar]
- 30. Wang T, Liu Y, Zhao M. Mutational analysis of driver genes with tumor suppressive and oncogenic roles in gastric cancer. PeerJ. 2017;5:e3585. [DOI] [PMC free article] [PubMed] [Google Scholar]
- 31. Tecleab A, Zhang X, Sebti SM. Ral GTPase down‐regulation stabilizes and reactivates p53 to inhibit malignant transformation. J Biol Chem. 2014;289:31296‐31309. [DOI] [PMC free article] [PubMed] [Google Scholar]
- 32. Chai Y, Liu X, Dai L, Li Y, Liu M, Zhang JY. Overexpression of HCC1/CAPERα may play a role in lung cancer carcinogenesis. Tumour Biol. 2014;35:6311‐6317. [DOI] [PMC free article] [PubMed] [Google Scholar]
- 33. Yu M, Zhan QM, Finn OJ. Immune recognition of cyclin B1 as a tumor antigen is a result of its overexpression in human tumors that is caused by non‐functional p53. Mol Immunol. 2002;38:981‐987. [DOI] [PubMed] [Google Scholar]
- 34. Cappello F, Di Stefano A, David S, et al. Hsp60 and Hsp10 down‐regulation predicts bronchial epithelial carcinogenesis in smokers with chronic obstructive pulmonary disease. Cancer. 2006;107:2417‐2424. [DOI] [PubMed] [Google Scholar]
- 35. Huangfu M, Xu S, Li S, et al. A panel of autoantibodies as potential early diagnostic serum biomarkers in patients with cervical cancer. Tumour Biol. 2016;37:8709‐8714. [DOI] [PubMed] [Google Scholar]
- 36. Dillman RO, Koziol JA. Statistical approach to immunosuppression classification using lymphocyte surface‐markers and functional assays. Can Res. 1983;43:417‐421. [PubMed] [Google Scholar]
- 37. Balagamwala EH, Miller JA, Reddy CA, et al. Recursive partitioning analysis is predictive of overall survival for patients undergoing spine stereotactic radiosurgery. J Neurooncol. 2018;137:289‐293. [DOI] [PubMed] [Google Scholar]
- 38. Zhang H, Yu CY, Singer B, Xiong M. Recursive partitioning for tumor classification with gene expression microarray data. Proc Natl Acad Sci USA. 2001;98:6730‐6735. [DOI] [PMC free article] [PubMed] [Google Scholar]
- 39. Nilsen G, Borgan O, Liestol K, Lingjaerde OC. Identifying clusters in genomics data by recursive partitioning. Stat Appl Genet Mol Biol. 2013;12:637‐652. [DOI] [PubMed] [Google Scholar]
- 40. Werner S, Chen H, Butt J, et al. Evaluation of the diagnostic value of 64 simultaneously measured autoantibodies for early detection of gastric cancer. Sci Rep. 2016;6:254‐267. [DOI] [PMC free article] [PubMed] [Google Scholar]
- 41. Zayakin P, Ancans G, Silina K, et al. Tumor‐associated autoantibody signature for the early detection of gastric cancer. Int J Cancer. 2013;132:137‐147. [DOI] [PubMed] [Google Scholar]
- 42. Meistere I, Werner S, Zayakin P, et al. The prevalence of cancer‐associated autoantibodies in patients with gastric cancer and progressive grades of premalignant lesions. Cancer Epidemiol Biomarkers Prev. 2017;26:1564‐1574. [DOI] [PubMed] [Google Scholar]
- 43. Egloff AM, Vella LA, Finn OJ. Cyclin B1 and other cyclins as tumor antigens in immunosurveillance and immunotherapy of cancer. Can Res. 2006;66:6‐9. [DOI] [PubMed] [Google Scholar]
- 44. Shimada H. p53 molecular approach to diagnosis and treatment of esophageal squamous cell carcinoma. Ann Gastroenterol Surg. 2018;2:266‐273. [DOI] [PMC free article] [PubMed] [Google Scholar]
- 45. Dai L, Li J, Xing M, Scanchez TW, Casiano CA, Zhang JY. Using serological proteome analysis to identify serum anti‐nucleophosmin 1 autoantibody as a potential biomarker in European‐American and African‐American patients with prostate cancer. Prostate. 2016;76:1375‐1386. [DOI] [PubMed] [Google Scholar]
- 46. Shimada H, Shiratori T, Takeda A, et al. Perioperative changes of serum p53 antibody titer is a predictor for survival in patients with esophageal squamous cell carcinoma. World J Surg. 2009;33:272‐277. [DOI] [PubMed] [Google Scholar]
- 47. Murayama K, Nanami T, Suzuki T, et al. Negative conversion of high serum p53 antibody titers in a patient with gastric cancer at 31 months after surgery. Clin J Gastroenterol. 2017;10:357‐360. [DOI] [PubMed] [Google Scholar]
- 48. Danna EA, Sinha P, Gilbert M, Clements VK, Pulaski BA, Ostrand-Rosenberg S. Surgical removal of primary tumor reverses tumor‐induced immunosuppression despite the presence of metastatic disease. Cancer Res. 2004;64:2205‐2211. [DOI] [PubMed] [Google Scholar]
- 49. Barbieri C, Fujisawa MM, Yasuda CL, et al. Effect of surgical treatment on the cellular immune response of gastric cancer patients. Braz J Med Biol Res. 2003;36:339‐345. [DOI] [PubMed] [Google Scholar]
- 50. Almand B, Clark JI, Nikitina E, et al. Increased production of immature myeloid cells in cancer patients: a mechanism of immunosuppression in cancer. J Immunol. 2001;166:678‐689. [DOI] [PubMed] [Google Scholar]