

Abstract
Neurodegenerative disorders, such as Parkinson’s disease (PD) and Alzheimer’s disease (AD), are important public health problems warranting early detection. We trained machine-learned classifiers on the longitudinal search logs of 31,321,773 search engine users to automatically detect neurodegenerative disorders. Several digital phenotypes with high discriminatory weights for detecting these disorders are identified. Classifier sensitivities for PD detection are 94.2/83.1/42.0/34.6% at false positive rates (FPRs) of 20/10/1/0.1%, respectively. Preliminary analysis shows similar performance for AD detection. Subject to further refinement of accuracy and reproducibility, these findings show the promise of web search digital phenotypes as adjunctive screening tools for neurodegenerative disorders.
Subject terms: Neurological disorders, Public health
Introduction
Neurodegenerative disorders (NDs) are prevalent and a major source of healthcare expenditure.1 NDs progress slowly,2 and their symptoms may be subtle and mistaken for more common conditions.3, 4 Early detection of NDs enables earlier intervention, which can slow their progression. This study examines the use of digital phenotypes5 for detecting NDs, operationalized as patterns of search activity gathered during engagement with web search engines. Methods based on these observational data show promise in offering new pathways for the early detection of brain disease.
Prior studies with large-scale logs of the search activity of millions of people have highlighted opportunities for detection of cancer6, 7 and for disease surveillance.8, 9 This study investigates how analyses of longitudinal log data from search engines might help detect evidence of Parkinson’s disease (PD), a common progressive ND affecting some 7–10 million people worldwide. Dopaminergic deficiency in PD results in symptoms such as tremors and cognitive decline,10 evidence of which may be apparent in search log signals. PD is challenging to diagnose: the current accuracy of clinical diagnosis of probable PD for patients presenting with motor symptoms in primary care settings is around 80%, with limited improvements in the past 25 years, especially at early disease stages.11 Hence, there is a need for a simple scalable test that can be used for screening in the community or at home. This work also explores whether classifiers using search log signals can help with diagnostic challenges in PD, specifically distinguishing early PD from essential tremor (ET).3, 4
This study uses a total of 18 months of deidentified logs of United States search activity from the Microsoft Bing web search engine, comprising millions of English-speaking searchers from September 2015 to February 2017 inclusive. These data are routinely collected for improving search results and permitted through Bing’s Terms of Service. A range of observational features were computed per searcher over the duration of the logs: (1) Symptom: presence of PD symptom-related query terms (including synonyms) derived from published literature; (2) Motor: motor symptoms such as cursor movements, including speed, direction changes, tremors (defined as horizontal or vertical oscillations in cursor position up to 20 pixels in each direction), and vertical scrolling. Cursor position data were sampled while the cursor was in motion; (3) Repetition: presence of repeat queries, repeat result clicks, and repeat query-result click pairs, and (4) Risk Factors: presence of risk factors derived from previous work (e.g.,12–14). These included age and gender (inferred using proprietary Bing classifiers), and head trauma, toxin exposure, and familial factors based on terminology appearing in query text. For the Motor class, feature values are first computed per query instance and then averaged across all query instances for the searcher. Some features align with criteria used by physicians (e.g., tremors)10, 15 while others are more difficult to measure in clinical practice (e.g., memory loss).16
From the full set of logs, searchers who input queries containing first-person statements about PD diagnosis (e.g., “just diagnosed with parkinsons”) were identified. These experiential diagnostic queries are used as evidence of receiving a PD diagnosis. Cases exhibiting evidence that diagnostic queries were for others (e.g., father, spouse, etc.) were excluded. Multiple additive regression trees (MART) classifiers17 were trained to detect evidence of PD diagnosis from all PD symptom searchers. Advantages of MART include model interpretability, facility for rapid training and testing, and robustness against noisy labels and missing values. There were 703 positive cases, of searchers who queried for symptoms and issued at least one experiential diagnostic query (30.8% of the experiential diagnostic searchers), and 31,321,070 negative cases, of searchers who only issued queries on PD symptoms. The data were used in classifier training as is. The application of sampling methods to correct for class imbalance is left to future work. Since NDs progress slowly2 and the observation window is limited to 18 months, the classification task likely identifies the existence of PD rather than forecasting a future diagnosis.
Ten-fold cross validation was used to train and test the classifier. It predicts the input of an experiential diagnostic query for PD with strong performance (area under the receiver operating characteristic curve [AUROC] = 0.9357) using 18 months of search log data. AUROC drops to 0.8626 with 12 months of data, and 0.8151 with 6 months of data. Since false positives can generate unnecessary alarm and additional healthcare utilization in fielded uses (e.g., at population-scale in search engines), low false positive rates (FPRs) are desirable. Classifier sensitivities at FPR = 20/10/1/0.1% are 94.2/83.1/42.0/34.6%, respectively. The results offer evidence that the existence of NDs in searchers is detectable from streams of data from the use of search engines over time. Table 1 shows the list of observational features with non-zero discriminatory weights in the learned classifier. Features related to tremors—both from search terms (e.g., “hands shaking”) and from mouse cursor movements (e.g., estimated rate of cursor position oscillation), repeat queries, and repeat search-result clicks, and the inferred age and gender of searchers, had highest discriminatory weights.
Table 1.
Features used in PD classifier, ranked by discriminative weight and scored with respect to the top-ranked feature: TimeBetweenRepeatQueries. Features are computed over all queries for each searcher. Features from the Motor class are first computed for each query instance and then averaged across all query instances for that searcher
| Feature name | Class | Brief description | Weight |
|---|---|---|---|
| TimeBetweenRepeatQueries | Repetition | AVG time between repeat queries | 1.000000 |
| FractionOfQueriesAreRepeats | Repetition | % of all queries that are repeat queries | 0.971182 |
| NumberOfTremorEvents | Motor | # of tremor eventsa | 0.715004 |
| AverageTremorFrequency | Motor | AVG tremor frequency in hertz (# of oscillations/time) | 0.595772 |
| FractionOfQueriesHaveSymptoms | Symptom | % of all queries with 1+ symptoms | 0.457336 |
| AgeIs50To85 | Risk Factors | Inferred searcher age is 50–85 years | 0.432355 |
| FractionOfClicksAreRepeats | Repetition | % of result clicks that are repeat clicks on same result | 0.341164 |
| FractionOfQueriesHaveRiskFactors | Risk Factors | % of all queries with 1+ risk factors | 0.329801 |
| GenderIsFemale | Risk Factors | Inferred gender is female | 0.313425 |
| TotalTimeCursorMoving | Motor | Total time mouse cursor is actively moving | 0.297699 |
| NumberOfScrollEvents | Motor | # of scroll events | 0.259432 |
| NumberOfScrollEventsDownward | Motor | # of scroll events downward | 0.256692 |
| AverageScrolVelocity | Motor | AVG scrolling velocity | 0.249454 |
| MinimumCursorYCoordinate | Motor | MIN y-coordinate of mouse cursor (top of page y is 0) | 0.247770 |
| FractionOfCursorTransitionsAreDirectionChanges | Motor | % of mouse cursor transitions with direction changesb | 0.243873 |
| AverageCursorAcceleration | Motor | AVG acceleration of mouse cursor | 0.239814 |
| NumberOfHyperlinkClicks | Motor | # of hyperlink clicks | 0.239568 |
| AverageCursorVelocity | Motor | AVG velocity of mouse cursor | 0.232418 |
| NumberOfCursorTransitionsAreDirectedUpward | Motor | # of transitions directed upward | 0.232311 |
| TotalDistanceScrolled | Motor | Total distance scrolled | 0.215000 |
| AverageCursorXCoordinate | Motor | AVG x-coordinate of mouse cursor (left of page x is 0) | 0.214955 |
| FractionCursorTimeInWhitespace | Motor | % of time mouse cursor in whitespacec | 0.211925 |
| MaximumDeviationInPreclickCursorTrail | Motor | MAX deviation in pre-click mouse cursor traild | 0.210185 |
| AveragePreclickCursorVelocity | Motor | AVG velocity of mouse cursor before click | 0.208572 |
| TotalScrollingTime | Motor | Total time spent scrolling | 0.207520 |
| AverageCursorJounce | Motor | AVG jounce of mouse cursor | 0.206460 |
| MinimumCursorXCoordinate | Motor | MIN x-coordinate of mouse cursor | 0.199193 |
| MaximumCursorVelocity | Motor | MAX mouse cursor velocity | 0.196639 |
| NumberOfCursorTransitions | Motor | # of mouse cursor transitions between logged points | 0.192631 |
| GenderIsMale | Risk Factors | Inferred gender is male | 0.191614 |
| AverageCursorVelocity | Motor | AVG velocity of mouse cursor | 0.190826 |
| CursorExhibitsReadingBehavior | Motor | Cursor shows evidence of reading behavior21 | 0.190713 |
| FractionCursorMoveTimeHaveTremors | Motor | % of mouse cursor move time having tremor events | 0.188127 |
| AverageCursorYCoordinate | Motor | AVG y-coordinate of mouse cursor | 0.171520 |
| AverageCursorJerk | Motor | AVG jerk of mouse cursor | 0.168440 |
| NumberOfTransitionsDirectedRightward | Motor | # of mouse cursor transitions directed rightward | 0.157965 |
| TotalNumberOfClicks | Motor | # of mouse clicks, inc. non-hyperlink (in whitespace) | 0.153249 |
| AverageAccelerationOfCursor | Motor | AVG acceleration of mouse cursor | 0.150714 |
| AgeIs35To49 | Risk Factors | Inferred searcher age is 35–49 years | 0.145166 |
| NumberOfNonHyperlinkClicks | Motor | # of non-hyperlink mouse clicks | 0.132365 |
| MaximumCursorYCoordinate | Motor | MAX y-coordinate of mouse cursor | 0.127897 |
| NumberOfCursorEvents | Motor | # of mouse cursor events | 0.126026 |
| NumberOfScrollEventsUpward | Motor | # of upward scroll events | 0.117682 |
| TotalCursorDistanceTraveled | Motor | Total distance traveled by mouse cursor | 0.111703 |
| AverageCursorPreclickOverrunDistance | Risk Factors | AVG pre-click mouse cursor link overrun distancee | 0.110122 |
| AverageCursorPreclickDeviation | Motor | AVG deviation in pre-click mouse cursor trail | 0.106043 |
| NumberOfCursorTransitionsDownward | Motor | # of mouse cursor transitions directed downward | 0.104645 |
| MaximumCursorJerk | Motor | MAX jerk of mouse cursor | 0.098519 |
| NumberOfCursorLoops | Motor | # of 360° loops in mouse cursor movementsf | 0.094700 |
| FractionOfTimeWithCursorInWhitespace | Motor | % of time spent with mouse cursor in whitespace | 0.092794 |
| MaximumCursorYCoordinate | Motor | MAX y-coordinate of mouse cursor | 0.081183 |
| NumberOfCursorTransitionsLeft | Motor | # of mouse cursor transitions directed left | 0.074749 |
| MaximumCursorJounce | Motor | MAX jounce of mouse cursor | 0.072211 |
| AgeIs25To34 | Risk Factors | Inferred searcher age is 25–34 years | 0.069420 |
| NumberOfCursorDirectionChanges | Motor | # of mouse cursor direction changes | 0.068290 |
| FractionQueriesWithRepeatQueryClick | Repetition | % of queries with repeat query-result click pair | 0.045272 |
| MaximumCursorPreclickVelocity | Motor | MAX velocity of pre-click mouse cursor trail | 0.035155 |
a Tremor events are defined as horizontal or vertical oscillations in the position of the mouse cursor, with a mouse cursor movement of no more than 20 pixels in either direction
b Transitions between logged cursor position data points where a change in mouse cursor direction is noted (e.g., moving the mouse cursor leftward then moving the mouse cursor rightward)
c Fraction of total time spent on the search engine result page where the mouse cursor is parked over whitespace (i.e. regions of the result page where there are no elements)
d Average residuals in a line of best fit for the five cursor position data points (i.e. the cursor trail) logged before a hyperlink click
e Total distance traveled (in pixels) by mouse cursor pre-click after initial pass over the target hyperlink
f Number of 360-degree loops in the mouse cursor trails, where a loop is defined as a sequence of direction changes resulting in a circular motion of the mouse cursor (e.g., move right, move down, move left, move up)
Tremors have many explanations, including ET, which shares some symptoms with PD. Distinguishing between ET and early PD is important for tremor sufferers.3 Focusing on those who searched for tremors (n = 4,262,953), a MART classifier was trained to distinguish PD (n = 309) and ET (n = 307). Figure 1 shows the ROC curve illustrating strong classifier performance (AUROC = 0.9205) using all features available to the classifier. Features related to scrolling, cursor direction changes, tremor frequencies, and query repetition were important. This is corroborated by ablation studies, where the largest drop in AUROC (23%, Z = 7.10, p < 0.00118) occurs when Motor features are excluded. Motor symptoms, including tremor frequencies, are also important in distinguishing ET and PD during clinical examinations.19
Fig. 1.
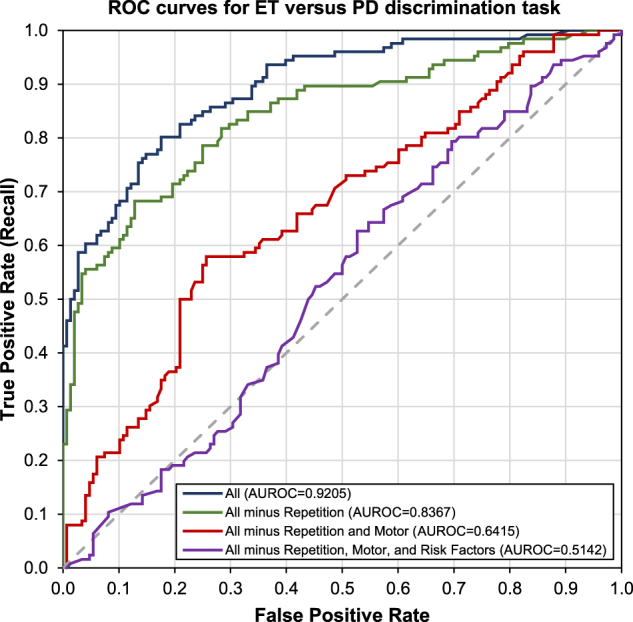
Receiver-operator characteristic curve for the task of discriminating between Parkinson’s disease (PD) and essential tremor (ET), using all features and with feature ablations. Starting with the classifier using all features (All), ablations removed features of the repetition class (all minus repetition), repetition and motor classes (all minus repetition and motor), and repetition, motor, and risk factors classes (all minus repetition, motor, and risk factors). After each class is removed, the classifier is retrained and AUROC is recomputed. When all three classes are removed, the classifier uses only features from the Symptom class (purple line)
The classifiers learned from search query and motor interaction data show promise for developing new kinds of diagnostic tools for NDs. The periodic application of these methods may support the study of temporal dynamics in NDs for consenting searchers. They can also help discriminate between illnesses with similar symptoms, as shown with a case study of identifying searchers with experiential diagnostic queries for ET versus PD. The classifier leverages evidence unavailable to physicians (e.g., longitudinal query repetition, mouse cursor activity) that could aid in more traditional clinical diagnoses. Application of these classifiers could help screen for patients with higher ND likelihoods. Surfacing their predictions and confidence scores to physicians could offer additional evidence to help physicians discriminate between conditions. Identifying the specific digital phenotypes (e.g., estimated tremor frequencies) related to NDs that carry most weight for each patient may also have diagnostic utility. It is noted that while experiential diagnostic queries provide evidence of ND, definitive ground truth was unavailable in this study. Future work will expand this analysis to other NDs and perform prospective analyses with clinically diagnosed ND patients at different stages of illness to validate the diagnostic and prognostic utility of digital signals. Preliminary analysis shows that the methods in this study may scale to other NDs, such as Alzheimer’s disease (AUROC = 0.9135, classifier sensitivities at FPR = 20/10/1/0.1% are 91.0/81.5/38.8/26.1%, respectively). A recent study of keystroke typing patterns in verified PD patients20 found similar results to those on PD presented herein. The findings of the two studies taken together support the promise of using digital phenotypes for early detection of PD.
Data availability statement
The data that support the findings of this study are available from Microsoft, but restrictions apply to the availability of these data. Data are however available from the authors upon reasonable request and with permission of Microsoft.
Author contributions
All authors designed the study and co-authored the manuscript. In addition, R.W.W. mined the logs, trained and tested the machine-learned models, and performed the statistical analysis.
Competing interests
P.M.D. has received grants and/or advisory fees from health and technology companies for other projects and owns stock in several companies whose products are not discussed here. R.W.W. and E.H. are employees of Microsoft Corporation and own stock in the company.
Footnotes
Publisher's note: Springer Nature remains neutral with regard to jurisdictional claims in published maps and institutional affiliations.
References
- 1.De Lau LM, Breteler MM. Epidemiology of Parkinson’s disease. Lancet Neurol. 2006;5:525–535. doi: 10.1016/S1474-4422(06)70471-9. [DOI] [PubMed] [Google Scholar]
- 2.DeKosky ST, Marek K. Looking backward to move forward: early detection of neurodegenerative disorders. Science. 2003;302:830–834. doi: 10.1126/science.1090349. [DOI] [PubMed] [Google Scholar]
- 3.Meara JO, Bhowmick BK, Hobson PE. Accuracy of diagnosis in patients with presumed Parkinson’s disease. Age Ageing. 1999;28:99–102. doi: 10.1093/ageing/28.2.99. [DOI] [PubMed] [Google Scholar]
- 4.Hughes AJ, Daniel SE, Kilford L, Lees AJ. Accuracy of clinical diagnosis of idiopathic Parkinson’s disease: a clinico-pathological study of 100 cases. J. Neurol. Neurosurg. Psychiatry. 1992;55:181–184. doi: 10.1136/jnnp.55.3.181. [DOI] [PMC free article] [PubMed] [Google Scholar]
- 5.Jain SH, Powers BW, Hawkins JB, Brownstein JS. The digital phenotype. Nat. Biotechnol. 2015;33:462–463. doi: 10.1038/nbt.3223. [DOI] [PubMed] [Google Scholar]
- 6.White RW, Horvitz E. Evaluation of the feasibility of screening patients for early signs of lung carcinoma in web search logs. JAMA Oncol. 2016;3:398–401. doi: 10.1001/jamaoncol.2016.4911. [DOI] [PubMed] [Google Scholar]
- 7.Paparrizos J, White RW, Horvitz E. Screening for pancreatic adenocarcinoma using signals from web search logs: feasibility study and results. J. Oncol. Pract. 2016;12:737–744. doi: 10.1200/JOP.2015.010504. [DOI] [PubMed] [Google Scholar]
- 8.Ginsberg J, et al. Detecting influenza epidemics using search engine query data. Nature. 2009;457:1012–1014. doi: 10.1038/nature07634. [DOI] [PubMed] [Google Scholar]
- 9.Brownstein JS, Freifeld CC, Madoff LC. Digital disease detection: harnessing the web for public health surveillance. N. Engl. J. Med. 2009;360:2153–2157. doi: 10.1056/NEJMp0900702. [DOI] [PMC free article] [PubMed] [Google Scholar]
- 10.Jankovic J. Parkinson’s disease: clinical features and diagnosis. J. Neurol. Neurosurg. Psychiatry. 2008;79:368–376. doi: 10.1136/jnnp.2007.131045. [DOI] [PubMed] [Google Scholar]
- 11.Rizzo G, et al. Accuracy of clinical diagnosis of Parkinson disease: a systematic review and meta-analysis. Neurology. 2016;86:566–576. doi: 10.1212/WNL.0000000000002350. [DOI] [PubMed] [Google Scholar]
- 12.Bishop NA, Lu T, Yankner BA. Neural mechanisms of ageing and cognitive decline. Nature. 2010;464:529. doi: 10.1038/nature08983. [DOI] [PMC free article] [PubMed] [Google Scholar]
- 13.Brown RC, Lockwood AH, Sonawane BR. Neurodegenerative diseases: an overview of environmental risk factors. Environ. Health Perspect. 2005;113:1250. doi: 10.1289/ehp.7567. [DOI] [PMC free article] [PubMed] [Google Scholar]
- 14.Bertram L, Tanzi RE. The genetic epidemiology of neurodegenerative disease. J. Clin. Invest. 2005;115:1449. doi: 10.1172/JCI24761. [DOI] [PMC free article] [PubMed] [Google Scholar]
- 15.Elble RJ. Diagnostic criteria for essential tremor and differential diagnosis. Neurology. 2000;54:S2–S6. doi: 10.1212/WNL.54.1.2. [DOI] [PubMed] [Google Scholar]
- 16.Chaudhuri KR, Healy DG, Schapira AH. Non-motor symptoms of Parkinson’s disease: diagnosis and management. Lancet Neurol. 2006;5:235–245. doi: 10.1016/S1474-4422(06)70373-8. [DOI] [PubMed] [Google Scholar]
- 17.Friedman JH. Greedy function approximation: a gradient boosting machine. Ann. Stat. 2001;29:1189–1232. doi: 10.1214/aos/1013203451. [DOI] [Google Scholar]
- 18.Hanley JA, McNeil BJ. The meaning and use of the area under a receiver operating characteristic (ROC) curve. Radiology. 1982;143:29–36. doi: 10.1148/radiology.143.1.7063747. [DOI] [PubMed] [Google Scholar]
- 19.Thenganatt MA, Louis ED. Distinguishing essential tremor from Parkinson’s disease: bedside tests and laboratory evaluations. Expert. Rev. Neurother. 2012;12:687–696. doi: 10.1586/ern.12.49. [DOI] [PMC free article] [PubMed] [Google Scholar]
- 20.Adams WR. High-accuracy detection of early Parkinson’s disease using multiple characteristics of finger movement while typing. PLoS. One. 2017;12:e0188226. doi: 10.1371/journal.pone.0188226. [DOI] [PMC free article] [PubMed] [Google Scholar]
- 21.Rodden, K., Fu, X., Aula, A. & Spiro, I. Eye-mouse coordination patterns on web search results pages. Proc. SIGCHI Ext. Abs. 2997–3002 (ACM, New York, NY, USA, 2008).
Associated Data
This section collects any data citations, data availability statements, or supplementary materials included in this article.
Data Availability Statement
The data that support the findings of this study are available from Microsoft, but restrictions apply to the availability of these data. Data are however available from the authors upon reasonable request and with permission of Microsoft.