

Abstract
Purpose:
To perform multi-echo water/fat separated proton resonance frequency (PRF)-shift temperature mapping.
Methods:
State-of-the-art, iterative multi-echo water/fat separation algorithms produce high-quality water and fat images in the absence of heating but are not suitable for real-time imaging due to their long compute times and potential errors in heated regions. Existing fat-referenced PRF-shift temperature reconstruction methods partially address these limitations but do not address motion or large time-varying and spatially inhomogeneous B0 shifts. We describe a model-based temperature reconstruction method that overcomes these limitations by fitting a library of separated water and fat images measured before heating directly to multi-echo data measured during heating, while accounting for the PRF shift with temperature.
Results:
Simulations in a mixed water/fat phantom with focal heating showed that the proposed algorithm reconstructed more accurate temperature maps in mixed tissues compared to a fat-referenced thermometry method. In a porcine phantom experiment with focused ultrasound heating at 1.5 Tesla, temperature maps were accurate to within 1°C of fiber optic probe temperature measurements and were calculated in 0.47 s per time point. Free-breathing breast and liver imaging experiments demonstrated motion and off-resonance compensation. The algorithm can also accurately reconstruct water/fat separated temperature maps from a single echo during heating.
Conclusions:
The proposed model-based water/fat separated algorithm produces accurate PRF-shift temperature maps in mixed water and fat tissues in the presence of spatiotemporally varying off-resonance and motion.
Keywords: fat suppression, proton resonance frequency shift, temperature mapping, water/fat separation
1 |. INTRODUCTION
Magnetic Resonance (MR) temperature mapping enables realtime guidance of minimally-invasive and non-invasive thermal therapies. Multiple MR parameters exhibit a temperature dependence and can be used for temperature mapping,1 but the proton resonant frequency-shift (PRFS) with temperature is the most widely used mechanism due to its simplicity and sensitivity. It is typically implemented using a gradient-recalled echo (GRE) pulse sequence that acquires a set of baseline images prior to heating, and a time series of images during heating. The phase difference between the baseline and heating images is proportional to the PRFS and can be converted to temperature. However, direct subtraction of image phase is prone to errors resulting from spatiotemporally varying sources of distortion, including off-resonance, tissue motion, and respiration. Many approaches have been reported that make PRFS thermometry more robust to these sources of error.2–8 Another challenge is the presence of fat in heated voxels, since fat experiences a much smaller PRFS with temperature than water.9 This is particularly a problem when monitoring therapies such as focused ultrasound ablation of breast tumors, which are highly embedded in adipose tissue.10
To prevent temperature errors due to fat, PRFS temperature mapping typically uses spectral-spatial pulses to obtain water-only images.11,12 However, these pulses are sensitive to off-resonance and place a lower limit on slice thickness.1 An alternative is to use multiple gradient echo imaging sequences to separate water and fat signals computationally, and use the fat signal as a heat-insensitive reference for off-resonance compensation. Water/fat separation in anatomic imaging has been an active area of development in recent years, and state-of-the-art approaches are available that produce separations with excellent robustness to off-resonance.13–15 However, these approaches are too computationally expensive to be applied in real-time to each image in a heating time series. A secondary problem demonstrated in this work is that these methods assume a fixed frequency difference between water and fat, and therefore, produce increasingly erroneous separations as water is heated.
In this work, we describe a multi-echo water/fat separated temperature mapping method that is robust to motion, estimates dynamic off-resonance frequency changes from both water and fat signals, and can estimate temperature from a single echo during heating. It can benefit from the use of state-of-the-art, iterative water/fat separation without requiring separations to be computed during heating. The method works by collecting a baseline library of pretreatment images over a range of motion states, performing water/fat separation on those images, and then incorporating the separated baseline water and fat images into a heating image model. That model is fit to heating images to estimate water/fat separated, dynamic off-reso-nance- and motion-corrected temperature maps, without performing explicit water/fat separation on the heating images. Simulations were performed to evaluate the method across a range of temperatures, fat fractions, motion, and off-resonance field shift amplitudes and spatial orders. Experiments were performed in tissue phantoms with heating to verify temperature accuracy and in healthy human subjects without heating to verify temperature precision in the presence of dynamic off-resonance field changes and motion.
2 |. THEORY
2.1 |. Multi-Echo Heating Image Model
The proposed algorithm is based on a multi-echo signal model for images with heating that combines the hybrid multibaseline and referenceless image model4 with a water/fat separated multi-echo image model.22 The hybrid model has previously been shown to be robust to tissue motion and spatiotemporally varying off-resonance caused by scanner off-resonance shift, cardiac motion, and respiration. For a single echo image with heating, the model comprises a localized heating-induced frequency or phase shift applied to a weighted combination of pre-heating baseline images, and is given by:
| (1) |
where yj is the complex-valued MR signal in image voxel j, Nl is the number of complex-valued baseline library images bl, the xl are the baseline weights, is a polynomial basis function in space multiplied by the coefficient vector c, whose product models dynamic off-resonance frequency changes that are not related to heating, u = γαB0 where γ is the gyromagnetic ratio, α = −0.01 ppm/°C, B0 is the scanner field strength in Tesla, ΔTj is the temperature shift in degrees Celsius due to heating, and TE is the echo time in seconds.
To model multi-echo signals with water and fat components, the above image model is combined with the following water/fat separated signal model for voxel j at echo time TE:
| (2) |
where Wj and Fj are the baseline water and fat images at voxel j, M is the number of fat spectral peaks, the αm are the fat peak relative amplitudes, the ωm are the offsets between the fat and water peak frequencies, TE is the echo time, is the effective transverse relaxation rate, and Δωj is the baseline off-resonance field map. This signal equation applies to baseline images acquired prior to heating and is combined with the hybrid model in Equation 1 to obtain a multi-echo water/fat separated image model during heating.
Combining Equations 1 and 2, we obtain a water/fat separated multi-echo hybrid thermometry signal model at voxel j and echo time TE:
| (3) |
where Wj,l and Fj,l are the baseline water and fat library images. The field off-resonance map Δω, the transverse relaxation and the dynamic polynomial off-resonance frequency shift Ac apply to both water and fat components, while the PRFS only applies to the water component (ΔTj). During heating, this model is fit jointly to a set of multi-echo images using the algorithm described next. Note that similarly to Ref. 4, this work uses a referenceless heating image model to account for dynamic changes in off-resonance, but models it as a frequency shift rather than a phase shift to generalize to multiple echoes.
2.2 |. Model-based temperature reconstruction algorithm
The model-based water/fat separated temperature reconstruction algorithm is illustrated in Figure 1 and fits the multi-echo signal model of Equation 3 as follows. First, the multi-echo baseline library images are separated into their water and fat signal components, generating a library of water and fat images for each motion state. Since the images are measured prior to heating, water/fat separation can be performed using state-of-the-art, iterative water/fat separation methods. These separations are robust to field inhomogeneities and yield off-resonance and maps,13–15 but they are applied only to the baseline images due to their long compute times. Given the separated baseline water and fat images, Equation 3 is jointly fit to the multi-echo images during heating by minimizing the cost function
| (4) |
FIGURE 1.
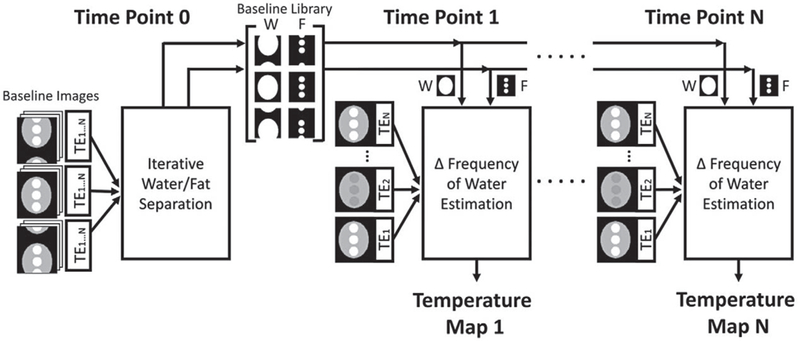
Model-based water/fat separated thermometry algorithm flow chart. The multi-echo baseline images are processed to obtain a library of water/fat separated images, which are subsequently used to estimate temperature during dynamic imaging. In this way, an accurate water/ fat separated temperature map can be reconstructed for each heating time point, without repeatedly performing computationally expensive water/fat separation
The first term of Equation 4 is proportional to the negative log-likelihood of the data and measures the errors between the acquired complex-valued data at voxel j and echo k, and the model described by Equation 3. Ns and Ne are the number of voxels and number of echoes, respectively. The second term is the l1 norm of the temperature change map ΔTn, and λ is a regularization parameter that is tuned to control the map’s sparsity. This sparsity regularization reflects the expectation that for localized therapies such as focused ultrasound ablation, heating will occur in a minority of image voxels. An iterative algorithm extended from Ref. 4 is used to minimize this cost function, which alternates between updating ΔT, c, and x, minimizing one while the other two are held constant. ΔT and x are initialized to zero and ΔT is constrained to be non-negative since temperature is expected to rise during heating. To avoid local minima in the presence of large off-resonance changes, the zeroth-order entry in c is initialized with 0 and ±π/TEmean radians/second in the first iteration. The rest of the fit proceeds using the initial value of c that resulted in the lowest cost. At each iteration, ΔT and c are updated using gradient descent and x is updated by solving a quadratic program, subject to a non-negativity constraint and the requirement that its entries sum to one. Once the algorithm converges, it is repeated with λ = 0 and ΔT is updated only in voxels with significant heat as determined by thresholding, to eliminate downward temperature bias due to the l1 regularization. Note that unlike previous water/ fat separated thermometry methods, the off-resonance frequency shift coefficients c are determined from both the fat and water signals. In this way, the fat signal serves as a heating-insensitive off-resonance frequency shift reference same as previous methods but does not require extrapolation of the shifts to water-only voxels. The baseline weights x are also determined from both signals. Note that no explicit water/fat separation of the heating images is used in this temperature reconstruction.
3 |. METHODS
The model-based algorithm was evaluated in simulations, a porcine focused ultrasound heating experiment, and in vivo breast and liver imaging experiments in free-breathing volunteers without heating. All reconstructions and analyses were performed in MATLAB (Mathworks Inc., Natick, Massachusetts) on a 3.4 GHz 8 core desktop computer running Ubuntu 16.04 with 32 GB RAM. Baseline multi-echo images were separated into their water and fat components using the Mixed-Magnitude method22 initialized with the Graph Cut method13 from the ISMRM Fat-Water Toolbox.15 The first echo image of acquired data was discarded for the water/fat separation to avoid a known first echo signal instability on our scanner that results in inaccurate water/fat separations. The data was normalized by the median value of the heating images and the number of echoes prior to temperature map reconstruction. The model-based method was compared to the fat-referenced method described by Hofstetter et al.19 Using the same water/fat separated baselines as the model-based method, the fat-referenced method accounted for off-resonance using a least squares fit of a spatial polynomial of the same order as the model-based method, weighted by the fat image at each time point and extrapolated across all voxels. All model-based temperature maps were computed with a significant heat threshold of 0.5°C, sparsity regularization parameter of λ = 10−4, and five iterations for each update of the temperature change (ΔT) and off-reso-nance shift coefficients (c). The algorithm stopped when the relative change in the cost function was less than 10−4 between consecutive iterations with a maximum limit of 10 iterations. Algorithm code is available at https://github.com/poormanme/waterFatSeparated_MRThermometry.
3.1 |. Simulations
Simulations were performed to evaluate reconstructed temperature accuracy versus peak temperature, off-resonance field shift amplitude and spatial polynomial order, fat fraction, motion, and the number of heating echoes used for reconstruction. A numerical phantom containing three circular mixed water/fat regions surrounded by a water region was defined at 1.5 Tesla according to the six spectral peak fat model23 and Equation 2 on a 128 × 128 voxel grid with a Gaussian hotspot with σ2 = 10 voxels. This phantom geometry was used for all simulations. Multi-echo images were generated at five echo times (TE = [12.7, 13.8, 15, 16.2, 17.3] ms) with an additional zeroth-order off-resonance field shift of 5 Hz in the heating images. Complex-valued Gaussian noise was added to two copies of the dataset to obtain SNR values of 80 and 20.
In the first simulation, the hotspot was applied over a range of peak temperature changes (0–40 Δ°C, step size of 4°C) in the center of the phantom, placed completely within the mixed voxels (50% fat fraction). Root-mean-square error (RMSE) and maximum temperature errors were evaluated for both thermometry methods with a zeroth-order polynomial and noise levels of SNR ∞, 80, and 20. In the second simulation, the zeroth-order off-resonance field shift was varied between 0 and 100 Hz in steps of 10 Hz with the peak temperature change held fixed at 20°C. This simulation was repeated with the polynomial order increased from zeroth to sixth while maintaining a spatial mean amplitude of 5 Hz to cause spatial variation in the off-resonance shift. The polynomial order used in temperature reconstruction was matched to that used in data generation. In the third simulation, the fat fraction of the phantom’s mixed water/ fat regions was varied between 0 and 100% in steps of 10%, and the peak temperature change was held fixed at 20°C. In the fourth simulation, the 50% fat fraction phantom from the previous simulation was translated in one dimension to simulate bulk phantom motion, producing a baseline library of images at 65 different locations. That baseline library was then uniformly decimated by factors of two, three, and four to generate four libraries with different motion resolutions. Two heating image sets were generated at every location by applying a peak temperature change of 20°C. The hotspot was either fixed in place regardless of simulated motion or tracked to move with the phantom motion in each image. In the fifth simulation, one, three, and five echo images of the 50% fat fraction phantom were used for model-based reconstruction, with a peak temperature change of 0 to 40°C. The one-echo reconstruction used a TE of 17.3 ms, and the three-echo reconstruction used TEs of 15, 16.2, and 17.3 ms.
3.2 |. Ex vivo porcine sonication
An ex vivo porcine muscle sample and bacon slab with fat layers was placed in a dedicated breast MR-guided high intensity focused ultrasound (MRgFUS) system10 (Philips Healthcare, Vantaa, Finland). The system’s breast cup was filled with doped water (manganese (II) chloride tetrahydrate 160 mg/L) for acoustic coupling and a fiber optic thermal probe (Luxtron m3300, LumaSense, Santa Clara, California, USA) was sandwiched between the muscle and bacon fat layer 4 cm from either edge of the phantom for concurrent monitoring. The probe tip was localized with test sonications and T1-weighted images (1.5 Tesla Philips Achieva, Best, Netherlands) prior to heating at the probe tip using a 4.5 × 4.5 × 6 mm3 focal cell sonication at the sample’s water/fat interface. The temperature imaging slice was positioned coronally at the water/fat interface to yield images with a mixture of water and fat. Five multiecho image sets were acquired prior to sonication (TR = 25 ms, TE = 1.3 to 10.6 ms, 6 echoes, voxel size = 2.15 × 2.15 × 4 mm3, 2 averages, BW = 70kHz) and averaged to form a single, high SNR, baseline image that was used for both the fat-referenced and model-based methods. Averaging improved temperature SNR of both methods by reducing baseline phase noise. The focus was heated from room temperature (26°C) at 30 acoustic Watts for 60 s and allowed to cool while imaging with the same sequence (6.4 s per time point). The baseline images were separated into their water and fat components, and temperature maps were computed with a spatial first-order off-resonance shift. The focal temperature for each temperature reconstruction was compared to the fiber optic probe reading to assess accuracy. The model-based reconstructions were repeated with one to five echoes, where in each case the last N echoes was used for reconstruction, i.e., the N = 5-echo case used echoes 2–6 while the N = 3-echo case used echoes 4–6.
3.3 |. In vivo breast
Informed consent was obtained from a healthy female volunteer in accordance with the ethics committee of the University Medical Center Utrecht. The volunteer was scanned on the breast MRgFUS system with no applied heating during free-breathing. Multi-echo images were acquired with no acceleration at two slice orientations for 5 minutes (TR = 25 ms, TE = 1.2–10.6 ms, six echoes, voxel size = 2.15 × 2.15 × 6 mm3, FOV = 27.5 × 27.5 cm, Matrix = 136 × 138, BW = 70 kHz). The first five time points were discarded due to irregular breathing, the next five time points were averaged to form a high-SNR baseline image, and water/fat separation was applied to the baseline. Temperature maps were reconstructed from the remaining time points using second- and first-order fits for off-resonance in the sagittal and coronal orientations, respectively. To evaluate temperature precision in the absence of heating, the model-based algorithm was modified to first solve for the off-resonance shift while the temperature estimate was fixed at zero, then hold the polynomial fit fixed while the algorithm solved for a temperature map with no sparsity regularization (λ = 0) and no non-negativity constraint. In this way, the final temperature map contained all residual errors after fitting the polynomial and baseline images to the data.
3.4 |. In vivo liver
Informed consent was obtained from a healthy female volunteer in accordance with the Vanderbilt University Institutional Review Board policies. To experimentally characterize the method’s robustness to motion, a 16 channel torso coil was used to image the subject’s liver with no acceleration at 3 Tesla (Philips Achieva, Philips Healthcare, Best, Netherlands) for 3.4 minutes in three orientations during free breathing (TR = 25 ms, TE = 0.9 to 11.7 ms, 10 echoes, 3 × 3 × 4 mm3 voxel size, FOV = 28 × 28 cm, Matrix = 92 × 93, bandwidth = 176 kHz). The first five time points were discarded to avoid irregular breathing, the subsequent 10 images formed the baseline library, and water/fat separation was applied to each baseline. The model-based algorithm was modified to evaluate precision in the absence of heating as described above. Temperature maps were reconstructed from the remaining images with a sixth order polynomial off-resonance frequency shift. For the fat-referenced method, the third baseline was used as the baseline reference, which captured the liver at the middle of the respiratory cycle.
4 |. RESULTS
4.1 |. Simulations
Figure 2A displays representative multi-echo images simulated during heating. Figure 2B displays representative temperature maps reconstructed by the fat-referenced and model-based methods. Figure 2C plots RMSE and maximum temperature errors versus peak temperature for SNR = ∞, SNR = 80, and SNR = 20. The fat-referenced reconstruction maintained an average RMSE of 0.12°C for SNR = ∞, 0.13°C for SNR = 80, and 4.83°C for SNR = 20. Fat-referenced error increased with peak heat and became inaccurate as SNR decreased. The model-based reconstruction errors are flat across peak temperature, with an average RMSE of 0.002°C for SNR = o, 0.08°C for SNR = 80, and 0.41 for SNR = 20. The baseline water/ fat separation took 24 s, 37 s, or 114 s to compute and the model-based fitting took 1.1 s, 1.4 s, 1.7 s per heating timepoint, respectively, for SNR = ∞, SNR = 80, and SNR = 20. The model-based method maintained accuracy with less than 1°C error regardless of noise level. In the 0°C peak heat case, the model-based method’s sparsity regularization suppressed the noise, resulting in RMS errors of 0°C.
FIGURE 2.
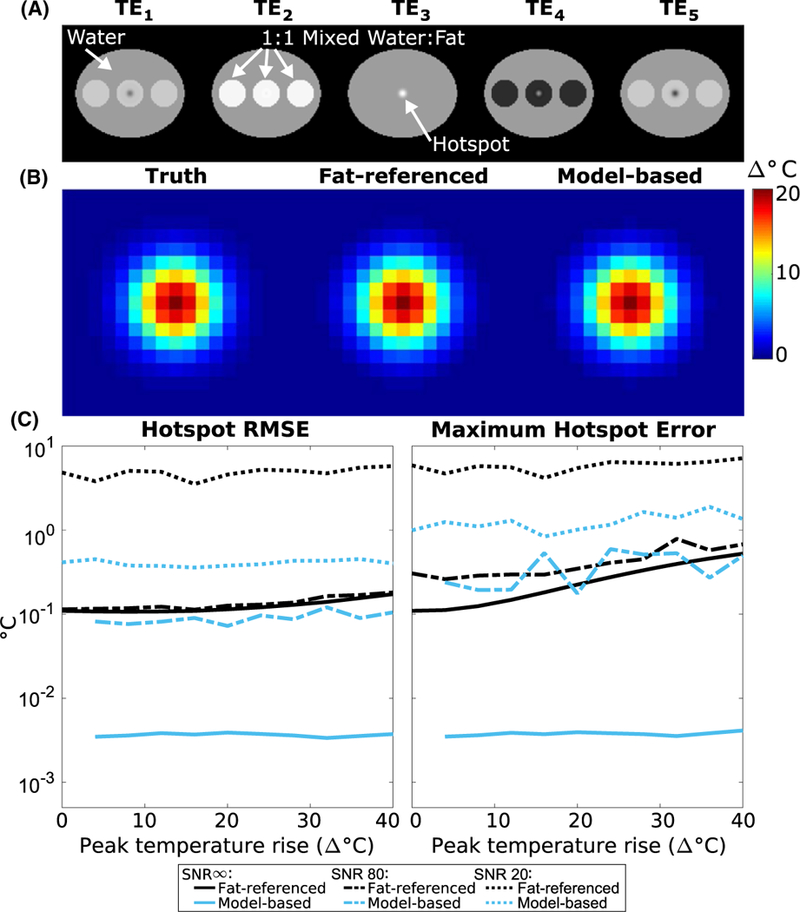
Simulated temperature error versus peak temperature rise. (A) Magnitude images of the simulated water/ fat phantom, which were generated at multiple echo times and peak heating levels. TE3 corresponds to an echo time when the magnitude of the complex water and fat signals in the mixed region have a summed magnitude equal to that of the water only region. (B) Representative temperature maps (zoomed to hotspot) reconstructed with each algorithm, at 20 °C peak heat. C) RMS and maximum error in the reconstructed hotspot for each algorithm with SNR = ∞, SNR = 80, and SNR = 20
Figure 3A displays representative temperature maps reconstructed by each method generated with zeroth-order, 50 Hz off-resonance or third-order, 5 Hz (spatial-average) off-resonance. The fat-referenced maps have errors up to −20°C in voxels with no fat, while the model-based method is accurate regardless of fat distribution. Figure 3B shows error over the entire simulated object for both methods at varied off-resonance shifts and orders. The fat-referenced method’s error increased with both amplitude and order, with an average RMSE of 10.9°C over the range of off-resonance shifts tested and both noise levels. The spikes in fat-referenced error occur when the heating and residual shift phase combine to cause phase wrapping. Across off-resonance orders, the fat-referenced method had an average RMSE of 6.0°C for the SNR = ∞ case and 1.2°C for the SNR = 80 case. The model-based maps were unaffected by changes in off-reso-nance shift strength and order, maintaining an average RMSE of 0.03°C in all cases. Since the fat-referenced method relies solely on fat voxels to estimate a shift, it is unable to account for inhomoneous shifts that occur outside the fatty regions and extrapolate them to the water-based voxels. Additionally, the fat-referenced method assumes that the off-resonance frequency change between the baseline and heating image is small enough that it can be neglected in the multi-echo water-fat signal model (or equivalently, that the phase shifts between echoes due to the off-resonance frequency change are negligible). This approximation allows the B0 map to be calculated once from the baseline images and then held fixed for subsequent heating images. However, this approximation results in erroneous separation of the water and fat signals as the off-resonance change increases. In this case, this approximation resulted in an error in the phase of the fat image and subsequently an error in the off-resonance correction, even at zeroth-order. The model-based method was able to avoid these errors by directly estimating off-resonance from both water and fat and performing water/fat separation only on images without heat.
FIGURE 3.
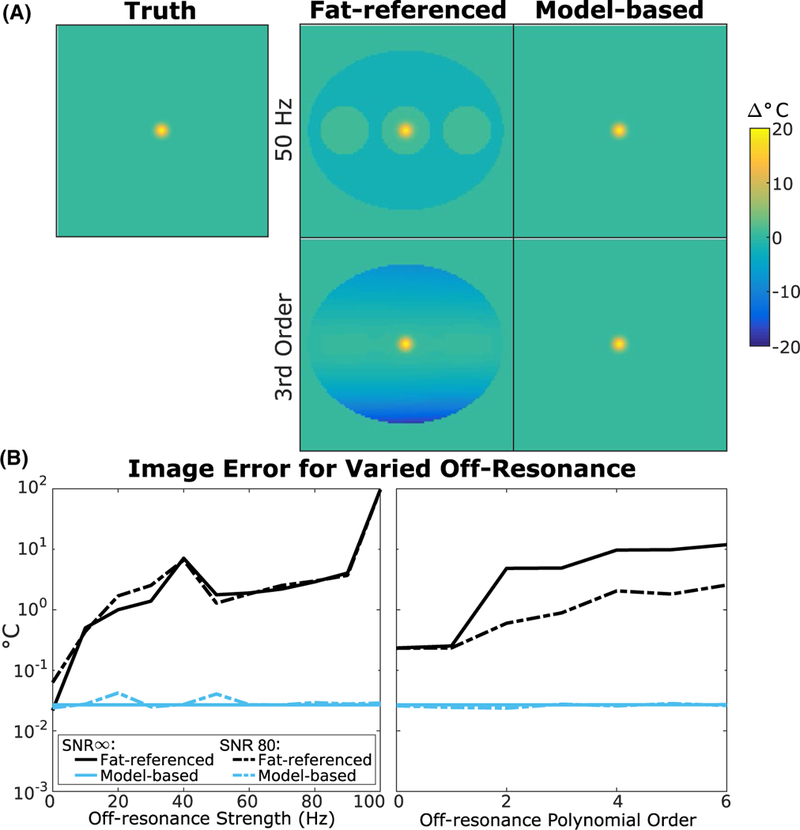
Simulated temperature error over a range of off‐resonance shift amplitudes and orders. (A) Representative temperature maps generated and reconstructed with a zeroth‐order, 50 Hz shift (top) and third‐order, 5 Hz shift (bottom). (B) (left) Whole image RMS error vs zeroth‐order off‐resonance shift strength. (right) Whole image RMS error at different orders of off‐resonance with an average strength of 5 Hz. The fat‐referenced error increases with increasing shift strength and order while the model‐based error remains flat
Figure 4 plots RMS temperature error in the hotspot as a function of fat fraction for the fat-referenced and model-based methods. For fat contents between 10% and 90%, the fat-referenced maps have an average RMSE of 1.16°C and 0.74°C for the SNR = ∞ and SNR = 80 cases respectively. The method fails at 0% fat with RMS errors of 19.01°C (SNR = ∞) and 5.80°(SNR = 80). The model-based maps accurately reconstruct the hotspot with up to 90% fat with an average RMSE of 0.001°C and 0.12°C for SNR = ∞ and SNR = 80, respectively. Both methods fail in 100% fat with RMS errors greater than 8°C since adipose tissue does not exhibit a PRF shift.
FIGURE 4.
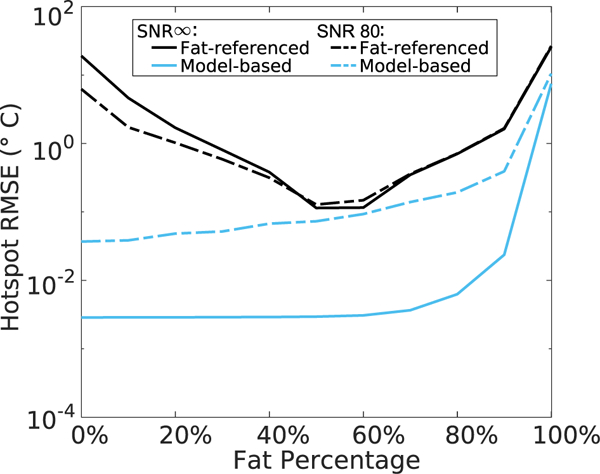
Simulated reconstructed temperature error versus fat fraction, for 20°C peak heat
Figure 5A displays magnitude images of the phantom and hotspot translated across the field of view. Figure 5B plots whole image temperature errors across phantom locations for each baseline library/image position decimation ratio. When there was a baseline image to match every position, the error was consistently 0.03°C, regardless of motion state. This indicates that the algorithm successfully identified the correct baseline in each case. When the library was uniformly decimated, the error increased up to 0.04°C for the positions that did not have a directly matching baseline. Figure 5C shows temperature error maps at the highest decimation factor, at a position where the error was lowest and at a position where the error was highest. In the minimum error image, discrepancies appeared at the edges of the hotspot due to the significant heat threshold applied. In the maximum error image, the phantom was located midway between two baseline locations and interpolation errors occurred at the interface of the pure water and mixed regions. The maximum error remained less than 0.52°C.
FIGURE 5.
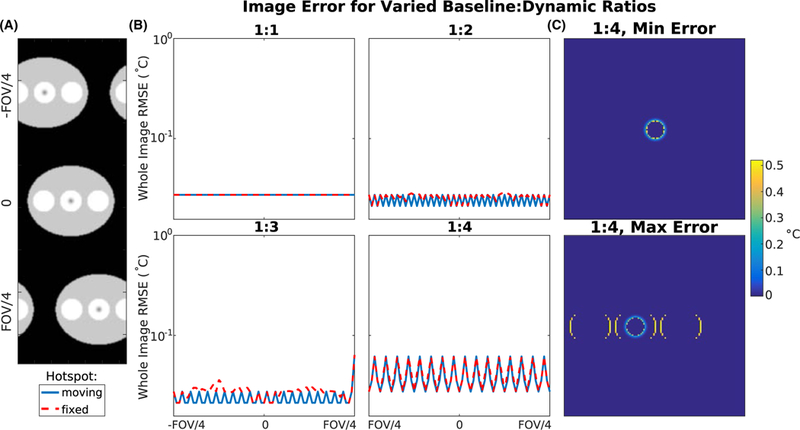
Motion simulation results. (A) Magnitude images of the simulated phantom, translated across the field of view, with the hotspot moving with the phantom motion. (B) Whole-image temperature error for each baseline position to heating image position ratio. (C) Temperature maps with a 1:4 baseline:heating image ratio at positions where the error is lowest and highest
Figure 6A shows temperature maps reconstructed using 1, 3, and 5 echoes, zoomed to the hotspot. For SNR = ∞, the algorithm achieved an average hotspot RMSE of 0.002°C, 0.001°C, and 0.002°C for the 1, 3, and all-5-echo cases, computed in 0.26 s, 0.59 s, and 1.10 s per temperature map, respectively. For SNR = 80, the average hotspot RMSE was 0.14°C, 0.11°C, and 0.08°C for the 1, 3, and all-5-echo cases, computed in 0.42 s, 0.86 s, and 1.40 s per temperature map, respectively. Errors were unaffected by the peak temperature but increased as the number of echoes decreased in the noisy case due to reduced signal averaging across echoes. The error differences between the infinite SNR curves are likely due to the 5-echo case reaching the stopping criterion with fewer iterations than the 1- and 3-echo cases. The error differences are on the order of 0.001°C and can be neglected.
FIGURE 6.
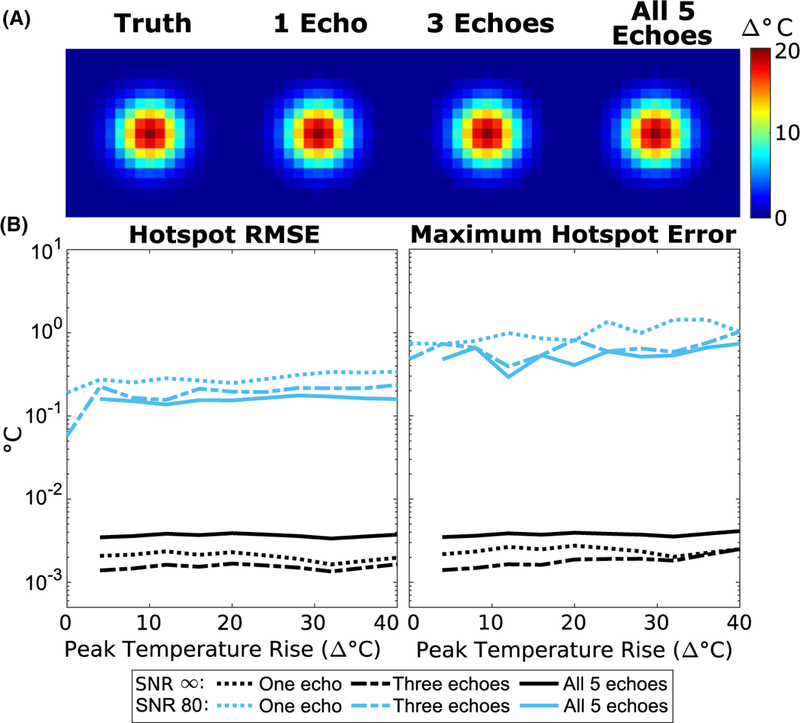
Simulated temperature error with a small number of echoes. (A) Temperature maps (zoomed to hotspot) reconstructed with the model-based method using different numbers of echoes, at 20°C peak heat. (B) RMS and maximum error in the hotspot for each case
4.2 |. Ex vivo porcine sonication
The experimental setup is shown in Figure 7A. Figure 7B shows the fat fraction map computed from baseline images at the slice plane indicated, which had a 2 minute computation time. The ROI containing the fiber optic probe tip was used to compute the mean hotspot temperature and is indicated by the blue circle (mean fat fraction of 25%). The red and green circles represent ROIs used to examine temperature at points containing more and less fat than the acoustic focus, 61% and 9%, respectively. Figure 7C shows temperature maps reconstructed from the fat-referenced and model-based methods 15 s after sonication, and the fat-referenced map has lower heat. Temperature curves at each of the ROIs are plotted in Figure 7D along with the fiber optic probe measurements. During heating, the fiber optic probe temperature (black line) was influenced by mechanical perturbation and heating of the probe itself. The mean focal temperature reconstructed with the model-based method is accurate with respect to the fiber optic probe during the cooling period with an average RMSE of 0.66°C and had an absolute error of 0.33°C 15 s after sonication. The fat-referenced method produced an average RMSE of 0.96°C during cooling and an absolute error of 2.21°C 15 s after sonication. Further differences between the two methods can be seen in the ROIs containing 61% fat (red) and 9% fat (green). The model-based algorithm reconstruction took 0.47 s to compute each temperature map.
FIGURE 7.
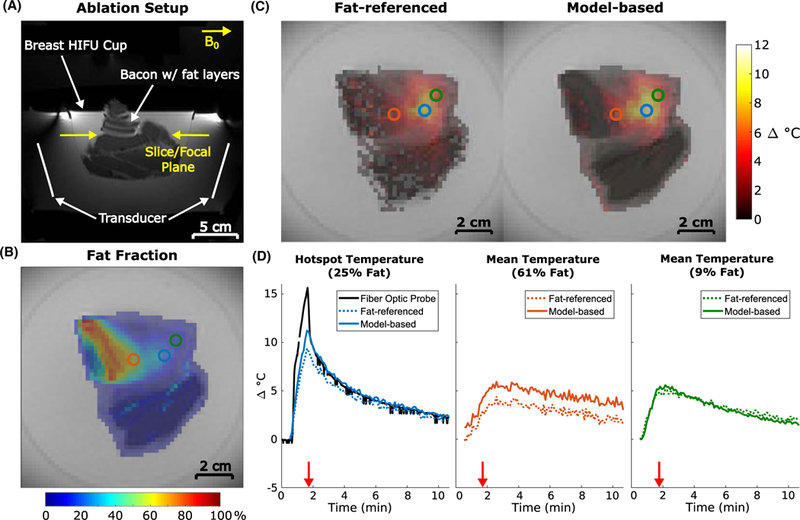
Ex vivo pork sonication with simultaneous fiber optic temperature monitoring. (A) Survey image showing experimental setup. (B) Computed fraction map with circles indicating ROIs used for temperature analysis. (C) Reconstructed temperature maps 15 s after sonication (red arrows in (D)). Voxels with temperature values equal to 0 were set to transparent. (D) Temperature plots for each method at the locations indicated by the corresponding ROIs in (B). Fiber optic probe readings during sonication (0.5–1.5 minutes) can be disregarded due to perturbation by the focused ultrasound beam
Figure 8A shows temperature maps reconstructed with one to all six echoes 15 s after sonication. Reducing the number of echoes qualitatively increased noise in the temperature maps due to reduced averaging, but did not change the shape or amplitude of the hotspot. The through-time error plot in Figure 8B further supports this interpretation, since the error increased as the number of echoes decreased but did not strongly correlate to peak temperature. Computation time per temperature map decreased as the number of echoes decreased, with the one, three, and all-six-echo maps requiring 0.10 s, 0.20 s, and 0.47 s respectively.
FIGURE 8.
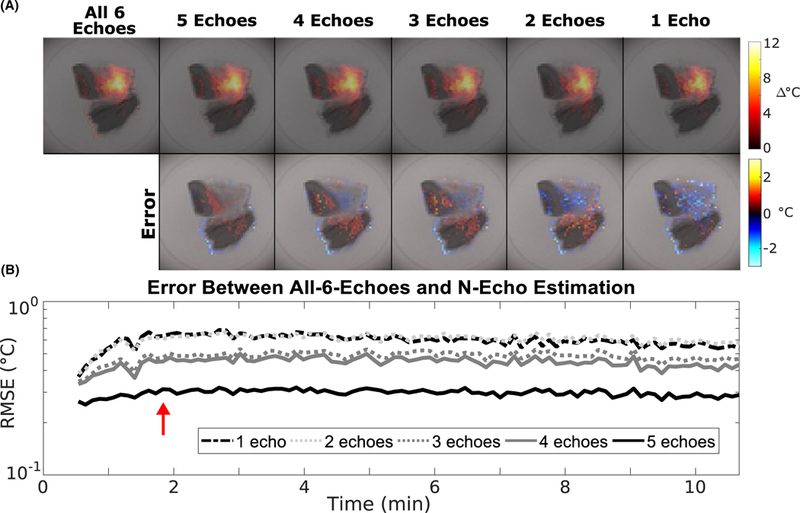
Ex vivo pork sonication temperature maps reconstructed with a smaller number of echoes. (A) Temperature maps acquired 15 s after sonication (red arrow) reconstructed using the model-based method using 1 to all 6 echoes. Voxels with temperature values equal to 0 were set to transparent. (B) RMSE between the 6-echo and reduced-echo maps
4.3 |. In vivo breast
Figure 9A shows the fat fraction map computed from the multi-echo images taken at the slice plane indicated, which required 60 s of computation per slice direction. Through-time average temperature and temperature standard deviation maps of both the fat-referenced and model-based reconstructions are shown in Figure 9B. Voxels containing less than 90% fat exhibited an average temperature of −1.8°C in the fat-referenced maps, and −0.12°C in the model-based maps. The mean fat-referenced temperature map contains a large temperature gradient (white arrow) due to the inability of the fat-referenced method to accurately extrapolate high-order off-resonance to areas of low fat content. This gradient is corrected by the referenceless component of the model-based method. Voxels containing greater than 90% fat have temperature errors greater than ±10°C in both methods due to the much smaller PRF shift of fat than that of water. Throughtime standard deviations were less than 1°C for both temperature reconstructions, demonstrating precision and stability over the entire time course. The coronal fat-referenced and model-based maps (Supporting Information Figure S1) had average temperatures of −1.0°C and 0.07°C respectively, with less than 1°C standard deviation over time. Individual temperature maps for each slice orientation and time point are shown in Supporting Information Figure S2, and do not contain appreciable oscillations over time due to respiration or cardiac motion.
FIGURE 9.
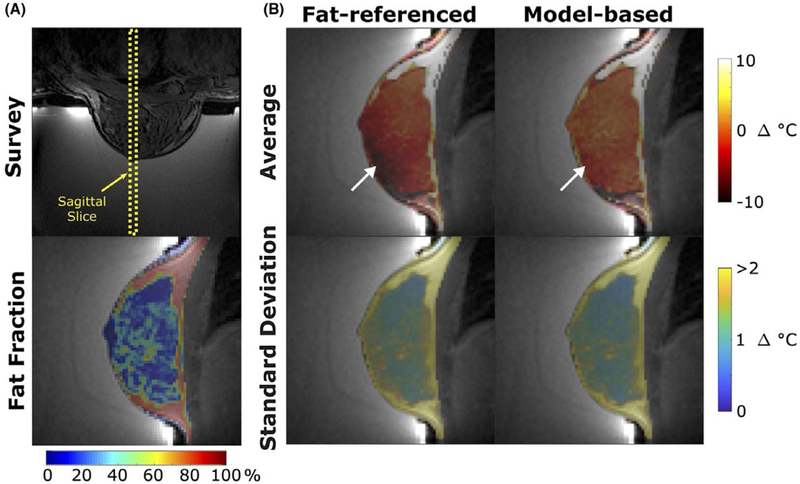
In vivo human breast temperature mapping without heating. (A) (top) Survey image and (bottom) fat fraction map of a sagittal slice through breast. (B) Through-time mean temperature and standard deviation maps reconstructed with the fat-referenced and model-based methods. The white arrow indicates an area of error due to the inability of the fat-referenced method to accurately extrapolate high-order off-resonance to areas of low fat content. Voxels outside of the breast were set to transparent
4.4 |. In vivo liver
Figure 10 shows temperature maps of the unheated liver during free breathing computed with the fat-referenced and model-based methods. The fat-referenced reconstruction had an absolute maximum error of 36.7°C and an average error of −0.61°C. The model-based method had an absolute maximum error of 23.6°C and an average error of 0.27°C. The fat-referenced method was unable to compensate for motion, with 27% of in-liver voxels containing errors greater than ±10°C on average, dependent on how closely the time point’s motion state matched the single baseline. The model-based method was able to compensate for motion with 5% of in-liver voxels containing greater than ±10°C on average. Errors in the model-based method occurred along the interface of the liver with the heart and intestines while the fat-referenced errors occurred throughout the liver. Additional slices through the liver (Supporting Information Figure S3) exhibit the same trend, where the model-based maps have low temperature error regardless of inplane or through-plane motion. In all cases, no motion artifacts were observed in the liver in the acquired images.
FIGURE 10.
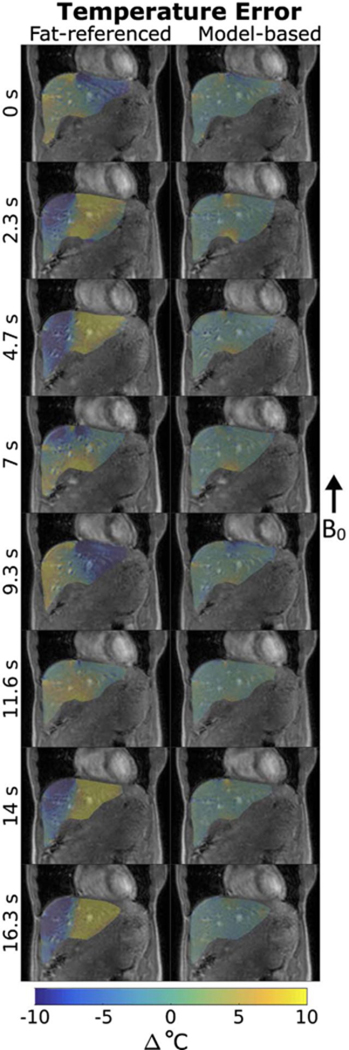
Comparison of temperature errors in a sagittal liver slice of a free-breathing volunteer. (left) The fat-referenced temperature maps at each time point had temperature errors greater than 10°C. (right) Model-based temperature maps at each time point with low error throughout the liver. Larger errors appear near intestinal walls due to unpredictable motion. Voxels outside of the liver were set to transparent
5 |. DISCUSSION
5.1 |. Summary of results
We described and validated a new signal model and temperature reconstruction for PRF-shift hybrid multibaseline refer- enceless MR thermometry in aqueous and mixed water/fat tissues. The signal model combines state-of-the-art, iterative water/fat separation with a motion- and off-resonance shift-robust penalized-likelihood temperature reconstruction to achieve accurate and precise water/fat-separated thermometry with short compute times. The algorithm achieved lower temperature error in mixed fatty tissues compared to conventional methods, particularly in cases where dynamic off-resonance shifts were large or rapidly varying across the image. The algorithm’s multibaseline functionality was able to account for cyclical respiratory motion using a library of baseline water and fat images. The algorithm performed accurately up to 90% fat, even in tissue where no fat was present. Its ability to incorporate water voxels in both the heating and off-resonance shift fitting makes the approach widely useful compared to the fat-referenced algorithm, which estimates off-resonance shifts from fat only and must extrapolate shifts to voxels without fat. Simulations on a numerical water/fat phantom showed low temperature errors across temperature levels and fat fractions, and demonstrated robustness to large or high order off-resonance shifts and motion, scenarios where the fat-referenced method fails. This accuracy was confirmed in a porcine MRgFUS ablation experiment where the model-based method computed temperature maps in 0.47 s per time point with an RMS error of 0.66°C. The algorithm was precise in vivo in a free-breathing volunteer and capable of correcting non-uniform off-resonance shifts regardless of fat distribution. Motion-compensation was confirmed in a free-breathing liver, achieving negligible error where the fat-referenced method contained errors of 10°C or more. These results are consistent with Ref. 4, which demonstrated liver errors smaller than 1°C with the hybrid referenceless multibaseline method.
5.2 |. Water/fat separated thermometry with few echoes
Multiple gradient echo images are required to obtain accurate water/fat separations of baseline images, but subsequent heating images theoretically only require a single echo to fit the model and estimate temperature while maintaining fat suppression. In practice, the noise of the resulting temperature map increased as the number of echoes used decreases, but results from the simulations and MRgFUS heating experiment showed that accuracy remained comparable to that of the full echo case. Reducing the number of echoes acquired during heating presents an opportunity to use the freed-up sequence time for various applications. One possibility is to add gradient pulses between the excitation and echo time to enable acoustic radiation force measurements24 simultaneously with water/fat separated thermometry. Sequence time could also be used for scan acceleration using PRESTO echo shifting 25,26 or echo planar readouts.27 Using less echoes also reduces the computation time required for the algorithm to generate temperature maps, making this implementation compatible with accelerated imaging methods.
5.3 |. Limitations and future work
One recognized limitation of the method is the potential for changes in fat susceptibility with heating28 to introduce localized off-resonance that may not be accurately modeled by a low order polynomial. This is a problem common to most PRF thermometry methods, and the magnitude of the effect depends on the heating geometry and intensity, and slice orientation. Depending on the application and orientation the apparent temperature error due to susceptibility could be negligible, such as during feedback controlled hyperthermia. For ablative applications where the expected temperature rise is greater than 20°C, the expected error due to susceptibility could be a confound depending on target size, however, in these applications the main goal is tissue necrosis rather than sustaining an exact temperature rise. Additionally, the algorithm could become inaccurate when motion occurs that is not fully represented by the baseline library. In practice, such errors could be mitigated through use of navigator echoes or image registration, as the referenceless polynomial regression would compensate for smooth phase differences between the baseline image and registered motion state.
In the original hybrid method (Ref. 4) the l1 norm was the only feature that prevented the phase shift due to heating from being misinterpreted as a change in off-resonance due to scanner drift or respiration. When the area of heating was no longer sparse with respect to the image size, such as during near-field heating and hyperthermic therapies, the l1 sparsity regularization could no longer separate these two effects, leading to erroneous temperature maps and a sensitivity to the choice of sparsity regularization parameter λ In the model-based method discussed here, the fat serves as an additional reference and aids the sparsity regularization in separating the frequency shift due to heating from that of off-resonance. However, for large hotspots where the majority of heating lies outside voxels containing fat, the spatial polynomial off-resonance fit may become confused with the off-resonance due to heating. This scenario was explored for an example fat distribution in Supporting Information Figure S4. These results suggest that the model-based method could perform accurately for a range of hotspot sizes but may require tuning of lambda for diffuse heating scenarios. Tuning could be performed prior to treatment in simulation, as suggested in Ref. 4.
Since the algorithm relies on an underlying water PRF-shift, voxels containing greater than 90% fat will contain erroneous temperature information. For most therapeutic cancer applications, the tumor has a strong water signal and the algorithm would perform adequately even when the tumor is mixed with surrounding fatty tissues. Erroneous voxels are straightforward to mask out with the computed fat fraction maps, but doing so would prevent near-field monitoring of intervening fat tissues. The few-echo embodiment of the algorithm could allow for added pulses and readouts for fat temperature-sensitive contrast mechanisms.29
Finally, the algorithm does not account for changes in with temperature. Addition of this effect could enable joint temperature mapping, given a characterization of dependence on temperature for a specific tissue, and is a topic for future work.
6 |. CONCLUSIONS
We demonstrated a model-based multi-echo water/fat separated approach for PRF-shift temperature mapping in fatty tissues. The algorithm leverages hybrid multibaseline referenceless thermometry approaches and state-of-the-art, iterative water/fat separation techniques in a penalized likelihood optimization scheme to account for the fat signal in mixed tissues. The method was proven accurate and precise with online-compatible compute times, irrespective of fat content up to 90% fat, tissue motion, large and spatially-varying off-resonance shift, or number of echoes. It was validated in simulations, phantom heating experiments, and in vivo breast and liver experiments and could be critically useful in monitoring ablative therapies in fatty tissues such as breast or liver.
Supplementary Material
In vivo human breast temperature mapping without heating. (A) (top) Survey image and (bottom) fat fraction map of a coronal slice through breast. (B) Through-time mean temperature and standard deviation maps reconstructed with the fat-referenced and model- based methods
Through-time temperature error comparison in the breast at both orientations. (A) Survey images showing slice orientations. (B) Fat fraction maps at both slice orientations. (C) Temperature maps at subsequent time points in the sagittal (top) and coronal (bottom) orientations. There is no appreciable oscillation in temperature due to respiration or cardiac cycle for either method
Comparison of temperature errors in multiple slice orientations in the liver of a free-breathing volunteer. The fat-referenced method is unable to account for motion in any orientation. In all cases, the model-based method comp’ensates for organ motion as captured by the pre-com-puted baseline library
Sensitivity to sparsity regularization and hotspot size simulation. (A) Range of hotspot sizes explored (yellow dotted line) compared to the phantom size with 50% fat content distribution. (B) Hotspot RMS and maximum error for each hotspot size over a range of regularization values (λ). The algorithm is insensitive to values of λ < 10−2 until hotspot size increases to σ ≥ 26. (C) RMSE versus λ for the smallest hotspot shows an optimal choice of to be 10−4 ≤ λ ≤ 10−3
ACKNOWLEDGMENT
The authors would like to thank Charles Mougenot, Clemens Bos, and Roel Deckers for their experimental support. This work was supported by DoD W81XWH-13–1-0230, NIH T32EB021937, a Vanderbilt University Central Discovery Grant, and a Whitaker International Program Summer Grant.
Footnotes
SUPPORTING INFORMATION
Additional supporting information may be found online in the Supporting Information section at the end of the article.
REFERENCES
- 1.Rieke V, Butts Pauly K. MR thermometry. J Magn Reson Imaging. 2008;27:376–390. [DOI] [PMC free article] [PubMed] [Google Scholar]
- 2.Vigen KK, Daniel BL, Pauly JM, Butts K. Triggered, navigated, multi-baseline method for proton resonance frequency temperature mapping with respiratory motion. Magn Reson Med. 2003;50:1003–1010. [DOI] [PubMed] [Google Scholar]
- 3.Rieke V, Vigen KK, Sommer G, Daniel BL, Pauly JM, Butts K. Referenceless PRF shift thermometry. Magn Reson Med. 2004;51:1223–1231. [DOI] [PubMed] [Google Scholar]
- 4.Grissom WA, Rieke V, Holbrook AB, et al. Hybrid refer-enceless and multibaseline subtraction MR thermometry for monitoring thermal therapies in moving organs. Med Phys. 2010;37:5014–5026. [DOI] [PMC free article] [PubMed] [Google Scholar]
- 5.Roujol S, Ries M, Quesson B, Moonen C, Denis de Senneville B. Real-time MR-thermometry and dosimetry for interventional guidance on abdominal organs. Magn Reson Med. 2010;63:1080–1087. [DOI] [PubMed] [Google Scholar]
- 6.Wyatt CR, Soher BJ, MacFall JR. Correction of breathing-induced errors in magnetic resonance thermometry of hyperthermia using multiecho field fitting techniques Med Phys. 2010;37:6300–6309. [DOI] [PMC free article] [PubMed] [Google Scholar]
- 7.Gaur P, Partanen A, Werner B, et al. Correcting heat-induced chemical shift distortions in proton resonance frequency-shift thermometry. Magn Reson Med. 2016;76:172–182. [DOI] [PMC free article] [PubMed] [Google Scholar]
- 8.Svedin BT, Payne A, Parker DL. Respiration artifact correction in three-dimensional proton resonance frequency MR thermometry using phase navigators. Magn Reson Med. 2016;76:206–213. [DOI] [PMC free article] [PubMed] [Google Scholar]
- 9.Stollberger R, Ascher PW, Huber D, Renhart W, Radner H, Ebner F. Temperature monitoring of interstitial thermal tissue coagulation using MR phase images. J Magn Reson Imaging. 1997;8:188–196. [DOI] [PubMed] [Google Scholar]
- 10.Deckers R, Merckel L, Denis de Senneville B, et al. Performance analysis of a dedicated breast MR-HIFU system for tumor ablation in breast cancer patients. Phys Med Biol. 2015;60:5527–5542. [DOI] [PubMed] [Google Scholar]
- 11.Meyer CH, Pauly JM, Macovski A, Nishimura DG. Simultaneous spatial and spectral selective excitation. Magn Reson Med. 1990;15:287–304. [DOI] [PubMed] [Google Scholar]
- 12.Grissom WA, Kerr AB, Holbrook AB, Pauly JM, Butts-Pauly K. Maximum linear-phase spectral-spatial radiofrequency pulses for fat-suppressed proton resonance frequency-shift MR Thermometry. Magn Reson Med. 2009;62:1242–1250. [DOI] [PMC free article] [PubMed] [Google Scholar]
- 13.Hernando D, Kellman P, Haldar J, Liang Z. Robust water/fat separation in the presence of large field inhomogeneities using a graph cut algorithm. Magn Reson Med. 2010;63:79–90. [DOI] [PMC free article] [PubMed] [Google Scholar]
- 14.Berglund J, Kullberg J. Three-dimensional water/fat separation and estimation based on whole-image optimization-appli- cation in breathhold liver imaging at 1.5 T. Magn Reson Med. 2012;67:1684–1693. [DOI] [PubMed] [Google Scholar]
- 15.Hu HH, Börnert P, Hernando D, et al. ISMRM workshop on fat-water separation: insights, applications and progress in MRI. Magn Reson Med. 2012;68:378–388. [DOI] [PMC free article] [PubMed] [Google Scholar]
- 16.Taylor BA, Hwang KP, Elliott AM, Shetty A, Hazle JD, Stafford RJ. Dynamic chemical shift imaging for image-guided thermal therapy: analysis of feasibility and potential. Med Phys. 2008;35:793–803. [DOI] [PubMed] [Google Scholar]
- 17.Welch EB, Gifford A, Towse TF. Phantom validation of temperature mapping using fat-water MRI with explicit fitting of water peak location. In Proceedings of the 22nd Anual Meeting of ISMRM, Milan, Italy 2014;3673. [Google Scholar]
- 18.Soher BJ, Wyatt C, Reeder SB, MacFall JR. Noninvasive temperature mapping with MRI using chemical shift water-fat separation. Magn Reson Med. 2010;63:1238–1246. [DOI] [PMC free article] [PubMed] [Google Scholar]
- 19.Hofstetter LW, Yeo DTB, Dixon WT, Kempf JG, Davis CE, Foo TK. Fat-referenced MR thermometry in the breast and prostate using IDEAL. J Magn Reson Imaging 2012;36:722–732. [DOI] [PubMed] [Google Scholar]
- 20.Svedin BT, Payne A, Bolster BD, Parker DL. Multiecho pseudogolden angle stack of stars thermometry with high spatial and temporal resolution using k-space weighted image contrast. Magn ResonMed. 2018;79:1407–1419. [DOI] [PMC free article] [PubMed] [Google Scholar]
- 21.Reeder SB, Wen Z, Yu H, et al. Multicoil Dixon chemical species separation with an iterative least-squares estimation method. Magn Reson Med. 2004;51:35–45. [DOI] [PubMed] [Google Scholar]
- 22.Hernando D, Liang Z, Kellman P. Chemical shift-based water/fat separation: a comparison of signal models Magn Reson Med. 2010;64:811–822. [DOI] [PMC free article] [PubMed] [Google Scholar]
- 23.Hernando D, Hines CDG, Yu H, Reeder SB. Addressing phase errors in fat-water imaging using a mixed magnitude/complex fitting method. Magn Reson Med. 2012;67:638–644. [DOI] [PMC free article] [PubMed] [Google Scholar]
- 24.Auboiroux V, Viallon M, Roland J, et al. ARFI-prepared MRgHIFU in liver: simultaneous mapping of ARFI-displacement and temperature elevation, using a fast GRE-EPI sequence. Magn Reson Med. 2012;68:932–946. [DOI] [PubMed] [Google Scholar]
- 25.De Zwart JA, Vimeux FC, Delalande C, Canioni P, Moonen CTW. Fast lipid-suppressed MR temperature mapping with echo-shifted gradient- echo imaging and spectral-spatial excitation. Magn Reson Med. 1999;42:53–59. [DOI] [PubMed] [Google Scholar]
- 26.De Zwart JA, Vimeux FC, Palussire J, et al. On-line correction and visualization of motion during MRI-controlled hyperthermia. Magn Reson Med. 2001;45:128–137. [DOI] [PubMed] [Google Scholar]
- 27.Stafford RJ, Price RE, Diederich CJ, Kangasniemi M, Olsson LE, Hazle JD. Interleaved echo-planar imaging for fast multiplanar magnetic resonance temperature imaging of ultrasound thermal ablation therapy. J Magn Reson Imaging. 2004;20:706–714. [DOI] [PubMed] [Google Scholar]
- 28.Sprinkhuizen SM, Konings MK, Van Der Bom MJViergever MA, Bakker CJG, Bartels LW. Temperature-induced tissue susceptibility changes lead to significant temperature errors in PRFS-based MR thermometry during thermal interventions. Magn Reson Med. 2010;64:1360–1372. [DOI] [PubMed] [Google Scholar]
- 29.Todd N, Diakite M, Payne A, Parker DL. Hybrid proton resonance frequency/T1 technique for simultaneous temperature monitoring in adipose and aqueous tissues. Magn Reson Med. 2013;69:62–70. [DOI] [PMC free article] [PubMed] [Google Scholar]
Associated Data
This section collects any data citations, data availability statements, or supplementary materials included in this article.
Supplementary Materials
In vivo human breast temperature mapping without heating. (A) (top) Survey image and (bottom) fat fraction map of a coronal slice through breast. (B) Through-time mean temperature and standard deviation maps reconstructed with the fat-referenced and model- based methods
Through-time temperature error comparison in the breast at both orientations. (A) Survey images showing slice orientations. (B) Fat fraction maps at both slice orientations. (C) Temperature maps at subsequent time points in the sagittal (top) and coronal (bottom) orientations. There is no appreciable oscillation in temperature due to respiration or cardiac cycle for either method
Comparison of temperature errors in multiple slice orientations in the liver of a free-breathing volunteer. The fat-referenced method is unable to account for motion in any orientation. In all cases, the model-based method comp’ensates for organ motion as captured by the pre-com-puted baseline library
Sensitivity to sparsity regularization and hotspot size simulation. (A) Range of hotspot sizes explored (yellow dotted line) compared to the phantom size with 50% fat content distribution. (B) Hotspot RMS and maximum error for each hotspot size over a range of regularization values (λ). The algorithm is insensitive to values of λ < 10−2 until hotspot size increases to σ ≥ 26. (C) RMSE versus λ for the smallest hotspot shows an optimal choice of to be 10−4 ≤ λ ≤ 10−3