

Abstract
Background.
Comparing the costs and health value associated with alternative quality improvement efforts is useful. This study employs expert panel methodology to elicit numerical estimates based on a 0 to 1 utility scale of the health benefit of usual treatment patterns for 2 medical conditions.
Method.
The approach includes development of clinical profiles and derivation of treatment benefit estimates via the elicitation of utility ratings before and after treatment. Clinical profiles specified characteristics of patient groups, treatments to be rated, and their combinations. A panel of 13 asthma and depression experts made a series of utility ratings (before any new treatment, 1 or 3 mo later with no treatment, 1 or 3 mo after initiating various common treatments) for adult patient groups with depression or asthma. The panel convened to discuss discrepancies and subsequently made final ratings. Treatment benefit estimates were derived from the ratings made by the panelists after the panel meeting.
Results.
The treatment benefit estimates had face validity and minimal variability, indicating considerable consensus among experts. Treatment benefit estimates ranged from –0.03 to 0.25 for depression and from –0.04 to 0.24 for asthma. There was minimal variation in the estimates for both conditions (the estimates’ standard deviations ranged from 0.01 to 0.06). Comparisons of the treatment benefit estimates before and after the expert panel meeting indicated substantial convergence, and evidence suggests that the benefit estimates are comparable across the 2 health conditions.
Conclusion.
Comparable estimates of treatment benefit for distinct health conditions can be obtained from experts using the expert panel methodology.
Keywords: expert panel, consensus panel, health value, treatment benefit, depression, asthma
The quality of usual health care in the United States often fails to meet standards of guideline-recommended practice.1,2 Given limited resources, health providers and managers must decide how to prioritize quality improvement efforts. To inform such decisions, it would be useful to be able to compare the costs and the health value improvements associated with alternative quality improvement efforts. Health value in this context refers to the effects of an intervention on the quantity and quality of life. Whereas costs are relatively straightforward to calculate and are comparable across conditions and treatments because of the common metric ($), establishing a common metric for the impact of quality improvement efforts on health is a considerable methodological challenge.
One set of approaches to measuring the value of health care is found in the cost-effectiveness literature, where the concept of health utility is well accepted.3 From this perspective, the health value of an intervention can be represented as the change in the utilities or preferences for health states attributable to the intervention. The concept of utility is most often operationalized as a value on a scale ranging from 0 (death) to 1 (perfect health). For example, quality-adjusted life years3 and healthy-year equivalents4–6 are 2 common metrics that incorporate the concept of utility using the utility estimate as a basis for valuing treatments in cost-effectiveness analysis.
The utility concept and measurement approach has several advantages, including its strong theoretical basis and the existence of extensive research on various methods to elicit and measure preferences for health states. The methodologic literature has shown that utility estimates for health states vary as a function of both the elicitation method (standard gamble, time tradeoff, rating scale) and the type of sample providing utility judgments (patients, family caregivers, physicians), fueling ongoing scientific debate about which method is best.7–9,10 In addition, there is a lack of consensus as to whether estimates based on the rating scale method actually constitute utilities (because this elicitation approach does not require a tradeoff or a gamble).
A major drawback to the utility approach, regardless of the elicitation method or type of sample surveyed, is that the methods for estimating utilities associated with various health states are time and resource intensive. It is not practical to employ these methods to estimate the utilities associated with the broad range of practice patterns and types of patients found in usual health care settings. As a result, there is limited information about utilities of health states in the literature and even less about the changes in utilities attributable to health interventions.11
Some research has focused on using statistical approaches to characterize the relationship between utility scores obtained from instruments such as the EuroQol and the Quality of Well-being and quality-of-life survey instruments such as the SF-36.12,13 This allows for the linking of utilities to a large number of health states, even when utilities are not directly assessed. However, an additional step is required to attribute utilities to health states for specific health conditions before and after treatment. In practice, this step has seldom been taken because many common treatments are not studied in published randomized controlled trials, so information about health status before and after these treatments is not available.
An alternative approach to assessing the value of health interventions is to employ expert panel methodology. Whereas expert panels have been used to obtain category judgments of appropriateness of care, this study is the first to use an expert panel to generate utility ratings that can be used to estimate the benefit of usual care treatment practices. In the expert panel approach, experts are convened specifically for the purpose of making judgments and refining them based on discussion. The panelists tend to be more sophisticated than patient or physician groups who typically make utility ratings, and they are invested in the process and willing to put considerable effort into their judgments.
One of the more established and structured means of obtaining expert opinion is to use the expert consensus panel methodology or nominal group/Delphi approach.14–16 This approach is the basis for the RAND-UCLA appropriateness method,17,18 which has been applied to numerous health conditions and interventions.19–22 In this approach, experts are asked to make judgments about whether specific patterns of care for specific types of patients fall into 1 of 3 categories: appropriate (expected health benefit outweighs expected health risk), insufficient (failure to provide indicated appropriate care), or unnecessary (expected health benefit does not outweigh the expected health risk). The RAND-UCLA method selects panelists who are research practitioner experts, provides summaries of the relevant scientific evidence regarding treatment efficacy and effectiveness, and elicits judgments from individual panelists before and after engaging in group discussion that facilitates agreement across experts.
An advantage of the RAND-UCLA expert panel method is that it is a relatively efficient way to obtain categorical ratings of appropriate, insufficient, or unnecessary care for a broad range of health interventions and types of patients. Ratings can therefore be applied to information abstracted from large samples of medical records, so that patterns of usual care can be evaluated in populations, including members of health plans, hospital patients, and community residents. The appropriateness method generates categorical ratings; rating the average expected magnitude of health benefit for specific patient groups requires an extension of this approach that generates interval scale estimates of benefit on a bounded continuous scale. This extension is necessary to enable comparisons across different levels of appropriate care. To date, only 1 study has used expert panelists to quantify the average expected magnitude of benefit associated with an appropriate health intervention.23 However, that study used a disorder-specific rating scale rather than one that could be applied across medical conditions.
The purpose of the study we describe in this article was to employ expert panel methodology to produce interval scale estimates of the average benefit of usual patterns of treatment for 2 medical conditions: adult major depression and asthma. We use the 0 to 1 utility scale to establish a common metric, and although the rating scale method does not produce utility estimates under the strictest definition (as with gamble and time tradeoff methods), we used this method to minimize the complexity of the task for the expert panelists. Both depression and asthma were chosen because they are common and have published practice guidelines. In addition, both conditions have symptoms when untreated, treatments that target symptoms, and treatment technologies that are not rapidly changing.
METHOD
The approach we developed to produce interval scale estimates of average treatment benefit involved 2 discrete steps. First, we developed a set of clinical profiles that specified critical information about both patient groups and treatments. The 2nd step consisted of obtaining experts’ estimates of average treatment benefit for the specified patient groups, which involved eliciting average utility ratings for patient groups before and after treatment initiation. The details of these 2 steps are described further below.
Development of Clinical Profiles
The purpose of the clinical profile is to summarize the critical information about both the patient groups and the treatments to be rated; thus, it must include anything that would affect either the average baseline utility value, which can vary according to general patient characteristics, or the potential average benefit of a particular treatment, which can vary according to patient characteristics, treatments, and their interactions. The clinical profiles, then, must specify the appropriate combinations of patient characteristics and treatments and recognize that all treatments are not clinically relevant for all patients.
Patient groups.
With respect to the patient groups that are hypothetically receiving treatment, several characteristics (e.g., age, gender, comorbidity, severity of illness) could potentially affect average baseline utility levels and response to treatment. To ensure the incorporation of all necessary patient characteristics into the clinical profiles, we conducted a literature review to identify those characteristics most likely to affect the average benefit of treatments for depression and asthma. Articles were obtained by conducting MEDLINE and PsyclNFO computerized searches of the English-language literature from 1993 through early 2003, supplemented with searches of the Cochrane Database of Systematic Reviews. Key words included adult depression, dysthymia, asthma PLUS QOL, quality of life, utility, functioning, functional status, and functional outcomes. The literature review suggested that for depression, treatment benefit can be assumed to be relatively stable for patients aged 18 to 55 y regardless of gender.24–27 Similarly, there is no clinical evidence that asthma treatment benefit varies within this age range or according to gender. The literature also indicated that depression treatment benefit might be affected by the presence of a medical or alcohol dependence comorbidity28, 29 and that smoking status might influence asthma treatment benefit.30,31
We also used the available literature to identify meaningful gradations in illness severity and chronicity to further specify patient groups. For depression, we crossed 3 levels of severity (mild, moderate, severe) with 2 levels of chronicity (acute, chronic) as defined by the Diagnostic and Statistical Manual of Mental Disorders, 4th edition,32 and we included 2 additional categories to reflect depression in remission (complete and partial; the acute/chronic distinction is not meaningful for patients in remission) for a total of 8 distinct depression patient groups (see Table 1). For asthma, we defined 4 levels of severity (mild intermittent, mild, moderate, severe persistent).33 Because asthma is a chronic and recurrent condition, the classification of asthma severity depends on either the presence of symptoms or the frequency of medications used to control symptoms; thus, we further classified each severity level according to how well the symptoms were controlled (well, moderately, poorly controlled). We stipulated that mild intermittent asthma is well controlled by definition and that 3 gradations of control is too fine a distinction for mild persistent asthma; therefore, the severity and control categorizations combined to form 9 distinct asthma patient groups (see Table 1).
Table 1.
Average Before-Treatment Ratings, Final Natural History Ratings (NHf), and Their Difference (NH Change; NHf – BT) for Depression and Asthma Patient Groups (No Comorbidity)
| Before Treatment |
Natural History |
||||
|---|---|---|---|---|---|
| Condition/Severity | Mean | Range | Median | Range | NH Change |
| Depression | |||||
| Acute mild | 0.807 | 0.687–0.945 | 0.812 | 0.726–0.854 | 0.005 |
| Acute moderate | 0.684 | 0.600–0.936 | 0.711 | 0.607–0.750 | 0.027 |
| Acute severe | 0.546 | 0.197–0.910 | 0.571 | 0.525–0.596 | 0.025 |
| Chronic mild | 0.785 | 0.600–0.926 | 0.780 | 0.703–0.803 | −0.005 |
| Chronic moderate | 0.675 | 0.547–0.912 | 0.669 | 0.570–0.697 | −0.006 |
| Chronic severe | 0.532 | 0.202–0.878 | 0.527 | 0.522–0.563 | −0.005 |
| Partial remission | 0.780 | 0.644–0.920 | 0.774 | 0.766–0.801 | −0.006 |
| Full remission | 0.915 | 0.870–0.979 | 0.917 | 0.912–0.944 | 0.002 |
| Asthma | |||||
| Mild intermittent | 0.894 | 0.753–0.952 | 0.892 | 0.891–0.952 | −0.002 |
| Mild persistent, well controlled | 0.868 | 0.772–0.971 | 0.876 | 0.867–0.941 | 0.008 |
| Mild persistent, poorly controlled | 0.755 | 0.642–0.880 | 0.732 | 0.727–0.801 | −0.023 |
| Moderate persistent, well controlled | 0.801 | 0.665–0.907 | 0.811 | 0.788–0.941 | 0.010 |
| Moderate persistent, moderately controlled | 0.683 | 0.583–0.799 | 0.660 | 0.648–0.795 | −0.023 |
| Moderate persistent, poorly controlled | 0.575 | 0.376–0.701 | 0.533 | 0.522–0.604 | −0.042 |
| Severe persistent, well controlled | 0.738 | 0.652–0.851 | 0.740 | 0.734–0.920 | 0.002 |
| Severe persistent, moderately controlled | 0.610 | 0.477–0.738 | 0.581 | 0.573–0.777 | −0.029 |
| Severe persistent, poorly controlled | 0.494 | 0.249–0.650 | 0.454 | 0.443–0.501 | −0.040 |
Treatment patterns.
The 2nd aspect of the clinical profile, specification of the treatments to be rated, required identification of common treatment patterns for depression and asthma and decisions regarding which common treatments were applicable for the various asthma and depression severity groups. We used claims data from 1998 to 2000 in the Medstat MarketScan® database to ascertain common patterns of care among patients between the ages of 18 and 55 y who had an index visit for asthma or depression identified based on ICD-9 codes (ICD-9 codes for depression were 296.2 and 296.3 and for asthma were 493, 493.9, 493.0, 493.1, and 493.2). For both conditions, National Drug Codes and Current Procedural Terminology codes were used to identify therapies, and continuous enrollment during the observation period was required. The Medstat MarketScan® database includes all inpatient, outpatient, and pharmacy claims as well as enrollment and demographic information for approximately 11 million covered lives. These individuals include employees, retirees, and dependents from large, self-funded US employers.
For depression, we defined an index visit as the 1st visit for a major depressive episode after a 12-mo period of no visits for depression, no psychotherapy visits, and no antidepressant medication. Patients with any history of a bipolar, schizophrenia, or schizoaffective diagnosis code were excluded. Based on these criteria, we identified 18 distinct patterns of usual care from 6343 patient records. These patterns of care reflected approximately 95% of the patterns observed in the claims data and varied according to the number of psychotherapy visits (0, 1–3, 4–9, 10 or more), use of a nontricyclic antidepressant medication (yes or no), whether the patient received a medication follow-up visit (yes or no), and the number of days of sedative/hypnotic use (0, 1–60, >60). The number of distinct patterns is less than what would result if each of the factors were completely crossed because, for example, medication follow-up cannot occur without medication use. In addition, the combination of sedative/hypnotic use with other treatments was particularly limited in the patient records. Psychotherapy visits alone (without any medication) accounted for approximately 40% of the observed treatment patterns in the claims data; 25% received 1 to 3 visits, and 15% received 4 to 9 visits. An additional 13% received 1 to 3 visits plus antidepressant medication. Each of the remaining patterns was observed among fewer than 10% of the patients. (The patterns of care from the Medstat database are presented in more detail by Watkins and others.34)
In matching the 18 treatment patterns to the 8 depression patient groups to create rating profiles, it appeared that all treatment patterns constituted reasonable care for all patient groups, except those in full or partial remission. Therefore, all were applied to 6 of the 8 depression patient groups. An additional 3 treatments were applied to care for depression patients in full (1 treatment) or partial (2 treatments) remission, for a total of 111 depression treatment profiles. We randomly assigned 33 randomly selected patient group-treatment pattern combinations to be rated for patients with comorbid alcohol dependence (11 ratings), general medical condition (11 ratings), or both (11 ratings). Table 2 displays the complete set of depression treatment rating profiles.
Table 2.
After-Treatment Rating Grid for Depression
| Treatment Combination to Be
Rated |
Severity (Acute) |
Severity (Chronic) |
Depression in
Remission |
||||||||
|---|---|---|---|---|---|---|---|---|---|---|---|
| Therapy | ADA | Med F/U | S/H | Mild | Moderate | Severe | Mild | Moderate | Severe | Full | Partial |
| 0 | Yes | No | 0 | 1 | 19a | 37 | 55 | 73 | 91 | ||
| 0 | Yes | Yes | 0 | 2a | 20a | 38 | 56 | 74a | 92 | ||
| 1 to 3 | No | No | 0 | 3a | 21a | 39a | 57a | 75 | 93 | ||
| 4 to 9 | No | No | 0 | 4 | 22 | 40 | 58 | 76 | 94 | ||
| 10 + | No | No | 0 | 5 | 23 | 41 | 59 | 77 | 95a | ||
| 1 to 3 | Yes | No | 0 | 6a | 24 | 42 | 60a | 78 | 96 | ||
| 1 to 3 | Yes | Yes | 0 | 7 | 25 | 43 | 61a | 79 | 97a | ||
| 4 to 9 | Yes | No | 0 | 8 | 26a | 44a | 62 | 80 | 98a | ||
| 4 to 9 | Yes | Yes | 0 | 9 | 27 | 45 | 63 | 81 | 99 | ||
| 10 + | Yes | No | 0 | 10 | 28a | 46 | 64a | 82 | 100 | ||
| 10 + | Yes | Yes | 0 | 11a | 29 | 47 | 65 | 83 | 101 | ||
| 1 to 3 | No | No | 1 to 60 | 12 | 30 | 48 | 66 | 84 | 102 | ||
| 1 to 3 | No | No | 60 + | 13 | 31 | 49a | 67 | 85 | 103 | ||
| 4 to 9 | No | No | 1 to 60 | 14 | 32 | 50 | 68a | 86 | 104 | ||
| 1 to 3 | Yes | No | 1 to 60 | 15a | 33 | 51 | 69 | 87a | 105 | ||
| 1 to 3 | Yes | Yes | 1 to 60 | 16 | 34 | 52 | 70a | 88a | 106a | ||
| 1 to 3 | Yes | No | 60 + | 17a | 35a | 53 | 71 | 89 | 107a | ||
| 1 to 3 | Yes | Yes | 60 + | 18 | 36a | 54 | 72 | 90a | 108 | ||
| Decrease dose | 109a | ||||||||||
| Increase dose | 110a | ||||||||||
| Change to different SSRI | 111 | ||||||||||
Note: All ratings (1–111) were made forno comorbidity. Bold indicates that this rating was rated by all panelists. Therapy = psychotherapy, maybe 0,1 to 3, 4 to 9, or10 + visits. ADA = antidepressant medication, yes means ≥30 d of a non-tricyclic antidepressant; Med F/U = medication follow-up visit, yes means the patienthad at least 1; S/H = anxiolytics, sedatives, orhypnotics, maybe no, 1 to 60, or 60 + d; SSRI = selective serotonin reuptake inhibitor.
This rating was also made for a comorbidity (either medical [MED], alcohol dependence [AD], or MED + AD).
For asthma, we defined an index visit as the 1st visit associated with an asthma diagnosis after a 3-mo period of no visits. All asthma treatments involved medications, which were classified according to their function: short-acting beta agonists, long-acting beta agonists, inhaled corticosteroids at either a low or high dose (high dose is >1000 μg per day of beclometha-sonedipropionate or equivalent), leukotriene modifiers, and oral steroids. By gathering information about medications prescribed during the 3 mo prior to the index visit and crossing that with prescriptions filled within 7 d of the index visit, we identified a total of 61 distinct common treatment patterns that reflected approximately 95% of the patterns observed among 8511 patients receiving treatment in the claims data. The largest group of patients was prescribed short-acting beta agonists (30%), 16% received oral steroids, 10% received a combination of short-acting beta agonists and oral steroids, and each of the remaining combinations was observed among fewer than 10% of the patients.
We assigned these 61 treatment patterns to the 9 asthma patient groups to reflect plausible care. Because most of the treatment patterns were applicable to only a few of the conditions (e.g., mild intermittent asthma would not be treated with oral steroids), 85% of the 549 possible clinical profiles were eliminated, resulting in a total of 84 patient group-treatment pattern combinations for asthma (see Table 3). Our decisions about patient group-treatment pattern combinations to retain were made in consultation with asthma experts and were based primarily on their opinion regarding plausible care. We randomly selected 10 of these combinations to be rated for patients who were smokers.
Table 3.
After-Treatment Rating Grid for Asthma
| Treatments to Be
Rated |
|||||||||||||||||
|---|---|---|---|---|---|---|---|---|---|---|---|---|---|---|---|---|---|
| Severity | 3mo of Prior Medications |
SAB | SAB LM |
SAB ICS(lo) |
SAB ICS(lo) LM |
SAB ICS(hi) |
SAB ICS(hi) LM |
SAB ICS OCS |
SAB ICS OCS LM |
SAB LAB ICS(lo) |
SAB LAB ICS(lo) LM |
SAB LAB ICS(lo) OCS |
SAB LAB ICS(lo) OCS LM |
SAB LAB ICS(hi) |
SAB LAB ICS(hi) LM |
SAB LAB ICS(hi) OCS |
SAB LAB ICS(hi) OCS LM |
| MI | No meds | 1 | |||||||||||||||
| MPWC | SAB, ICS(lo) | 2 | 3 | ||||||||||||||
| MoPWC | SAB, ICS (hi) | 4 | |||||||||||||||
| SAB, LAB, ICS(lo) | 6 | ||||||||||||||||
| SPWC | SAB, LAB, ICS (hi) | 7 | |||||||||||||||
| SAB, LAB, ICS(hi), OCS | 8 | ||||||||||||||||
| MPM/PC | No meds SAB | 9 | 10 | 11 | 12 | ||||||||||||
| SAB | 13 | 14a | 15 | ||||||||||||||
| SAB, LM | 16 | ||||||||||||||||
| MoPMC | SAB, ICS(lo) | 17a | 18 | 19 | 20 | 21 | |||||||||||
| SAB, ICS(lo), LM | 22 | 23a | |||||||||||||||
| SPMC | SAB, LAB, ICS(lo) | 24 | 25 | 26 | 27 | 28 | 29 | 30 | |||||||||
| SAB, LAB, ICS(lo), LM | 31 | 32 | 33a | 34 | |||||||||||||
| MoPPC | No meds | 35 | 36 | 37 | 38a | 39 | 40a | ||||||||||
| SAB | 41 | 42 | 43 | 44 | 45 | 46 | |||||||||||
| SAB, LM | 47 | 48 | 49 | ||||||||||||||
| SPPC | SAB | 50 | 51 | 52 | 53 | 54 | 55 | 56a | 57 | 58 | 59 | 60 | 61 | 62 | 63 | 64 | |
| SAB, ICS(lo) | 65 | 66 | 67 | 68 | 69 | 70 | 71 | 72 | 73 | 74 | 75 | 76a | 77a | ||||
| SAB, LM | 78 | 79 | 80 | 81 | 82 | 83a | 84 | ||||||||||
Note: All ratings (1–84) were made for nonsmokers. Bold indicates that this rating was rated by all panelists. SAB = short-acting beta agonists; LM = leukotriene modifiers; ICS(lo) = inhaled corticosteroids at a low dose; ICS(hi) = inhaled corticosteroids at a high dose; LAB = long-acting beta agonists; OCS = oral corticosteroids; MI = mild intermittent; MPWC = mild persistent, well controlled; MoPWC = moderate persistent, well controlled; SPWC = severe persistent, well controlled; MPM/PC = mild persistent, moderately to poorly controlled; MoPMC = moderate persistent, moderately controlled; SPMC = severe persistent, moderately controlled; MoPPC = moderate persistent, poorly controlled; SPPC = severe persistent, poorly controlled.
This rating was also made for a smoker.
Estimating Treatment Benefit
There were several steps involved in producing the final average treatment benefit estimates for the patient group-treatment pattern combinations, which are described in more detail below. The 1st step was the development of an effective elicitation protocol. The 2nd step involved recruitment and orientation of expert panelists. The next several steps were adaptations of the RAND-UCLA appropriateness method, in which experts make ratings, discuss them in the expert panel meeting, and then make final ratings based on the discussion. In our application, experts needed to rate the average utility before and after treatment initiation, and ratings were collected in multiple phases prior to the expert panel meeting (see Figure 1).
Figure 1.
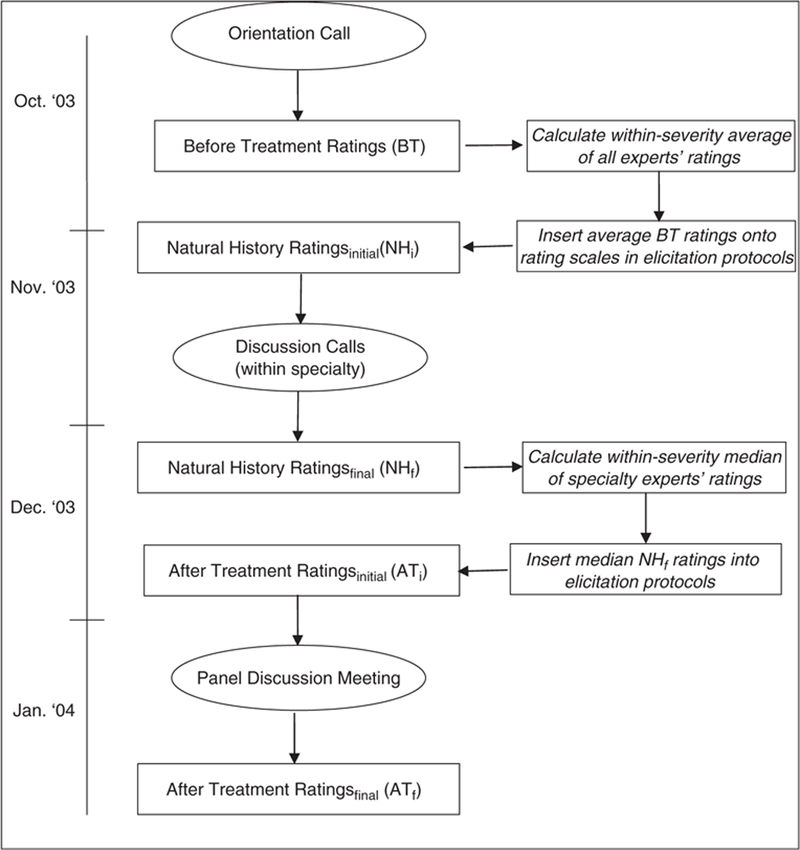
Flow chart of expert rating exercises and discussions.
Development of elicitation protocol.
All ratings were elicited on computer via the Web using an interface designed to facilitate logical and consistent ratings. The development of this interface was informed by several iterations of pilot testing to arrive at an efficient elicitation protocol. The Web tool displayed clinical profile information for the patient group to be rated at the top of the page, a large utility scale with a movable pointer on which to make ratings (the movable pointer location originated at 1), and several summary tables that recorded information about individual raters’ ongoing ratings. Three distinct types of ratings were elicited, and the Web interface varied for each type (the Web tool prototype can be accessed at http://web3.rand.org/equity/).
The 1st interface version was designed to elicit ratings for each patient group (8 severities × 4 comorbidities for depression, 9 severities × 2 comorbidities for asthma) to reflect that group’s average utility before any new treatment (BT). Figure 2 shows the Web screen to elicit the BT rating for patients with acute mild depression and no comorbidity. The summary and rating information at the bottom half of the screen is blank at this stage because this is the 1st depression rating. As experts proceeded through the rating task, the summary and rating information was calculated and inserted into these tables on the screen. This procedure was adopted based on feedback from pilot studies and was intended to facilitate rater consistency.
Figure 2.
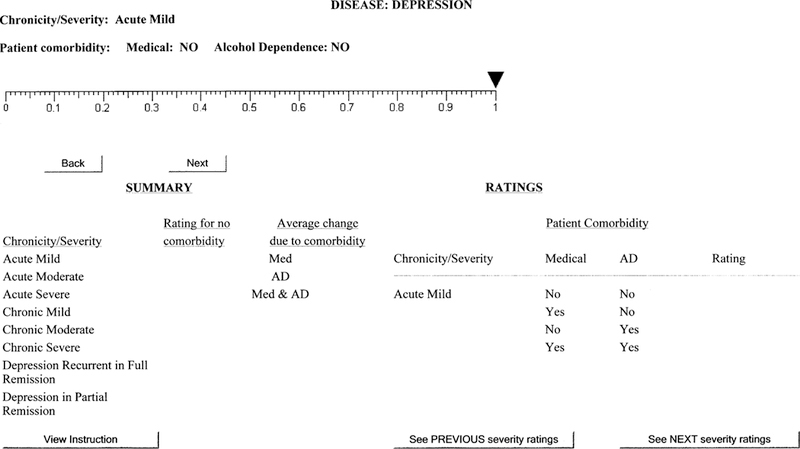
Screen for before-treatment depression ratings.
The 2nd version was designed to elicit natural history ratings for each patient group (NH). These ratings were intended to reflect the natural course of the disease in terms of each group’s average utility value in the event that no new treatment was initiated after 1 mo for patients with asthma and 3 mo for depression patients. The interface for this was similar to that depicted in Figure 2, except that the experts’ average BT values for each patient group from the previous exercise were indicated on the rating scales with a pointer.
A final version was designed to elicit ratings for each patient group-treatment pattern combination to reflect that group’s average utility after receiving the indicated treatment (AT; 1 mo after treatment initiation for asthma and 3 mo after treatment initiation for depression). An example AT rating elicitation screen for individuals with acute mild depression receiving antidepressants is shown in Figure 3. Like the BT (Figure 2) and NH rating protocols, this screen provides information about the patient group and has a dynamic table in the bottom half of the screen that incorporates experts’ ratings as they proceed through the task (shaded cells in the table indicate ratings to be made). In addition to having the average BT value indicated on the rating scale (0.81 in Figure 3), the AT rating protocols also list the final NH rating for the patient group (0.90) and indicate the specific treatment to be rated.
Figure 3.
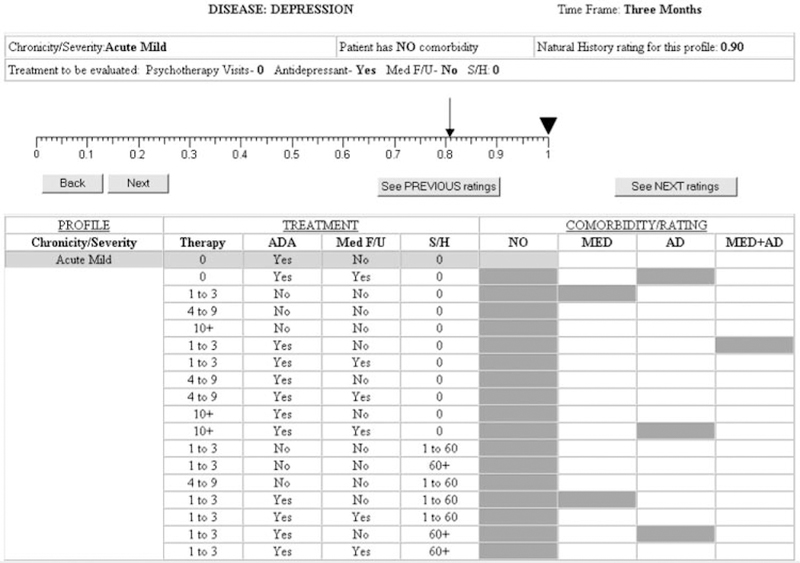
Screen for after-treatment depression ratings.
Expert panelists and background materials.
We recruited 6 depression experts and 7 asthma experts. Two panel chairs were selected from this group of 13 who had expertise in both conditions, and all experts were nationally recognized as experts in their field. Panelists included primary care physicians, specialty physicians, psychologists, and nurse practitioners/asthma education specialists.
Prior lessons from the literature35 and feedback from a series of pilot studies helped determine the necessary content and optimal presentation of written material for experts’ orientation and continued reference as they made their ratings. We provided experts with several written materials including key articles on the natural history of depression and asthma, key review articles and meta-analyses on treatment effectiveness, and a summary of the literature on patient characteristics that influence treatment response. In compiling this summary, we relied on data from randomized controlled trials wherever possible. We also provided experts with a brief description of the utility scale as a way of representing an individual’s degree of health-related quality of life. For this study, experts were told they would make their ratings on a 0 to 1 utility scale, with 0 representing death and 1 representing the best possible health, and they were provided with a utility ruler that indicated several patient-rated utilities gathered from the available literature11,36–38 to help anchor their ratings (see Figure 4). Feedback from experts during the panel discussion indicated that they referred to this ruler frequently as they made and discussed their ratings.
Figure 4.
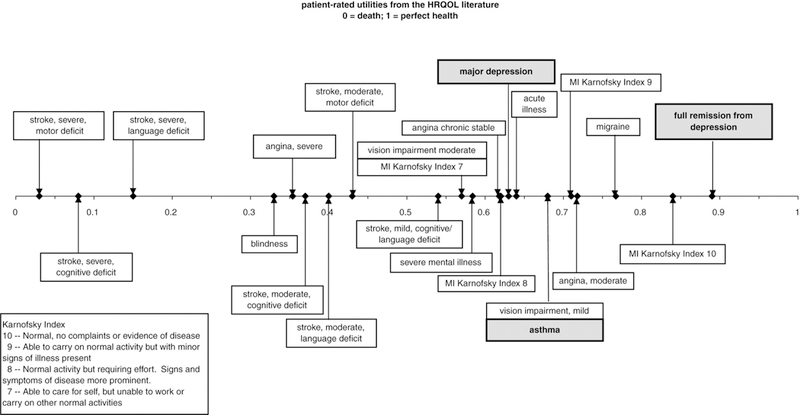
Utility ruler provided to experts. HRQOL = health-related quality of life.
The rating task required that experts provide their estimate of the average utility of each specified patient group before and after treatment given a set of assumptions and definitions that were selected so that ratings would tend to reflect average states across the condition populations. Briefly, for both conditions, experts were instructed to consider as their reference group the national population of adult patients aged 18 to 55 y with the indicated characteristics and to assume that the treatments were approximately equally effective for all patients in each group. Experts were instructed to assume that for a given profile, the diagnosis was correct and the pharmacotherapy treatment was given in the appropriate dosages. For depression, they were asked to assume that the psychotherapy was either cognitive-behavioral therapy or interpersonal psychotherapy, was provided by a clinician in the usual practice, and was given once per week. (These 2 types of psychotherapy were chosen because they have demonstrated efficacy and effectiveness in multiple randomized controlled trials; although other psychological treatments may be useful in individual patients, evidence for their efficacy/effectiveness is lacking.) Experts were asked not to take the cost of the intervention into account when making their ratings and were instructed to assume usual compliance. With respect to the medical comorbidity for depression, panelists were told the following: A medical comorbidity is considered present if the individual presents with a chronic major medical diagnosis concurrent with or within the past year of the treatment episode, which would be expected to influence the person’s functioning and quality of life. Examples include diabetes, congestive heart failure, angina, cancer, AIDS, or arthritis. The experts were told to assume that usual treatment or referral is provided for the medical comorbidity.
Premeeting rating elicitation.
The series of steps to elicit premeeting ratings is depicted in Figure 1. Experts first rated the average utility before any new treatment (BT ratings) for each of the 8 depression and 9 asthma patient groups. As is clear from Table 3 (columns 1 and 2), there was variation within 7 of the 9 asthma patient groups with respect to their pretreatment medications. However, the BT ratings were made for these patient groups as a whole according to the severity and control specification of the patient groups, regardless of prior medication. After these ratings were complete, the average BT rating (listed in Table 1) was calculated for each patient group and inserted into all subsequent rating protocols (i.e., NH and AT rating protocols) so that all experts were using a common reference point. Next, experts estimated the average utility for each depression patient group 3 mo later, and for each asthma patient group 1 mo later, after no new treatment (NH ratings; NHi). As with the BT ratings, experts made the NH ratings for the 9 asthma patient groups regardless of prior medication. The experts then discussed these NHi ratings via phone to establish some degree of consensus. To facilitate the discussion, experts were provided with plots of results depicting the extent of their discrepancies and the general trend of their ratings as a group. Experts made a 2nd set of NH ratings (NHf ) for each patient group in their own specialty following the consensus discussion. The median of these within-specialty NHf ratings for each patient group (listed in Table 1) was calculated and inserted into the subsequent AT rating protocols.
The consensus discussion was important for 2 reasons. First, pilot work indicated that mon cognitive step in estimating the average treatment benefit. Thus, forming consensus on the average natural history of asthma over 1 mo and depression over 3 mo for various levels of illness severity could serve to reduce variability in the estimates of average treatment benefit. Second, in terms of the cost-effectiveness of treatments, treatment utility is traditionally valued against a no-treatment alternative (i.e., NH) to incorporate any changes over time that may occur regardless of treatment. Thus, this process helped to enhance the validity of the NH ratings for subsequent use.
At this point in the rating process, the BT and NHf ratings were considered finalized, and the remaining exercises (including the panel discussion meeting) focused on the AT ratings. The final set of premeeting ratings required experts to estimate the average utility of the various patient grouptreatment combinations 1 mo after initiating treatment for asthma and 3 mo after initiating treatment for depression (ATi ratings). Experts completed ATi ratings for all profiles within their specialty and for a selected subset (approximately 20%) of nonspecialty profiles. We collected the subset of cross-specialty ratings to provide a common reference between the 2 conditions and to promote the likelihood that experts were using the scale similarly in their ratings of both conditions.39
Expert panel meeting material preparation.
We prepared materials summarizing results of the premeeting treatment benefit estimates (ATi — BT) in table and chart formats to facilitate discussion during the expert panel meeting. One set of plots emphasized differences in estimates according to specialty among the subset of 22 depression and 18 asthma profiles that were rated by all experts regardless of specialty. Other charts and tables provided results of the within-specialty estimates. Several tables allowed experts to get a general sense of the range of estimates and to see how they tended to rate relative to others, and charts emphasized selected profiles whose estimates were most discrepant.
Expert panel meeting and final ratings.
The expert panel meeting was conducted over 2 d. Experts spent the 1st morning discussing the asthma and depression profiles that were rated by all experts, focusing primarily on patterns of expert/nonexpert discrepancies in treatment benefit estimates (e.g., experts tended to estimate greater benefit than nonexperts). The discussion covered a variety of topics including, for example, clarifications about assumptions and definitions and findings from relevant literature. Next, the experts split into 2 groups according to expertise to discuss the most discrepant within-expert estimates as well as the comorbidity effects. These discussions included, for example, consideration of assumptions, available literature, and personal experience to explain the reasoning behind the AT ratings that were made and the resultant treatment benefit estimates. During these discussions, experts also sought to agree on several general rules or benchmarks for the treatment benefit estimates (e.g., experts came to a consensus on benefit estimates for the most optimal treatment for each patient group). In the afternoon of the 2nd day, all experts reconvened, and the panel chairs summarized the main points of their group’s discussion, including decisions that were made and the reasoning for those decisions. Immediately following the expert panel discussions, experts made a new set of AT ratings (ATf). While making their final ratings, experts had access to whatever notes they had taken during the panel discussion but were not able to refer to their original ratings. These ATf ratings took approximately 60 min to complete.
Evaluation of final treatment benefit estimates.
The final treatment benefit estimates were calculated as the differences in the BT and ATf ratings. We examined these estimates for face validity and evaluated the extent of their variability. We generated basic descriptive statistics to gather information about the impact of the expert panel. We also constructed box plots of selected treatment benefit estimates before and after the panel discussion.
RESULTS
BT and NHf Ratings
Table 1 displays the average and range of BT and within-specialty NHf ratings that were elicited prior to the expert panel meeting. These tabulated average values were used to anchor the experts’ ATi and ATf ratings. Based on the distribution of the ratings, the mean was used for the central tendency of the BT ratings, whereas the median was chosen for the NHf ratings, which were fewer in number (specialists only) and slightly skewed by the presence of an outlier for both conditions. In general, BT and NHf data sets were nearly complete; however, 2 experts did not complete their BT ratings in time to be included in the average calculation that was incorporated into the NH and AT rating pages. The average BT ratings for depression ranged across the patient severity groups from 0.532 to 0.915, with chronic conditions rated consistently lower than their acute counterparts. These ratings correspond well with the 2 existing values that were available from the literature, a utility of 0.63 for major depression and 0.89 for full remission from depression.36 For 6 of the 8 depression patient groups, the expected change in utility based on the median NHf ratings over 3 mo with no new treatment was minimal. However, patients with acute moderate and acute severe depression were expected to improve somewhat over the 3-mo period.
For asthma, the average BT ratings ranged across the severity patient groups from 0.494 to 0.894, with the more persistent and less well-controlled patient groups getting lower ratings. The 1 general utility value available from the literature (0.68)38 falls in the middle of this range. Based on the average NHf ratings, the extent of expected change over 1 mo with no new treatment was minimal for the mildest and well-controlled asthma conditions. Experts expected that patient groups with more persistent and less well-controlled asthma would get somewhat worse over the 1-mo period with no new treatment.
Final Treatment Benefit Ratings (ATf – BT)
Quality of the final ratings.
Tables 4 and 5 provide an abbreviated set of final treatment benefit estimates for depression and asthma, respectively. Characteristics of all rated depression and asthma profiles are listed in Appendices A and B, which can be found at http://mdm/sagepub.com/supplemental/ ). The appendices list each of the patient group-treatment pattern profiles that were rated, the before and final after treatment ratings, and estimated treatment benefit means and standard deviations. These estimates reflect within-specialty ratings only; they do not incorporate cross-specialty ratings for the 40 profiles that were rated by all panelists regardless of expertise. The ATf ratings data set was nearly complete, with less than 1% missing; thus, the small amount of missing data was ignored in calculating treatment benefit estimates. For both conditions, the variability of the estimates was minimal. The average standard deviation for depression treatment benefit estimates was 0.02 (range — 0.004–0.06) and for asthma was 0.03 (range = 0.01–0.06). In addition, the majority of the estimates had standard deviations of less than 0.05. For depression, 80% of the estimates’ standard deviations were < 0.025, 17% were between 0.025 and 0.05, and only 3% were > 0.05. For asthma, 31% of the estimates’ standard deviations were < 0.025, 58% were between 0.025 and 0.05, and only 11% were >0.05.
Table 4.
Mean and Standard Deviation of Final Treatment Benefit Estimates (ATf – BT) for Abbreviated Set of Depression Treatment Profiles
| Profile ID |
No.
of Therapy Visits |
Prescribed Medication |
Medication Follow-up |
Days
of Sedative/ Hypnotic Use |
Condition Severity |
Comorbidity | Before- Treatment Rating (BT) |
Final After- Treatment Rating (ATf) |
Treatment
Benefit Estimate (ATf – BT) |
|
|---|---|---|---|---|---|---|---|---|---|---|
| s | ||||||||||
| 1 | 0 | Yes | No | 0 | Acute mild | No | 0.807 | 0.860 | 0.053 | 0.009 |
| 2 | 0 | Yes | Yes | 0 | Acute mild | No | 0.807 | 0.909 | 0.102 | 0.015 |
| 3 | 0 | Yes | Yes | 0 | Acute mild | AD | 0.740 | 0.819 | 0.079 | 0.034 |
| 4 | 1 to 3 | No | No | 0 | Acute mild | No | 0.807 | 0.842 | 0.035 | 0.015 |
| 5 | 1 to 3 | No | No | 0 | Acute mild | MED | 0.764 | 0.791 | 0.027 | 0.014 |
| 6 | 4 to 9 | No | No | 0 | Acute mild | No | 0.807 | 0.881 | 0.073 | 0.015 |
| 7 | 10+ | No | No | 0 | Acute mild | No | 0.807 | 0.914 | 0.107 | 0.010 |
| 8 | 1 to 3 | Yes | No | 0 | Acute mild | No | 0.807 | 0.879 | 0.072 | 0.013 |
| 9 | 1 to 3 | Yes | No | 0 | Acute mild | MED+AD | 0.690 | 0.754 | 0.065 | 0.016 |
| 10 | 1 to 3 | Yes | Yes | 0 | Acute mild | No | 0.807 | 0.913 | 0.106 | 0.025 |
| 11 | 4 to 9 | Yes | No | 0 | Acute mild | No | 0.807 | 0.910 | 0.102 | 0.014 |
| 12 | 4 to 9 | Yes | Yes | 0 | Acute mild | No | 0.807 | 0.931 | 0.124 | 0.013 |
| 13 | 10+ | Yes | No | 0 | Acute mild | No | 0.807 | 0.920 | 0.113 | 0.018 |
| 14 | 10+ | Yes | Yes | 0 | Acute mild | No | 0.807 | 0.938 | 0.131 | 0.013 |
| 15 | 10+ | Yes | Yes | 0 | Acute mild | AD | 0.740 | 0.854 | 0.114 | 0.025 |
| 16 | 1 to 3 | No | No | 1 to 60 | Acute mild | No | 0.807 | 0.841 | 0.034 | 0.011 |
| 17 | 1 to 3 | No | No | 60+ | Acute mild | No | 0.807 | 0.833 | 0.026 | 0.019 |
| 18 | 4 to 9 | No | No | 1 to 60 | Acute mild | No | 0.807 | 0.882 | 0.074 | 0.020 |
| 19 | 1 to 3 | Yes | No | 1 to 60 | Acute mild | No | 0.807 | 0.885 | 0.078 | 0.018 |
| 20 | 1 to 3 | Yes | No | 1 to 60 | Acute mild | MED | 0.764 | 0.854 | 0.090 | 0.020 |
Note: MED = medical; AD = alcohol dependence.
Table 5.
Mean and Standard Deviation of Final Treatment Benefit Estimates (ATf – BT) for Abbreviated Set of Asthma Treatment Profiles
| Profile ID |
Condition Severity |
Condition Control |
Prior Medications |
New Treatment |
Smoker | Before- Treatment Rating (BT) |
Final After- Treatment Rating (ATf) |
Treatment
Benefit Estimate (ATf – BT) |
|
|---|---|---|---|---|---|---|---|---|---|
| s | |||||||||
| 1 | Mild intermittent | NA No meds | SAB | No | 0.894 | 0.925 | 0.031 | 0.020 | |
| 2 | Mild persistent | Well | SAB ICS(lo) | SAB LM | No | 0.868 | 0.833 | −0.035 | 0.022 |
| 3 | Mild persistent | Well | SAB ICS(lo) | SAB ICS (lo) LM | No | 0.868 | 0.868 | 0.000 | 0.012 |
| 4 | Moderate persistent | Well | SAB ICS (hi) | SAB ICS (hi) LM | No | 0.801 | 0.801 | 0.000 | 0.012 |
| 5 | Moderate persistent | Well | SAB ICS (lo) LM | SAB ICS (hi) LM | No | 0.801 | 0.807 | 0.007 | 0.027 |
| 6 | Moderate persistent | Well | SAB LAB ICS (lo) | SAB LAB ICS(lo) LM | No | 0.801 | 0.797 | −0.004 | 0.013 |
| 7 | Severe persistent | Well | SAB LAB ICS (hi) | SAB LAB ICS(hi) LM | No | 0.738 | 0.733 | −0.005 | 0.019 |
| 8 | Severe persistent | Well | SAB LAB ICS (hi) OCS | SAB LAB ICS(hi) OCS LM | No | 0.738 | 0.736 | −0.003 | 0.021 |
| 9 | Mild persistent | Poor | No meds | SAB | No | 0.755 | 0.800 | 0.044 | 0.012 |
| 10 | Mild persistent | Poor | No meds | SAB LM | No | 0.755 | 0.819 | 0.063 | 0.024 |
| 11 | Mild persistent | Poor | No meds | SAB ICS (lo) | No | 0.755 | 0.859 | 0.104 | 0.014 |
| 12 | Mild persistent | Poor | No meds | SAB ICS (lo) LM | No | 0.755 | 0.866 | 0.110 | 0.017 |
| 13 | Mild persistent | Poor | SAB | SAB LM | No | 0.755 | 0.789 | 0.033 | 0.022 |
| 14 | Mild persistent | Poor | SAB | SAB ICS (lo) | No | 0.755 | 0.854 | 0.099 | 0.010 |
| 15 | Mild persistent | Poor | SAB | SAB ICS (lo) | Yes | 0.714 | 0.770 | 0.056 | 0.032 |
| 16 | Mild persistent | Poor | SAB | SAB ICS (lo) LM | No | 0.755 | 0.861 | 0.106 | 0.019 |
| 17 | Mild persistent | Poor | SAB LM | SAB ICS (lo) LM | No | 0.755 | 0.856 | 0.100 | 0.016 |
| 18 | Moderate persistent | Moderate | SAB ICS (lo) | SAB ICS (lo) LM | No | 0.683 | 0.720 | 0.037 | 0.030 |
| 19 | Moderate persistent | Moderate | SAB ICS (lo) | SAB ICS (lo) LM | Yes | 0.639 | 0.675 | 0.035 | 0.020 |
| 20 | Moderate persistent | Moderate | SAB ICS(lo) | SAB ICS (hi) | No | 0.683 | 0.743 | 0.061 | 0.018 |
Note: SAB = short-acting beta agonists; LM = leukotriene modifiers; ICS(lo) = inhaled corticosteroids at a low dose; ICS(hi) = inhaled corticosteroids at a high dose (>1000 μm/d of beclomethasone dipropionate or equivalent); LAB = long-acting beta agonists; OCS = oral corticosteroids.
Comparing estimates across conditions.
Two sets of descriptive analyses were conducted on the profiles rated by all experts regardless of expertise to evaluate the extent to which we could reasonably compare treatment benefit estimates (ATf — BT) across conditions. First, we calculated the mean difference between expert and nonexpert estimates before (using ATi-) and after (using ATf) the expert panel for each condition. These results, shown in Table 6, indicate that the average expert/nonexpert difference decreased substantially from the initial to final ratings for both depression (from 0.020 to –0.009) and asthma (from 0.058 to –0.022) estimates. We also generated box plots for each condition before and after the expert panel to display the amount of variability in the individual profile estimates according to the type of expertise. A convergence in expert/nonexpert estimates should result in less variability across expertise groups. As can be seen in Figures 5 and 6, this was the case for both depression and asthma estimates. Not only did the amount of variability across expertise groups decrease substantially, but the treatment benefit estimates (ATf – BT) for each individual profile also converged considerably for both expertise groups after the expert panel.
Table 6.
Mean (s) Treatment Benefit Estimates (AT – BT) and Difference According to Expertise for Depression (n = 22) and Asthma (n = 18) Profiles Rated by All Experts before (ATi) and after (ATf) Expert Panel
| Depression Experts | Asthma Experts | Expert-Nonexpert | |
|---|---|---|---|
| Depression | |||
| Before panel (ATi – BT) | 0.119 (0.090) | 0.099 (0.067) | 0.020 (0.080) |
| After panel (ATf – BT) | 0.124 (0.073) | 0.133 (0.072) | −0.009 (0.072) |
| Asthma | |||
| Before panel (ATi – BT) | 0.074 (0.062) | 0.132 (0.099) | 0.058 (0.088) |
| After panel (ATf – BT) | 0.134 (0.080) | 0.112 (0.076) | −0.022 (0.078) |
Figure 5.

Depression profiles rated by all experts: treatment benefit estimates before (ATi – BT) and after (ATf – BT) panel discussion by expertis.
Figure 6.
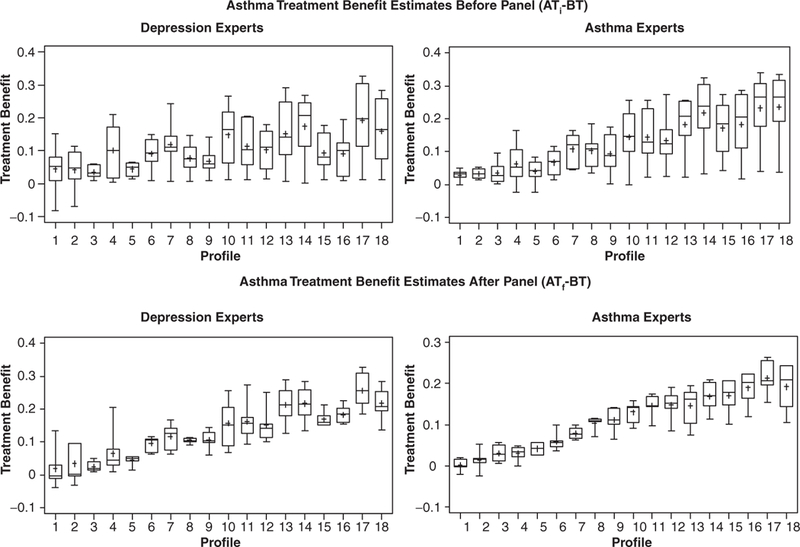
Asthma profiles rated by all experts: treatment benefit estimates before (ATi – BT) and after (ATf – BT) panel discussion by expertise.
Impact of expert panel on treatment benefit estimates.
To examine the impact of the expert panel on experts’ estimates, we examined the difference between each expert’s mean treatment benefit estimate before (using ATi) and after (using ATf) the expert panel. Table 7 displays these results for depression, and Table 8 lists the asthma results (experts 7 and 13, the panel chairs, were considered experts in both conditions and completed ratings for both conditions). For depression, 3 of the 7 experts’ average treatment benefit estimates increased and 4 decreased after the expert panel, resulting in a very small overall mean treatment benefit estimate change. In contrast, for asthma, the overall mean treatment benefit estimate was markedly lower after the expert panel as compared to before. Five of the 8 asthma experts decreased their estimates, whereas only 3 experts’ estimates increased.
Table 7.
Experts’ Mean (s) Treatment Benefit Estimates (AT – BT) and Difference for Depression Profiles (n = 144) before (ATi) and after (ATf) Expert Panel
| Expert ID | Before Panel (ATi – BT) | After Panel (ATf – BT) | After – Before (ATi – ATf) |
|---|---|---|---|
| 12 | 0.149 (0.081) | 0.102 (0.055) | −0.047 (0.058) |
| 8 | 0.126 (0.076) | 0.096 (0.057) | −0.030 (0.045) |
| 7 | 0.112 (0.080) | 0.098 (0.059) | −0.014 (0.054) |
| 11 | 0.100 (0.059) | 0.098 (0.056) | −0.002 (0.056) |
| 10 | 0.090 (0.054) | 0.096 (0.059) | 0.006 (0.030) |
| 13 | 0.101 (0.076) | 0.111 (0.055) | 0.010 (0.058) |
| 9 | 0.022 (0.019) | 0.106 (0.058) | 0.085 (0.046) |
| All depression | 0.100 (0.076) | 0.101 (0.057) | 0.001 (0.062) |
Table 8.
Experts’ Mean (s) Treatment Benefit Estimates (AT – BT) and Difference for Asthma Profiles (n = 94) before (ATi) and after (ATf) Expert Panel
| Expert ID | Before Panel (ATi – BT) | After Panel (ATf – BT) | After – Before (ATf – ATi) |
|---|---|---|---|
| 4 | 0.217 (0.105) | 0.144 (0.079) | −0.073 (0.042) |
| 1 | 0.196 (0.106) | 0.140 (0.072) | −0.056 (0.052) |
| 13 | 0.206 (0.068) | 0.154 (0.090) | −0.054 (0.049) |
| 3 | 0.175 (0.097) | 0.130 (0.073) | −0.045 (0.042) |
| 7 | 0.142 (0.101) | 0.114 (0.070) | −0.028 (0.059) |
| 6 | 0.109 (0.083) | 0.114 (0.065) | 0.005 (0.058) |
| 5 | 0.115 (0.052) | 0.125 (0.067) | 0.010 (0.040) |
| 2 | 0.027 (0.027) | 0.082 (0.051) | 0.055 (0.044) |
| All asthma | 0.148 (0.103) | 0.125 (0.075) | −0.023 (0.063) |
Comorbidity effects.
Comorbidity effects were calculated as the change in the average treatment benefit estimate for each profile when the comorbidity was added (i.e., estimate2 – estimate1 where estimate2 corresponds to the profile with the comorbidity and estimatei without). Smoking comorbidity was evaluated for asthma, and for depression, 3 comorbidities were evaluated: alcohol dependence (AD), medical (MED), and combination alcohol dependence and medical (AD + MED). We calculated the mean comorbidity effects across profiles to represent the estimated comorbidity impacts. The impact of the medical comorbidity was near zero . However, the other 3 comorbidities were estimated to have a small and similar negative impact on treatment benefit: for smoking = –0.04 (0.03), alcohol dependence = –0.03 (0.04), and combination alcohol dependence and medical = –0.04 (0.03). Although there was some variability in these comorbidity effects according to profile, we were unable to discern any clear patterns in this variability.
DISCUSSION
This study used expert panel methodology to obtain numerical estimates of treatment benefit for 2 distinct health conditions that can be interpreted similarly on a utility scale. We were not able to directly validate the ratings in this study by comparing them with utility ratings using other methods, as the available literature that provides assessment of utility of specific major depression and asthma treatments using any rating method is so limited. However, the final estimates possess adequate face validity (i.e., the relative magnitude of benefit ratings is ordered as we would expect from the clinical literature) and minimal variability among expert raters. The low variability of the estimates reported in this study implies a high degree of consensus, which is the 1st step in establishing validity.
Although it is not possible to prove the assumption that the treatment benefit estimates for the 2 health conditions can be compared directly (i.e., that they are on the same scale), several aspects of the study design and results provide strong support for this assumption. First, a significant portion of the expert panel discussions involved the entire group of experts. In these discussions, experts shared their thoughts and impressions about the utility scale and how they used it, as well as their interpretations of the assumptions and definitions for the task and their incorporation of knowledge from the literature and their own experience. In addition, both expert groups reported back to the larger group with a summary of the decisions they made in their individual meetings. The likelihood that all experts were using the same scale was surely increased by the extensive communication across expertise during the 2-d expert panel meeting.
A 2nd aspect of our study design was the presence of 2 members of the expert panel with expertise in both conditions, which allowed us to include their ratings in calculating the mean estimates for all profiles. Comparison of these dual experts’ average asthma and depression treatment benefit estimates (across all patient groups) with those based on the 1-domain experts’ ratings revealed that the pattern of ratings was similar: In all cases, the average asthma benefit was slightly larger than the average depression estimate (difference of 0.02 for 1-domain experts’ ratings, and 0.04 and 0.02 for the dual-experts’ ratings). This similarity in rating patterns lends support to the assertion that the entire set of judgments is on the same scale.
A final aspect of our study design that can bolster this assertion is that the 1-domain experts rated a subset of profiles from the condition outside their specialty. Although these nonspecialty ratings were not incorporated into the final mean values, analyses showed substantial convergence in ratings across expertise after the expert panel, indicating a common understanding and use of the scale by all experts. Although it may be difficult to include experts with cross-condition expertise in future applications of this approach, it is straightforward to replicate the elements of cross-calibration and combined group discussions to establish some basis for comparability across conditions.
Demonstrating the validity of utility estimates for any method is challenging, given the absence of a gold standard. However, the finding that participation in the expert panel’s process of repeated judgments, feedback, and deliberations had considerable impact on experts’ AT ratings does provide preliminary support for the validity of the final treatment benefit estimates. Individual experts adjusted their AT ratings either up or down to reflect decisions made by the group informed by the evidence from the literature as interpreted by the other experts on the panel and with reference to Figure 3‘s standard for the use of the scale.
The findings regarding comorbidity effects are not conclusive. To reduce burden, the study design included a small random subset of profiles to be rated with and without comorbidities with the hope that the estimated impact of comorbidity would be fairly constant across treatments and patient groups. Unfortunately, analyses suggested that the comorbidity impacts were not constant. Although there were no clearly discernable patterns in the data, the experts did discuss and agree on some general rules for estimating these effects during the expert panel meeting. It may be possible to create rough estimates of the comorbidity effects for all profiles based on the content of these discussions to get a more complete picture, but such extrapolated estimates would have to be used cautiously.
One of the limitations to this approach is that there is no agreed-upon gold standard for utility ratings; thus, it is difficult to directly assess the external validity of these results. However, the approach used in this study has many advantages: It allows for the estimation of treatment benefit across a wide range of severity and for numerous common treatment patterns, the main elements of the approach are well-established (expert judgment and the RAND appropriateness method), and the approach used the clinical literature to inform decisions to the extent that relevant evidence was available. In addition, the utility ratings obtained from the experts were comparable to the few values available in the literature that were elicited directly from patients. In the absence of a gold standard, these aspects of the study design and results provide some evidence of external validity.
This study demonstrates that valid and comparable ratings of treatment benefit for distinct health conditions can be obtained from experts using the expert panel methodology. The replicability of such methods is an important question that has not yet been addressed. It is not unreasonable to expect that with similar levels of expertise on the panel and given the procedures and the review of the evidence base, the results would be similar, but this hypothesis should be explicitly tested as a next step in extending these methods. It is important that any such replications employ Web-based elicitation protocols with an interface similar to that used in this study (including updated summary information).
There are at least 3 additional directions for future research. The 1st involves conducting similar studies to obtain treatment benefit estimates for other health conditions as well as for children and adolescents. The 2nd takes the next step in using the treatment benefit estimates to evaluate the quality of usual care for major depression and asthma by applying benefit estimates to patterns of care observed in medical records and comparing benefit with costs. Members of our study team have already conducted analyses that apply depression treatment benefit estimates derived from these expert ratings (ATf – NHf) to treatment episode costs from claims data and report cost/health value ratios for common depression treatments.34 By having information on the value as well as costs of routine practice and best practice, we hope to be able to identify ways in which quality improvement efforts could have the most impact for a given cost. A 3rd direction of future research pertains to the expert panel approach itself; if the expert panel methodology is to be widely adopted for use in producing treatment benefit estimates, it would be important to conduct research on the validity of the expert panel method. For example, a validity study could apply this methodology to a topic on which there has already been a major cost-effectiveness analysis done (or is about to be done, so that the expert panel members are not already familiar with the results). Under these conditions, one could determine whether the competing methods are consistent and/or complementary. Similarly, it would also be interesting to study whether the validity of expert panel utility assessments can be improved with different rating approaches or informational inputs.
Acknowledgments
This work was funded by a subcontract from the John D. and Catherine T. MacArthur Foundation Network on Mental Health Policy Research. Funds from National Institute of Mental Health R01 MH628028 (R. Frank, principal investigator) also contributed to this effort. The authors would also like to thank the 13 expert panelists who participated in this study: Mark S. Dykewicz, Alan M. Gruenberg, Wayne Katon, M. Colleen Lum Lung, Jeanne Miranda, Harold Nelson, Stephen P. Peters, Mark Rapaport, Donald P. Tashkin, Madhukar Trivedi, Christine Waldman-Wagner, John Williams, and Barbara Yawn, as well as the many expert panelists who participated in pilot studies.
REFERENCES
- 1.Institute of Medicine. Crossing the Quality Chasm: A New Health System for the 21st Century. Washington (DC): National Academy Press; 2001. [PubMed] [Google Scholar]
- 2.McGlynn EA, Asch SM, Adams J, et al. The quality of health care delivered to adults in the United States. N Engl J Med. 2003;348(26):2635–45. [DOI] [PubMed] [Google Scholar]
- 3.Gold MR, Siegel JE, Russell LB, Winstein MC. Cost-effectiveness in Health and Medicine. New York: Oxford University Press; 1996. [Google Scholar]
- 4.Gafni A, Birch S. Preferences for outcomes in economic evaluation: an economic approach to addressing economic problems. Soc SciMed. 1995;40(6):767–76. [DOI] [PubMed] [Google Scholar]
- 5.Mehrez A, Gafni A. Quality-adjusted life years, utility theory, and healthy-years equivalents. Med Decis Making. 1989;9(2):142–9. [DOI] [PubMed] [Google Scholar]
- 6.Mehrez A, Gafni A. Healthy-years equivalents versus quality-adjusted life years: in pursuit of progress. Med Decis Making. 1993; 13(4):287–92. [DOI] [PubMed] [Google Scholar]
- 7.Badia X, Monserrat S, Roset M, Herdman M. Feasibility, validity and test-retest reliability of scaling methods for health states: the visual analogue scale and the time trade-off. Qual Life Res. 1999;8(4):303–10. [DOI] [PubMed] [Google Scholar]
- 8.Ubel PA, Loewenstein G, Scanlon D, Kamlet M. Individual utilities are inconsistent with rationing choices: a partial explanation of why Oregon’s cost-effectiveness list failed. Med Decis Making. 1996;16(2):108–16. [DOI] [PubMed] [Google Scholar]
- 9.Ubel PA, Nord E, Gold M, Menzel P, Prades JL, Richardson J. Improving value measurement in cost-effectiveness analysis. Med Care. 2000;38(9):892–901. [DOI] [PubMed] [Google Scholar]
- 10.Sherbourne CD, Unutzer J, Schoenbaum M, et al. Can utility-weighted health-related quality-of-life estimates capture health effects of quality improvement for depression? Med Care. 2001; 39(11):1246–59. [DOI] [PubMed] [Google Scholar]
- 11.Tengs TO, Wallace A. One thousand health-related quality-of-life estimates. Med Care. 2000;38(6):583–637. [DOI] [PubMed] [Google Scholar]
- 12.Fryback DG, Lawrence WF, Martin PA, Klein R, Klein BE. Predicting quality of well-being scores from the SF-36: results from the Beaver Dam health outcomes study. Med Decis Making. 1997; 17(1):1–9. [DOI] [PubMed] [Google Scholar]
- 13.Brazier J, Usherwood T, Harper R, Thomas K. Deriving a preference-based single index from the UK SF-36 health survey. J Clin Epidemiol. 1998;51(11):1115–28. [DOI] [PubMed] [Google Scholar]
- 14.Linstone HA, Turoff M. The Delphi Method: Techniques and Applications. Reading (MA): Addison-Wesley; 1975. [Google Scholar]
- 15.Allen J, Dyas J, Jones M. Building consensus in health care: a guide to using the nominal group technique. Br J Community Nurs. 2004;9(3):110–4. [DOI] [PubMed] [Google Scholar]
- 16.Carson C, Giuliano F, Goldstein I, et al. The “effectiveness” scale—therapeutic outcome of pharmacologic therapies for ED: an international consensus panel report. Int J Impot Res. 2004; 16(3):207–13. [DOI] [PubMed] [Google Scholar]
- 17.Fitch K, Bernstein SJ, Aguilar MD, et al. The RAND/UCLA Appropriateness Method User’s Manual. Santa Monica (CA): RAND; 2001. [Google Scholar]
- 18.Shekelle P The appropriateness method. Med Decis Making. 2004;24(2):228–31. [DOI] [PubMed] [Google Scholar]
- 19.Tobacman JK, Scott IU, Cyphert ST, Zimmerman MB. Comparison of appropriateness ratings for cataract surgery between convened and mail-only multidisciplinary panels. Med Decis Making. 2001;21(6):490–7. [DOI] [PubMed] [Google Scholar]
- 20.Kahan JP, van het M. Loo Defining appropriate health care. Eurohealth. 1999;5(3):16–18. [Google Scholar]
- 21.Broder MS, Kanouse DE, Mittman BS, Bernstein SJ. The appropriateness of recommendations for hysterectomy. Obstet Gynecol. 2000;95(2):199–205. [DOI] [PubMed] [Google Scholar]
- 22.Coulter I, Adams A, Shekelle P. Impact of varying panel membership on ratings of appropriateness in consensus panels: a comparison of a multi- and single disciplinary panel. Health Serv Res. 1995;30(4):577–91. [PMC free article] [PubMed] [Google Scholar]
- 23.Normand SL, Frank RG, McGuire TG. Using elicitation techniques to estimate the value of ambulatory treatments for major depression. Med Decis Making. 2002;22(3):245–61. [DOI] [PubMed] [Google Scholar]
- 24.Quitkin FM, Stewart JW, McGrath PJ, et al. Are there differences between women’s and men’s antidepressant responses? Am J Psychiatry. 2002;159(11):1848–54. [DOI] [PubMed] [Google Scholar]
- 25.Hildebrandt MG, Steyerberg EW, Stage KB, Passchier J, Kragh-Soerensen P. Are gender differences important for the clinical effects of antidepressants? Am J Psychiatry. 2003;160(9):1643–50. [DOI] [PubMed] [Google Scholar]
- 26.Hess AL. The relationship between gender, lifetime number of depressive episodes, treatment type, and treatment responses in chronic depression. DAI. 1999;61(01B):148. [Google Scholar]
- 27.Zlotnick C, Elkin I, Shea MT. Does the gender of a patient or the gender of a therapist affect the treatment of patients with major depression? J Consult Clin Psychol. 1998;66(4):655–9. [DOI] [PubMed] [Google Scholar]
- 28.Hasin DS, Tsai WY, Endicott J, Mueller TI, Coryell W, Keller M. Five-year course of major depression: effects of comorbid alcoholism. J Affect Disord. 1996;41(1):63–70. [DOI] [PubMed] [Google Scholar]
- 29.Koike AK, Unutzer J, Wells KB. Improving the care for depression in patients with comorbid medical illness. Am J Psychiatry. 2002;159(10):1738–45. [DOI] [PubMed] [Google Scholar]
- 30.Althuis MD, Sexton M, Prybylski D. Cigarette smoking and asthma symptom severity among adult asthmatics. J Asthma. 1999;36(3):257–64. [DOI] [PubMed] [Google Scholar]
- 31.Ulrik CS, Lange P. Cigarette smoking and asthma. Monaldi Arch Chest Dis. 2001;56(4):349–53. [PubMed] [Google Scholar]
- 32.American Psychiatric Association. Diagnostic and Statistical Manual of Mental Disorders. 4th ed. Washington (DC): American Psychiatric Association; 1994. [Google Scholar]
- 33.National Asthma Education and Prevention Program. Expert Panel Report 2: Guidelines for the Diagnosis and Management of Asthma. Washington (DC): National Institutes of Health; 2002. [Google Scholar]
- 34.Watkins KE, Burnam MA, Edelen MO, Escarce JJ, Huskamp HA, Goldman HH. The Health Value and Cost of Care for Major Depression. Value in Health. In press. [DOI] [PubMed] [Google Scholar]
- 35.McClellan M, Brook RH. Appropriateness of care: a comparison of global and outcome methods to set standards. Med Care. 1992;30(7):565–86. [PubMed] [Google Scholar]
- 36.Valenstein M, Vijan S, Zeber JE, Boehm K, Buttar A. The cost-utility of screening for depression in primary care. Ann Intern Med. 2001;134(5):345–60. [DOI] [PubMed] [Google Scholar]
- 37.Rutten-van Molken, Custers F, Van Doorslaer EKA, Jansen CCM, Heurman L Comparison of performance of four instruments in evaluating the effects of salmeterol on asthma quality of life. Eur Respir J. 1995;8(6):888–98. [PubMed] [Google Scholar]
- 38.Blumenschein K, Johannesson M. Relationship between quality of life instruments, health state utilities, and willingness to pay in patients with asthma. Ann Allergy Asthma Immunol. 1998;80(2):189–94. [DOI] [PubMed] [Google Scholar]
- 39.Morton SC, Kominski GF, Kahan JP. An examination of the Resource-Based Relative Value Scale cross-specialty linkage method. Med Care. 1994;32(1):25–39. [DOI] [PubMed] [Google Scholar]