Abstract
Nucleases are important enzymes that cleave nucleic acids and play critical roles in DNA repair, immune defense and potentially in cancer invasion. However, their spatial dynamics at subcellular level is much less studied. Here, we developed a surface‐tethered nuclease sensor (SNS) which directly converts membrane‐bound nuclease (MN) activity to fluorescent signal, therefore, mapping MN activity on cell adhesion sites with high resolution and sensitivity. With SNS, we studied MN activity on the ventral membrane of cancer cells, where MN activity initially occurs in punctate regions and advances in a coral‐shaped pattern. In six tested cell‐lines, the MN activity levels in cancer cells are significantly higher than those in non‐cancer cells. We then tested SNS as a sensitive approach to detect cancer cells at single cell level. Single breast cancer cells were successfully detected from thousands of adherent non‐cancer cells and from millions of non‐adherent blood cells.

Keywords: cancer cell detection, circulating tumor cell, clustered nuclease activity, membrane‐bound nuclease, nuclease optical sensor
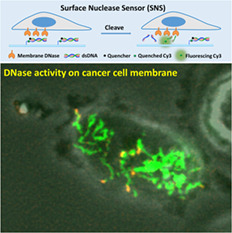
Surface nuclease sensor (SNS) was developed to image DNase activity on cell membrane. SNS revealed that DNase activity on breast cancer cell membrane is spatially organized in a coral‐shaped pattern. Owing to this distinct spatial pattern, SNS was successfully applied to detecting single breast cancer cells from a large group of non‐cancer cells, demonstrating that SNS has great potential in cancer cell detection at the single cell level.
1. INTRODUCTION
Nucleases comprise a large family of enzymes that cleave polynucleotides. They contribute to DNA replication and repair, and are also involved in cell waste management. While some of nucleases are soluble proteins found inside cells or secreted to cell solution, other nucleases such as DNase X are bound to cell membrane 1, 2. The soluble nucleases have been extensively studied and exploited in research 3, 4, 5. Among them, the restriction endonucleases with DNA sequence specificity are one of most important genetic tools used in molecular and cellular biology. Soluble nucleases without sequence specificity, such as DNase I and II are also commonly used in DNA manipulation 6, 7. Previously, solution‐based nuclease sensors have been developed to report enzymatic activity of nucleases and applied to detect cancer cells that express elevated soluble nucleases 8, 9 or to detect bacterial infection 10. However, these sensors cannot provide the spatial information of nuclease activity at the subcellular level.
In contrast to the well‐studied soluble nucleases, membrane‐bound nucleases (MN) are less investigated but steadily gaining research interests. MN is tethered on the cell membrane through glycosylphosphatidylinositol anchor. Studies show that MN protects the host cells from exogenous gene invasion 1. It was also hypothesized that cancer cells may use MN to degrade extracellular DNA in the matrix and promote cancer metastasis. Many physiological functions of MN are still unknown and awaits further investigation. Optical sensor that can report the temporal and spatial dynamics of MN activity on the cell membrane is therefore dearly desired.
To investigate the spatial dynamics of MN activity on the cell membrane at the single cell level, we developed a surface‐tethered nuclease sensor (SNS). SNS is a fluorophore (here Cy3) linked with a biotin tag and a short double‐stranded DNA (dsDNA) serving as the substrate for degradation by nucleases. The dsDNA is labeled with a quencher that quenches the fluorophore in the proximity. In application, SNS is tethered by the biotin on a neutravidin‐presenting surface. MN on the ventral membrane of cells adhering on such surface would degrade the dsDNA of SNS and free the fluorophore from quenching. Therefore, the MN enzymatic activity on the cell membrane is reported by fluorescence and its spatial distribution and dynamics can be directly mapped by fluorescence imaging.
With SNS, we reported for the first time the spatial distribution and dynamics of MN activity in live cells. We found that MN activity, instead of being diffusive or homogeneous, is spatially organized in a coral‐shaped pattern. This remarkable pattern is different from the structures of other commonly known cell adhesion complexes such as focal adhesions 11, podosomes 12 or invadopodia 13, suggesting there is a yet unknown mechanism regulating the MN transportation and clustering on the cell membrane. Because of the unique MN activity pattern in cancer cells, we tested using SNS‐coated surfaces to detect and identify cancer cells in a large background of non‐cancer cells or blood cells.
2. MATERIALS AND METHODS
2.1. Synthesis of SNS
We customized the sequence and modification of the dsDNA in SNS. One strand was conjugated with a Cy3 dye and a biotin tag at the 5′ end. The other strand was conjugated with a black hole quencher 2 (BHQ2) at the 3′ end. The design of these two strands was sent to Integrated DNA Technologies for DNA synthesis. After synthesis, the two strands were annealed at a molar ratio of 1.2:1 and stored at 4°C for use in experiments.
Sequence one: 5′‐/BiosG//iCy3/ATG CTG AGG TCG CCG CCC/‐3′.
Sequence two: 5′‐/GGG CGG CGA CCT CAG CAT/BHQ2/‐3′.
2.2. SNS immobilization on a glass surface
SNS was immobilized on a glass surface through biotin‐neutravidin interaction. First, 100 μg/mL BSA‐biotin (Bovine serum albumin labeled by biotin, A8549, Sigma‐Aldrich, MO, USA) and 5 μg/mL fibronectin were incubated on a glass‐bottom petri dish (D35‐14‐1.5‐N, in vitro Scientific, CA, USA) for 30 min. BSA‐biotin and fibronectin were physically adsorbed on the glass surface. Fibronectin was coated on the surface to assist cell adhesion. The surface was rinsed by PBS (phosphate buffered saline) three times. Next, the glass surface was incubated with 50 μg/mL neutravidin (31 000, ThermoFisher Scientific, MA, USA) for 30 min and rinsed by PBS three times. Finally, the glass surface was incubated with 0.1 μM SNS for 30 min and rinsed with PBS three times. At this stage, the glass surface was ready for cell plating and MN activity mapping. The SNS was immobilized on the surface through the linkage: Glass:BSA‐biotin:neutravidin:biotin‐SNS.
2.3. Detecting soluble nuclease (DNase I) with SNS
SNS‐coated glass‐bottom dishes were prepared according to the procedure described in Section 2.2. Soluble nuclease DNase I (89836, ThermoFisher Scientific, MA, USA) solutions at a series of concentrations were added to SNS‐coated Petri dishes. For each dish, time‐lapse fluorescence imaging was performed to monitor the fluorescence level increase of SNS due to dsDNA degradation by DNase I. Detection limit for DNase I concentration was evaluated based on the SNS response curves to the series of DNase I treatments at different concentrations.
2.4. Cell culture and cell plating
Three cancer cell‐lines (MDA‐MB‐231, MTLn3, MTC) and three non‐cancer cell‐lines (CHOK‐1, MDCK, NIH 3T3) were used in SNS assays. MDA‐MB‐231, MTLn3 and MDCK cells were cultured in Dulbecco's modification of eagle medium (DMEM) with 10% FBS and 1% penicillin/streptomycin. MTC cells were cultured with DMEM with 5% FBS and 1% penicillin/streptomycin, 1% glutaMax (65050‐061, ThermoFisher Scientific, MA, USA). CHO‐K1 cells were cultured in F‐12 K medium (30–2004, ATCC company, VA, USA) spiked with 10% FBS and 1% streptomycin/penicillin. CHO‐K1 cells stably transfected with H2B‐YFP were cultured in the F‐12 K medium spiked with 10% FBS and 10 μg/ml Blasticidin. NIH 3 T3 cells were cultured in DMEM with 10% FCS and 1% streptomycin/penicillin. All the cells at a confluence of 60–90% were used in the experiments.
In SNS experiments, cells were washed with EDTA solution [recipes: 100 mL 10 X HBSS +10 mL 1 M HEPES (PH7.6) + 10 mL 7.5% sodium bicarbonate +2.4 mL 500 mM EDTA +1 L H2O] twice and incubated in this solution in a cell incubator for 10 min. The cells were then pipetted off from the Petri dish surface and transferred into a 1.5 mL tube. The cell solution was centrifuged at 300g for 3 min. Cell pellet was re‐suspended with DMEM spiked with 10% FBS (fetal bovine serum), and plated and incubated on the SNS surface for 1.5 h. Strong cell detaching reagents such as trypsin should not be used for cell detachment because trypsin damages cell membrane proteins and would likely deactivate MN activity.
2.5. Confirming co‐localization of SNS signal and DNase X in MDA‐MB‐231 cells
MDA‐MB‐231 cells were plated on an SNS‐coated glass surface and incubated at 37 °C for 2 h. Next, the cells were fixed with 4% paraformaldehyde for 20 min and blocked with 3% BSA for 1 h, followed by the staining of primary antibody anti‐DNase X (H00001774‐M02, Abnova, Taiwan) with 1:100 dilution. The cells were then treated with secondary antibody (AP192SA6, Millipore, MA, USA) with 1:200 dilution for 1 h, Immunostained cell samples were observed under Nikon Ti‐E microscope, with Cy3 channel for SNS signal and GFP channel for DNase X staining. During the immunostaining process, the cell membrane was not permeablized to avoid staining cytosolic DNase X that may cloud the imaging of membrane‐bound DNase X.
2.6. siRNA interference of DNase X expression
MDA‐MB‐231 cells in 48‐well plate were transfected with 10 nM DNase X siRNA (sc‐77 165, Santa Cruz Biotechnology, TX, USA) with Lipofectamine RNAiMAX (13 778 100, Thermo Fisher Scientific, MA, USA). After 24 h, the transfected cells and control group cells were plated on SNS‐coated petri‐dishes and incubated in an incubator for 2 h to verify the MN activity on the cell membrane. DNase X immunostaining was performed to examine the expression level of DNase X on the cell membrane. Fifty cells were selected in each condition and the fluorescence intensity per cell was calculated for cells with or without siRNA interference.
2.7. Detecting single breast cancer cells from a large number of non‐cancer adherent cells
Breast cancer cells (MDA‐MB‐231) were mixed with non‐cancer cells (CHO‐K1 transfected with H2B‐YFP) with a ratio of 1:3000. The cell mixture was plated on SNS coated dish and incubated at 37 °C for 1.5 h. Fluorescence imaging was then performed to search for the coral‐shaped fluorescent pattern on the SNS surface.
2.8. Detecting single breast cancer cells from a large number of non‐adherent blood cells
Breast cancer cells (MDA‐MB‐231) were mixed with canine whole blood diluted by 10 fold to simulate circulating tumor cells in blood samples. The canine blood was drawn from healthy dogs with approval from Iowa State University's Institutional Animal Care and Use Committee (Log #:1‐17‐8417‐BK). For each experiment, 2 mL blood was drawn in a syringe containing 0.2 mL Acid Citrate Dextrose (ACD) buffer (85.3 mM sodium citrate, 41.6 mM citric acid, 136 mM glucose). The blood sample was then transferred in to a 15‐ml falcon tube containing 2 mL buffered saline glucose citrate (BSGC: 129 mM NaCl, 14 mM trisodium citrate, 11 mM glucose, 10 mM NaH2PO4, pH 7.3). The whole blood was diluted with cell culture medium DMEM at a ratio of 1:10 and then mixed with breast cancer cell MDA‐MB‐231 cells. The cell mixture was re‐plated on an SNS coated dish and incubated at 37 °C for 1.5 h. Fluorescence imaging was then performed to search for the coral‐shaped fluorescent pattern on the surface.
3. RESULTS AND DISCUSSIONS
3.1. SNS reports both solution‐based and surface‐based nuclease activities
The SNS is a Cy3 dye linked with a biotin and an 18 base paired (bp) dsDNA as shown in Figure 1A. The dsDNA is labeled with a quencher (BHQ2) that is in proximity to the Cy3 and quenches its fluorescence. When the dsDNA is cleaved by nucleases, the Cy3 is freed from quenching but still remains immobilized on the surface. Therefore, the local nuclease activity is faithfully reported by the fluorescence signal on site. To confirm the ability of SNS in reporting nuclease activity, we prepared SNS surfaces and tested them with soluble nuclease DNase I at concentrations of 0, 0.05, 0.2, 1, 2, 10 and 20 unit/ml. Time‐lapse imaging was performed to monitor the fluorescence levels of SNS surfaces in response to the treatment of solution‐based DNase I. Multiple fluorescence response curves were acquired and they clearly demonstrated that the SNS surfaces were responsive to DNase I treatment (Figure 1B). The initial rate of fluorescence increase is approximately proportional to the concentration of DNase I. DNase I at 20 unit/mL was shown to be saturating and depleted SNS after 10 min. The fluorescence intensity is around 7000 A.U. (arbitrary unit, the grayscale of the fluorescence image). Because the initial fluorescence level is around 480, the quenching efficiency of the BHQ2 to Cy3 in SNS is evaluated to be 1 – 480/7000 – 93% , which is close to the Cy3‐BHQ2 contact quenching efficiency 14. To evaluate the detection limit for DNase I, we compared the reaction curves of SNS to DNase I at 0.05 unit/mL and to control buffer (PBS) (Figure 1C). At 10 min after treatment, SNS signal was increased by 0.05 unit/mL DNase I by 30.2 (evaluated by linear fitting), while SNS signal of the control sample slightly decreased by 5.6 likely due to photo‐bleaching. SNS signal also has fluctuation which might be caused by the noises contributed by the light source and the camera. The SD of the SNS signal of control is calculated to be 3.6. Therefore, the signal‐to‐noise ratio of a SNS surface in response to 0.05 unit/mL DNase is evaluated to be 30.2/3.6 = 8.3. Collectively, we estimated that the detection limit of a SNS surface for solution‐based DNase I is about 0.01 unit/mL (rounding 0.05/8.3 to 0.01). This detection limit is comparable to that of commercial solution‐based nuclease sensor DNaseAlert QC System (AM1970, Thermofisher Scientific), which has a detection limit of 0.005 unit/mL for DNase I 15.
Figure 1.
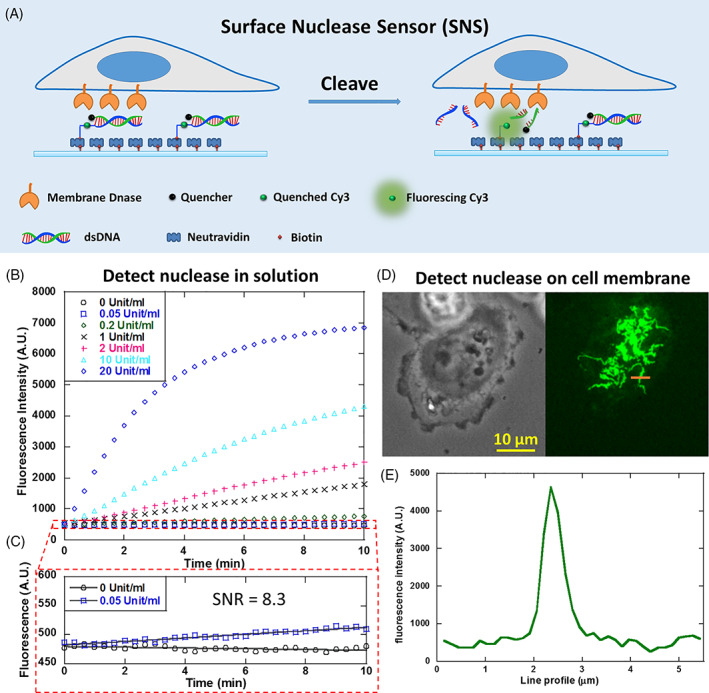
Developing surface‐tethered nuclease sensor (SNS) for the in situ mapping of membrane‐bound nuclease (MN) activity on the cell membrane. (A) SNS is a fluorophore (here Cy3) conjugated with a biotin and a quencher‐labeled dsDNA. The fluorophore is freed from quenching when the dsDNA is degraded by MN, thus reporting the MN activity by fluorescence on site. (B) SNS‐coated surface reported DNase I in solution at a series of concentrations. (C) The detection limit for soluble DNase I by SNS is calibrated to be 0.01 unit/mL (rounding 0.05/8.3‐0.01). (D) An SNS‐coated surface reported highly organized MN activity on the ventral membrane of adherent MDA‐MB‐231 cells. (E) The structure feature of the SNS pattern is finer than 1 μm
The main advantage of SNS compared to solution‐based nuclease sensors is its capability of mapping the spatial distribution of MN activity in live cells and in real time. Here, we applied SNS to the mapping of MN activity on the ventral cell membrane of adherent cells. MDA‐MB‐231 cell‐line was selected for the test because previous research suggested that this cell‐line may express MN on the membrane 16, although the nuclease was not identified and its spatial dynamics was unknown. In our test, MDA‐MB‐231 cells were plated on a surface coated with SNS and fibronectin and incubated for 1 hour. Fluorescence imaging shows that the cells produced remarkable fluorescent pattern with distinctive feature on the SNS surface (Figure 1D,E), suggesting that the MN activity is highly organized on the ventral membrane of adherent MDA‐MB‐231 cells. The MN activity generally appears in a coral‐shaped pattern with multiple branches radiating from cell centers. The width of the branches can be less than 1 μm (Figure 1E). This pattern is remarkably unique and clearly different from those of other well‐known cell adhesion structures, such as focal adhesions, podosomes or invadopodia, which appear in shapes of straight streaks or dots. Therefore, for the first time, SNS revealed that the MN activity in MDA‐MB‐231 cells is spatially organized in a unique pattern at the cell‐substrate interface. The molecular mechanism and physiological role of this MN spatial organization remain unknown and await further investigation.
3.2. Characterization of the spatial dynamics of MN activity
To reveal the temporal dynamics of the MN activity pattern in live cells, time‐lapse imaging was performed on SNS surface after cells were plated. The microscope is enclosed in a thermal chamber maintaining 37 °C temperature and 5% CO2. Cells were imaged in both phase contrast (PH) channel and Cy3 fluorescence channel (SNS channel) at 1 frame/min. Real‐time SNS was computed by subtracting previous frame of SNS image from current frame to report the MN activity in latest 1 minute. PH, SNS, real‐time SNS and merged images are presented in Supporting Information movies S1–S3 and Figure 2A, with SNS presented in green and real‐time SNS presented in red. Total SNS signal intensity produced by cells is calculated and plotted vs time in Figure 2B. The plot shows that MN is most active in 2–10 min after cell adhesion during which the slope of the curve is larger than that in other time ranges.
Figure 2.
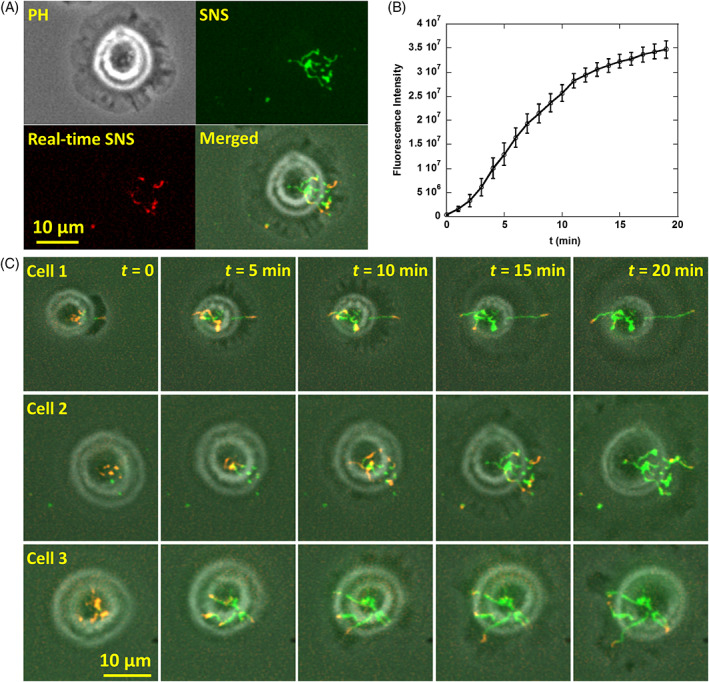
Dynamics of MN activity in breast cancer cells. (A) MDA‐MB‐231 cells and MN activity were imaged in phase contrast (PH) and Cy3 channel (green), respectively. The real‐time SNS signal (red) is SNS signal produced in the latest frame interval (1 min), reporting the MN activity newly produced by cells. (B) Fluorescence intensity of SNS signals vs cell adhesion time. (C) Time‐series images of three representative MDA‐MB‐231 cells on SNS surfaces. These cells show common spatial features of the MN activity which exhibits a distinctive coral‐shaped pattern. Refer to movies S1 to S3
The time‐series images of SNS signals in three representative cells are displayed in Figure 2C. Some characteristic features of the MN activity pattern are revealed by these images. Upon cell adhesion, MN are usually active in a few punctate regions. Starting from these puncta, MN activity continuously meanders towards cell outer regions and the trajectory forms radiating lines. Interestingly, the tips of those lines have a tendency to follow the margin of cell protrusion sites. In the end, the MN activity map exhibits a coral‐shaped pattern with branches growing from the cell center.
3.3. Identification of MN in MDA‐MB‐231 cells
Because DNase X has been characterized to be one of MNs 1, we tested if DNase X is the MN producing SNS signal in MDA‐MB‐231 cells. Two approaches were adopted to confirm the existence of DNase X on MDA‐MB‐231 cells. First, immunostaining using antibody against DNase X showed the co‐localization of DNase X and SNS signal pattern (Figure 3A‐B), suggesting that DNase X indeed participates in the MN activity of MDA‐MB‐231 cells. During immunostaining, cell membrane was not permeabilized to specifically target DNase X on cell membrane. On some regions, SNS signal was positive but immunostaining reported weak DNase X signal. This is likely due to the fact that antibody may not reach the regions where cell membrane tightly adhered on the surface and excluded antibody from entering the membrane‐substrate gap. Next, siRNA interference was performed to inhibit the expression of DNase X in MDA‐MB‐231 cells. Both SNS signal and DNase X expression level in the cells treated with siRNA was significantly reduced (Figure 3C‐E), suggesting that the DNase X is the main active MN on the membrane of MDA‐MB‐231 cells.
Figure 3.
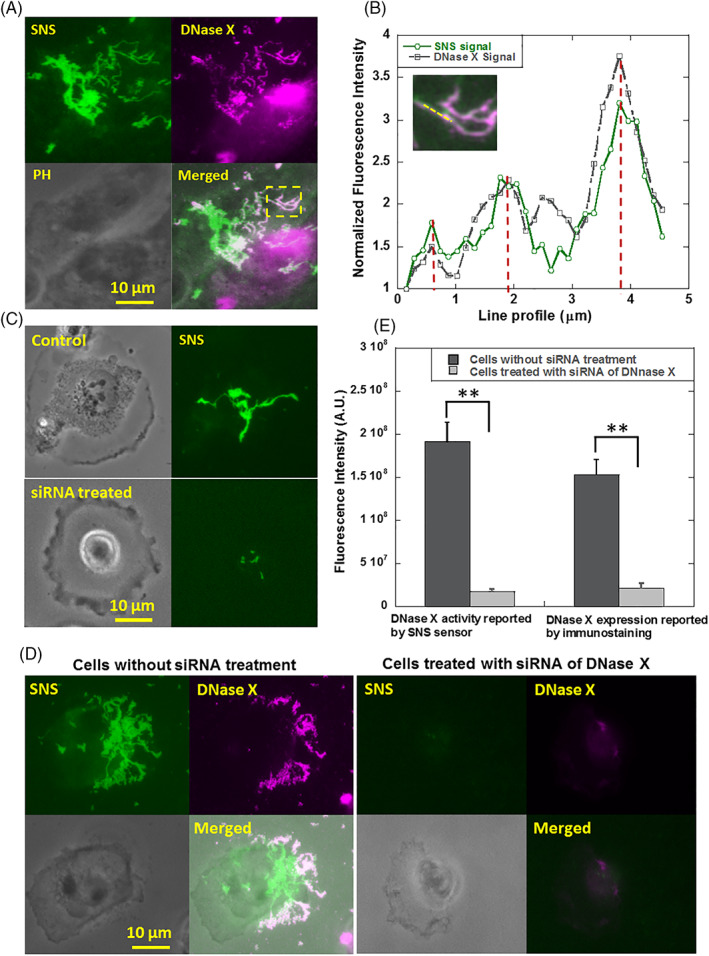
The MN in MDA‐MB‐231 cells was identified as DNase X. (A) Images of MN activity and cell structure immunostained by anti‐DNase X. (B). Line profile analysis of the images (marked by a yellow line) shows the co‐localization of MN activity and DNase X. (C) MN activities in control cells and cells treated with siRNA of DNase X. (D) MN activity and DNase X expression level in MDA‐MB‐231 cells reported by SNS sensor and DNase X immunostaining, respectively. Cells were pre‐treated with siRNA of DNase X. The control group of cells were treated with transfection reagent without siRNA. (E) Treatment with siRNA of DNase X significantly reduced both MN activity and DNase X expression level on the cell membrane
3.4. MN activity in three non‐cancer cell‐lines and three cancer cell‐lines
Previous studies suggested that the elevated expression and activity of nucleases in bodily fluids or tissues are closely related to carcinogenesis, progression and prognosis of various cancers 9, 17. Here we tested if cancer cells exhibit higher MN activity. Three non‐cancer cell‐lines (CHO‐K1, MDCK and NIH 3 T3) and three cancer cell‐lines (MTC, MTLn3 and MDA‐MB‐231) were tested. All cells were incubated on SNS surfaces for 1 hour before cell imaging. Typical SNS patterns of these six cell‐lines are presented in Figure 4A. The SNS signal intensities are calculated and plotted in Figure 4B. It is clear that MN activities among different cell‐lines vary significantly. The three non‐cancer cell‐lines have much lower MN activity than the three cancer cell‐lines. Although six cell‐lines are not enough to provide conclusive evidence to show that cancer cells have elevated MN activities, these experiments suggest that MN activity is potentially correlated with the nature of cancer cells. Because of the elevated MN activity, and in particular, the distinctive MN activity pattern, SNS has the potential to detect and identify cancer cells from background cells by reporting the characteristic MN activity pattern.
Figure 4.
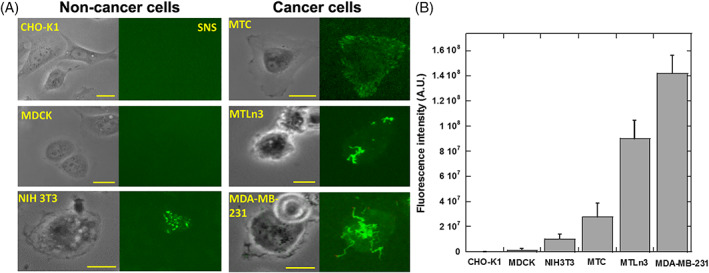
MN activities in non‐cancer cells and cancer cells. (A) Six cell‐lines were tested on SNS surfaces. CHO‐K1, MDCK and NIH 3 T3 cells are non‐cancer cells. MTC, MTLn3 and MDA‐MB‐231 cells are cancer cells. (B) MN activity in the six cell‐lines. Cancer cells generally have stronger MN activities compared to non‐cancer cells. MDA‐MB‐231 cells have the strongest MN activity and the MN activity map has the most prominent coral‐shaped pattern. Scale bar: 20 μm
3.5. Detect cancer cells from a large number of non‐cancer cells using SNS surfaces
Early and reliable detection of circulating tumor cells (CTCs) in patient blood samples is a promising means to report the metastatic spread 18 and assess the efficacy of cancer therapy 19, 20. Methods such as microfluidics and chips, antibody‐supported flow cytometry 21, and nano‐roughened glass surface 22 have been tested for CTC capture and detection. However, the robustness, and ease of implementation of current CTC tests are still insufficient for being adopted in clinical practice 8. Because cancer cells exhibit distinctive MN activity map, here we tested the MN activity map reported by SNS as a sensitive and simple‐to‐use assay for CTC detection and identification.
Two types of cell solutions were prepared to simulate the CTC samples. First, we tested the capability of SNS in detecting cancer cells from a large background of adherent non‐cancer cells. Cancer cells (MDA‐MB‐231) were mixed with CHO‐K1 cells at a ratio of 1:3000. The CHO‐K1 cells have been stably transfected with H2B‐YFP (Histone protein in cell nucleus) with a transfection rate of 100% with antibiotic selection. Therefore CHO‐K1 cells and MDA‐MB‐231 can be pre‐identified by checking YFP signal in cell nucleus. The cell mixture was plated on an SNS surface and incubated for 1 h at 37°C. Both CHO‐K1 cells and MDA‐MB‐231 cells adhered but only MDA‐MB‐231 cells produced MN activity map on the SNS surface. Imaging in Cy3 and YFP channels was performed to report the MN activity map and H2B‐YFP in nucleus of CHO‐K1 cells, respectively, as shown in Figure 5A. Based on the MN activity map, we successfully detected MDA‐MB‐231 cells in high consistency with the result of cell pre‐identification by YFP imaging. Based on single cells, the false negative rate (MDA‐MB‐231 cells showing no MN activity) is 23%, false positive rate (CHO‐K1 cells showing MN activity or SNS fluorescence signal) is 0.1% and 77% MDA‐MB‐231 cells are successfully detected (Figure 5B). Therefore, false positive rate is very low in the test. The false negative rate is relatively high for single cells, but that is caused by the heterogeneity of the cancer cells in MN expression, not due to the biosensor's limitation. The false negative rate can be exponentially decreased by increasing the number of tested cancer cells. For example, if there are 3 MDA‐MB‐231 cells tested, the probability of that all of these cells show negative SNS signal is 0.233 = 0.012, and the success rate to confirm the existence of cancer cells is 1–0.012 = 98.8%. Therefore, the MN activity tests based on single cells requires very low number of cells to report the existence of breast cancer cells.
Figure 5.
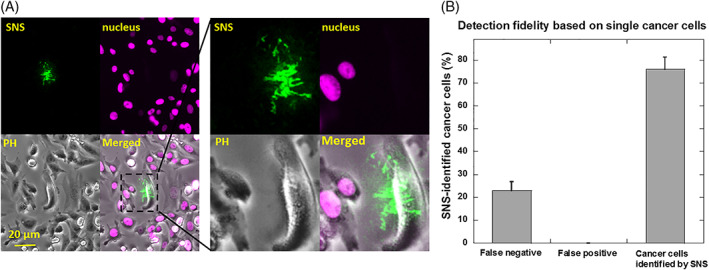
Detecting breast cancer cells from non‐cancer adherent cells using SNS. (A) MDA‐MB‐231 cells and CHO‐K1 cells were mixed at a ratio of 1:3000 and plated on a SNS surface. CHO‐K1 cells were stably transfected with H2B‐YFP in nucleus and can be identified by YFP imaging. Cells were imaged in Cy3, YFP and PH channels. (B) False negative rate (MDA‐MB‐231 cells showing no SNS signal), false positive rate (CHO‐K1 cells showing false SNS signal) and positive rate (MDA‐MB‐231 cells showing SNS signal) for breast cancer cell detection are 23%, 0.1% and 77%, respectively. Note that this evaluation is based on single cells. With multiple MDA‐MB‐231 cells, the false negative rate would be 0.23N with N as the number of MDA‐MB‐231 cells (0.23N is the probability of that none of the N cells shows SNS signal)
3.6. Detect cancer cells from a large number of blood cells using SNS surfaces
The SNS surface is even more efficient in detecting breast cancer cells in blood samples because the majority of the blood cells are red blood cells which are non‐adherent. SNS surface spiked with fibronectin would pull down breast cancer cells and report them on site while the red blood cells contribute nearly zero non‐specific fluorescence signal and do not occupy SNS surface for cell adhesion either. To demonstrate the efficiency of SNS in cancer cell detection in blood samples, we created artificial blood sample by mixing breast cancer cells with canine whole blood. About 100 MDA‐MB‐231 cells were added into 200 μL 10‐fold diluted blood sample (about 100 million red blood cells). The blood sample was plated and incubated on a SNS surface. By imaging over about 1 cm2 area of the incubation well in the Cy3 channel, we found tens of MN maps that were produced by MDA‐MB‐231 cells and therefore detected cancer cells in the blood sample with a cell ratio of 1:106 between cancer cells and blood cells (Figure 6A‐C). This detection process was enabled by the high signal‐to‐background noise ratio (SNR = 66.9, Figure 6D) of MN maps against the dark fluorescence background of SNS surface. Because of the extremely low non‐specific fluorescent signal, MN maps produced by cancer cells can be conveniently identified either by researchers or by computer code. We expect that an automated image‐scanning and image‐analysis system would further improve the efficiency of cancer cell detection using SNS sensor.
Figure 6.
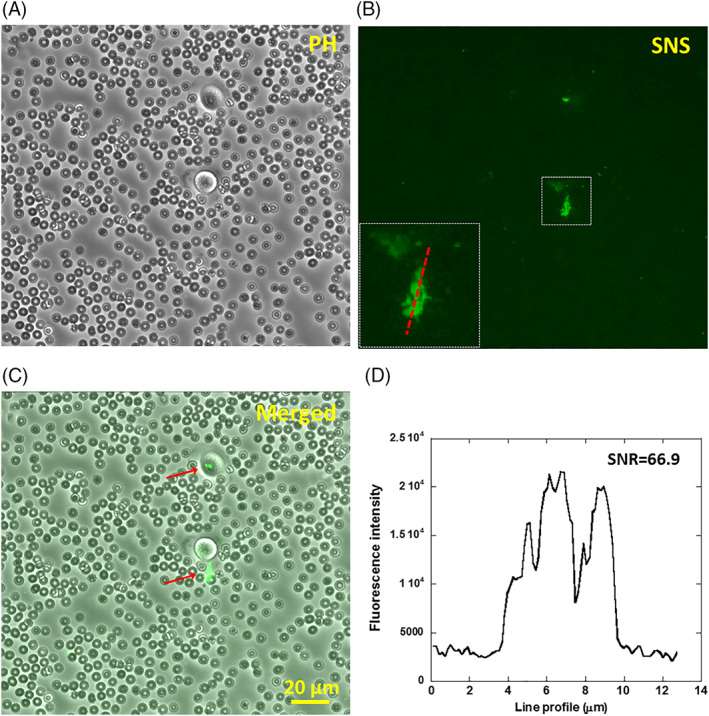
Detecting breast cancer cells in blood sample using SNS. (A‐C) Canine whole blood diluted by 10 fold and mixed with breast cancer cells (MDA‐MB‐231), mimicking circulating tumor cells in blood, was plated on a surface coated with SNS and fibronectin. SNS signal were acquired after 1 hour of cell incubation. The number ratio between MDA‐MB‐231 cells and red blood cells is 1:106. (D) The SNS signal caused by MN activity has a high contrast to the dark background with a signal‐to‐noise ratio of 66.9, making it feasible to differentiate cancer cells from a large background of blood cells
4. CONCLUSIONS
In this article, we introduced a surface‐tethered nuclease sensor abbreviated as SNS to image and monitor the spatial dynamics of membrane‐bound nuclease (MN) activity in live cells. SNS is a biotinylated fluorophore linked with a quencher‐labeled 18 bp dsDNA as the substrate for DNase. In application, SNS is coated on a glass surface by neutravidin‐biotin interaction. On such a surface, the active MN of adherent cells would degrade the dsDNA in SNS and free the fluorophore from quenching. Therefore, MN activity of adherent cells can be reported on site by fluorescence imaging. Compared to previous solution‐based nuclease sensors, SNS retains high sensitivity for nuclease activity, while providing high‐resolution spatial information for the distribution and dynamics of MN activity.
Using SNS, for the first time, we revealed that the MN activity is spatially organized on the ventral membrane of breast cancer cell‐line (MDA‐MB‐231). The MN activity on the cell membrane is not homogeneous, but starts in a punctate pattern and advances in a coral‐shaped pattern. Such pattern does not resemble other commonly known cell adhesion structures such as focal adhesion, podosomes or invadopodia 23, 24, 25, 26. This intriguing pattern suggests that the distribution and activity of MN is spatially regulated by cells. This unexpected spatial dynamics of MN will likely attract more research interests to study the spatial dynamics and physiological role of MN in cells. SNS tests on six cell‐lines also suggest that the MN activity could be elevated in cancer cells compared to non‐cancer cells, and the unique MN activity pattern might be relevant to cancer cell functions and cancer development. Overall, by monitoring both temporal and spatial activity of MN, SNS will be a valuable tool to facilitate the study of the molecular mechanism and physiological role of MN functionality in cancer cells.
Although the underlying biological mechanism of the MN spatial dynamics still remains unknown, the distinctive MN activity pattern provides a unique opportunity for detecting cancer cells from a large cell background at single cell level. We successfully detected MDA‐MB‐231 cells from adherent non‐cancer cells and non‐adherent blood cells at a cell number ratio of 1:103 and 1:106, respectively. In the future, with automated imaging system, we expect that SNS will be able to detect cancer cells with even lower ratio between cancer cells and regular cells, and become valuable to pull down and detect extremely rare circulating tumor cells 27 in cancer patient blood samples. Collectively, as a convenient and powerful optical biosensor that monitors MN activity in live cells, SNS will find applications in both basic research and clinical application.
CONFLICTS OF INTEREST
The authors declare that there are no conflicts of interest related to this article.
Supporting information
Movie S1‐S3 show membrane‐bound DNase activity in three representative breast cancer cells. These movies were acquired by a Ti‐E microscope simultaneously with the multi‐area scanning function. The actual imaging time is 25 min with a frame interval of 1 min. The DNase activity is reported in green and real‐time DNase activity occurring in the latest frame interval is marked in red.
ACKNOWLEDGMENTS
We thank Dr. Ian Schneider, Dr. Sanjeevi Sivasankar at Iowa State University for the cell lines. We also appreciate the help from Dr. David Lin, Dr. Chih‐Chia Su at Iowa State University in the plasmid amplification and purification. The work was supported by startup fund from Iowa State University, by National Institute of General Medical Sciences (1R35GM128747) and by National Science Foundation (1825724).
Wang Y, Zhao Y, Sarkar A, Wang X. Optical sensor revealed abnormal nuclease spatial activity on cancer cell membrane. J. Biophotonics. 2019;12:e201800351. 10.1002/jbio.201800351
Funding information National Institute of General Medical Sciences, Grant/Award Number: 1R35GM128747; National Science Foundation, Grant/Award Number: 1825724
REFERENCES
- 1. Shiokawa D., Matsushita T., Shika Y., Shimizu M., Maeda M., Tanuma S. I., J. Biol. Chem. 2007, 282, 17132. [DOI] [PubMed] [Google Scholar]
- 2. Los M., Neubuser D., Coy J. F., Mozoluk M., Poustka A., Schulze‐Osthoff K., Biochemistry 2000, 39, 7365. [DOI] [PubMed] [Google Scholar]
- 3. Zhang Y., Wang Y., Liu B., Anal. Chem. 2009, 81, 3731. [DOI] [PubMed] [Google Scholar]
- 4. Perry M., Chalkley R., J. Biol. Chem. 1981, 256, 3313. [PubMed] [Google Scholar]
- 5. Fischer H., Scherz J., Szabo S., Mildner M., Benarafa C., Torriglia A., Tschachler E., Eckhart L., PloS One 2011, 6, e17581. [DOI] [PMC free article] [PubMed] [Google Scholar]
- 6. Samejima K., Earnshaw W. C., Nat Rev Mol Cell Biol 2005, 6, 677. [DOI] [PubMed] [Google Scholar]
- 7. Rittie L., Perbal B., J Cell Commun Signal 2008, 2, 25. [DOI] [PMC free article] [PubMed] [Google Scholar]
- 8. Kruspe S., Dickey D. D., Urak K. T., Blanco G. N., Miller M. J., Clark K. C., Burghardt E., Gutierrez W. R., Phadke S. D., Kamboj S., Ginader T., Smith B. J., Grimm S. K., Schappet J., Ozer H., Thomas A., McNamara J. O., Chan C. H., Giangrande P. H., Mol Ther Nucleic Acids 2017, 8, 542. [DOI] [PMC free article] [PubMed] [Google Scholar]
- 9. Hernandez L. I., Ozalp V. C., Hernandez F. J., Chem. Commun. 2016, 52, 12346. [DOI] [PubMed] [Google Scholar]
- 10. Hernandez F. J., Huang L. Y., Olson M. E., Powers K. M., Hernandez L. I., Meyerholz D. K., Thedens D. R., Behlke M. A., Horswill A. R., McNamara J. O., Nat. Med. 2014, 20, 301. [DOI] [PMC free article] [PubMed] [Google Scholar]
- 11. Geiger B., Spatz J. P., Bershadsky A. D., Nat Rev Mol Cell Biol 2009, 10, 21. [DOI] [PubMed] [Google Scholar]
- 12. Wiesner C., Le‐Cabec V., El Azzouzi K., Maridonneau‐Parini I., Linder S., Cell Adh. Migr. 2014, 8, 179. [DOI] [PMC free article] [PubMed] [Google Scholar]
- 13. Murphy D. A., Courtneidge S. A., Nat Rev Mol Cell Biol 2011, 12, 413. [DOI] [PMC free article] [PubMed] [Google Scholar]
- 14. Marras S. A. E., Kramer F. R., Tyagi S., Nucleic Acids Res. 2002, 30, 122e. [DOI] [PMC free article] [PubMed] [Google Scholar]
- 15. Sato S., Takenaka S., Sensors (Basel) 2014, 14, 12437. [DOI] [PMC free article] [PubMed] [Google Scholar]
- 16. Neumann J., Foldi M., Forster A., Gabriel B., Werner M., Coy J., Stickeler E., Zur Hausen A., Pathol. Res. Pract. 2007, 203, 304. [Google Scholar]
- 17. Wang N., Du X. L., Zang L., Song N. A., Yang T., Dong R., Wu T., He X. L., Lu J. G., Mol. Biol. Rep. 2012, 39, 10497. [DOI] [PubMed] [Google Scholar]
- 18. Nadal R., Lorente J. A., Rosell R., Serrano M. J., Expert Rev. Mol. Diagn. 2013, 13, 295. [DOI] [PubMed] [Google Scholar]
- 19. Aurilio G., Sciandivasci A., Munzone E., Sandri M. T., Zorzino L., Cassatella M. C., Verri E., Rocca M. C., Nole F., Expert Rev Anticancer Ther 2012, 12, 203. [DOI] [PubMed] [Google Scholar]
- 20. Hayes D. F., Cristofanilli M., Budd G. T., Ellis M. J., Stopeck A., Miller M. C., Matera J., Allard W. J., Doyle G. V., Terstappen L. W. W. M., Clin. Cancer Res. 2006, 12, 4218. [DOI] [PubMed] [Google Scholar]
- 21. Cristofanilli M., Budd G. T., Ellis M. J., Stopeck A., Matera J., Miller M. C., Reuben J. M., Doyle G. V., Allard W. J., Terstappen L. W., Hayes D. F., N. Engl. J. Med. 2004, 351, 781. [DOI] [PubMed] [Google Scholar]
- 22. Chen W., Weng S., Zhang F., Allen S., Li X., Bao L., Lam R. H., Macoska J. A., Merajver S. D., Fu J., ACS Nano 2013, 7, 566. [DOI] [PMC free article] [PubMed] [Google Scholar]
- 23. Wozniak M. A., Modzelewska K., Kwong L., Keely P. J., BBA‐Mol. Cell. Res. 2004, 1692, 103. [DOI] [PubMed] [Google Scholar]
- 24. Miyamoto S., Katz B. Z., Lafrenie R. M., Yamada K. M., Ann. N. Y. Acad. Sci. 1998, 857, 119. [DOI] [PubMed] [Google Scholar]
- 25. Williams K. C., Coppolino M. G., J. Cell Sci. 2014, 127, 1712. [DOI] [PubMed] [Google Scholar]
- 26. Beaty B. T., Condeelis J., Eur. J. Cell Biol. 2014, 93, 438. [DOI] [PMC free article] [PubMed] [Google Scholar]
- 27. Pantel K., Speicher M. R., Oncogene 2016, 35, 1216. [DOI] [PubMed] [Google Scholar]
Associated Data
This section collects any data citations, data availability statements, or supplementary materials included in this article.
Supplementary Materials
Movie S1‐S3 show membrane‐bound DNase activity in three representative breast cancer cells. These movies were acquired by a Ti‐E microscope simultaneously with the multi‐area scanning function. The actual imaging time is 25 min with a frame interval of 1 min. The DNase activity is reported in green and real‐time DNase activity occurring in the latest frame interval is marked in red.


