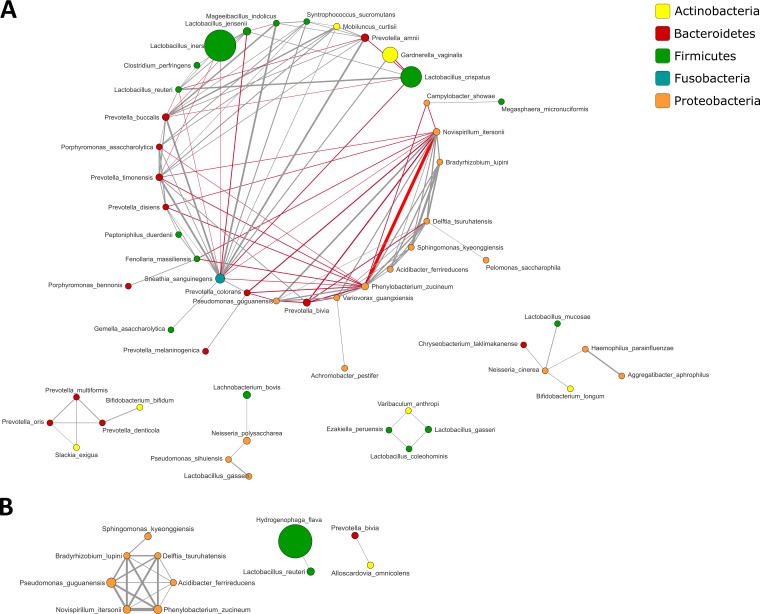
FIG 5.
Cooccurrence analysis of bacterial taxa in the cervical microbiota from C. trachomatis-infected (A) and healthy (B) women. Nodes represent operational taxonomic units (OTUs) with size reflecting the OTU’s average fraction in the community, and colors indicate the phylum to which the OTU belongs. Edges between nodes represent correlations between the nodes they connect, with the edge’s thickness indicating the correlation magnitude, and both positive (gray) and negative (red) associations shown. Only edges corresponding to correlation whose magnitude is greater than 0.35 are drawn. Unconnected nodes are omitted.

