

SUMMARY
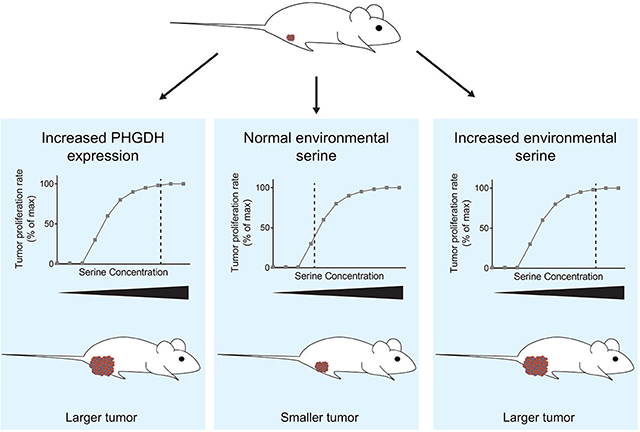
Tumors exhibit altered metabolism compared to normal tissues. Many cancers upregulate expression of serine synthesis pathway enzymes, and some tumors exhibit copy number gain of the gene encoding the first enzyme in the pathway, phosphoglycerate dehydrogenase (PHGDH). However, whether increased serine synthesis promotes tumor growth and how serine synthesis benefits tumors is controversial. Here we demonstrate that increased PHGDH expression promotes tumor progression in mouse models of melanoma and breast cancer, human tumor types that exhibit PHGDH copy number gain. We measure circulating serine levels and find that PHGDH expression is necessary to support cell proliferation at lower physiological serine concentrations. Increased dietary serine or high PHGDH expression are sufficient to increase intracellular serine levels and support faster tumor growth. Together, these data suggest that physiological serine availability restrains tumor growth and argues that tumors arising in serine-limited environments acquire a fitness advantage by upregulating serine synthesis pathway enzymes.
Keywords: serine, PHGDH, melanoma, breast cancer
eTOC blurb:
Nutrient availability can constrain tumor growth. Sullivan et al. demonstrate that in some cancers, physiological levels of the amino acid serine are insufficient to support maximal tumor growth and that melanoma and breast tumors derive a growth advantage by upregulating serine biosynthesis.
Graphical Abstract:
INTRODUCTION
Altered metabolism was one of the earliest observed characteristics of cancer. Initial studies demonstrated an increased role of glucose metabolism in tumor progression, but more recent work has highlighted the importance of amino acid, nucleotide, and lipid metabolism in cancer (Pavlova and Thompson, 2016). Identifying metabolic pathways limiting for tumor growth may provide insight into targeting metabolism for cancer therapy (Vander Heiden and DeBerardinis, 2017). One approach to find metabolic pathways important for specific tumors is to identify enzymes that are upregulated in tumors relative to their tissue of origin. Some tumors highly express enzymes in the serine synthesis pathway (Newman and Maddocks, 2017). Phosphoglycerate dehydrogenase (PHGDH) catalyzes the first step in serine synthesis (Figure S1A), and PHGDH protein levels are upregulated by factors associated with tumor progression including NRF2 (DeNicola et al., 2015), c-MYC (Nilsson et al., 2012), ATF4 (Adams, 2007; DeNicola et al., 2015), HIF-1α (Samanta et al., 2016), mTORC1 (Ben-Sahra et al., 2016), and the lysine methyltransferase G9A (Ding et al., 2013), while PHGDH expression can be repressed by the tumor suppressor p53 (Ou et al., 2015). PHGDH also exhibits gene copy number gain in several tumor types, including melanoma and triple negative breast cancer (Locasale et al., 2011; Possemato et al., 2011). Disrupting serine synthesis can be detrimental for some tumors, as decreasing PHGDH expression impairs the growth of subcutaneous lung cancer (DeNicola et al., 2015) and breast cancer (Pacold et al., 2016; Possemato et al., 2011) xenografts. However, PHGDH knockdown does not affect tumors growth in a different breast cancer model (Chen et al., 2013), arguing that serine synthesis pathway activity is only required in some contexts. What selects for high PHGDH expression and how this benefits tumor growth is poorly understood.
Though many cells express high levels of serine synthesis pathway enzymes and synthesize serine, serine is also the second most highly consumed amino acid in cultured cells (Hosios et al., 2016), reflecting its central role in biosynthetic reactions. Serine is a proteinogenic amino acid and is utilized to synthesize glycine (Newman and Maddocks, 2017) and cysteine (DeNicola et al., 2015). Serine also supports ceramide and sphingolipid synthesis and is a component of phospholipid head groups (Mullen et al., 2012; Vance and Tasseva, 2013). In addition, serine donates one-carbon units for folate-dependent reactions (Labuschagne et al., 2014), including thymidine and purine nucleotide base synthesis (Lane and Fan, 2015). Folate-derived one-carbon units can also regenerate S-adenosyl methionine to support DNA, RNA, protein, phospholipid, and polyamine methylation (Chiang et al., 1996). Given these central biosynthetic roles, many cells do not tolerate serine deprivation (DeNicola et al., 2015; Labuschagne et al., 2014; Ma et al., 2017), and some tumors are sensitive to dietary serine withdrawal (Maddocks et al., 2017; Maddocks et al., 2013).
Beyond supplying serine, serine synthesis pathway activity may provide additional advantages to cells. PHGDH knockdown or inhibition inhibits proliferation of some cancer cells in culture in a manner that cannot be rescued by exogenous serine (Locasale et al., 2011; Mullarky et al., 2016; Pacold et al., 2016; Possemato et al., 2011). One explanation for this phenomenon is that serine synthesis provides a means to obtain α-ketoglutarate (Hwang et al., 2016; Possemato et al., 2011), a TCA cycle intermediate and cofactor for dioxygenases involved in regulation of gene expression and adaptation to hypoxia (Hausinger, 2004). PHGDH can also be a source of D-2-hydroxyglutarate (Fan et al., 2015), which also can affect dioxygenase activity (Ye et al., 2018). Further, in yeast, serine synthesis pathway enzymes are part of a complex containing one-carbon metabolism enzymes, suggesting potential non-enzymatic scaffolding roles for these proteins (Li et al., 2015). Which, if any, of these potential benefits of increased serine synthesis pathway enzyme expression are important in tumors is unknown.
To determine whether increased PHGDH expression promotes tumor progression, and to ascertain why tumors might benefit from increased PHGDH levels, we utilized a mouse model that mimics PHGDH copy number gain (Mattaini et al., 2018). In autochthonous mouse models of melanoma and breast cancer, we find that increased PHGDH expression promotes tumor progression. Furthermore, we find that increased PHGDH expression maintains serine at a level that is not limiting for tumor growth, suggesting that endogenous serine limitation restrains the growth of some tumors and that cancers arising in low-serine tissues will gain a fitness advantage from increased serine synthesis.
RESULTS
PHGDH expression cooperates with mutant Braf to promote melanoma formation
Increased levels of PHGDH are insufficient to promote tumor initiation (Mattaini et al., 2018). However, PHGDH expression may cooperate with other genetic events to promote tumor growth. To examine this possibility, we first focused on melanoma, a tumor type in which PHGDH copy number gain is observed (Locasale et al., 2011; Possemato et al., 2011). In melanoma, activating Braf mutations occur in up to 60% of tumors (Chin, 2003). To determine whether PHGDH expression can cooperate with mutant Braf to promote melanoma in mice, we utilized a PHGDHtetO allele that allows for doxycycline-inducible expression of human PHGDH (Mattaini et al., 2018). The PHGDHtetO allele was crossed to mice bearing a Braf V600E conditional allele (BrafCA) and Tyr-CreER allele that enables mutant Braf V600E activation in melanocytes when exposed to tamoxifen (Dankort et al., 2009). Braf activation alone does not drive tumor formation in this model (Dankort et al., 2009), but promotes melanoma formation when combined with some other genetic alterations (Damsky et al., 2015). To activate PHGDH expression in BrafCA; Tyr-CreER; PHGDHtetO mice, animals were bred to also harbor a R26-M2rtTA that drives transgene expression in most mouse tissues upon exposure to doxycycline (Zambrowicz et al., 1997). Increased PHGDH expression dependent on both doxycycline and the presence of a PHGDHtetO allele is observed in the skin and other tissues in these mice (Mattaini et al., 2018). When fed a doxycycline containing diet to increase PHGDH expression, 13 percent of BrafCA; Tyr-CreER; PHGDHtetO; R26-M2rtTA mice formed tumors, while no littermate mice with melanocytic Braf activation that lack a PHGDHtetO allele developed tumors (Figure 1A). The observed tumors appeared histologically to be melanomas, and expressed the melanoma marker Sox10 (Figure 1B), suggesting that PHGDH expression can cooperate with Braf activation to drive melanoma formation with low penetrance.
Figure 1. PHGDH expression promotes melanoma and breast cancer.

(A) Kaplan-Meier plot showing survival of control or PHGDH expressing (PHGDHtetO) mice with mutant Braf expression in melanocytes. N=14 for Control, N=15 for PHGDHtetO (B) Representative hematoxylin and eosin (H&E) and Sox10 immunohistochemistry staining of a tumor derived from a BrafCA; Tyr-CreER; PHGDHtetO; Rosa26-M2rtTA mouse. H&E image, 4x magnification, scale bar = 500 μm; Sox10 image, 20X magnification, scale bar = 100 μm. (C) Species specific RT-qPCR for human (huPHGDH) and mouse (msPHGDH) PHGDH in BrafCA Pten −/− melanomas from BrafCA; Ptenfl/fl; Tyr-CreER mice without (control) or with (PHGDHtetO) increased PHGDH expression as above. The difference in huPHGDH expression is significant (p = 0.0368) and the difference in msPHGDH expression is not significant (p = 0.7127) by unpaired, two-tailed Welch’s t tests. n=3 tumors for each genotype. (D) Western blot analysis of PHGDH expression in control or PHGDHtetO BrafCA Pten−/− tumors. (E) Representative H&E image of BrafCA; PTEN −/− tumors with normal (Control) or increased (PHGDHtetO) PHGDH expression. 4x magnification, scale bar = 500 μm. (F) Kaplan-Meier plot showing survival of control or PHGDH expressing (PHGDHtetO) mice bearing BrafCA; Pten −/− melanomas. Doxycycline (dox) diet started on the day of tumor induction (arrow). Difference in survival is significant (p = 0.012) by a stratified Cox proportional hazards model. n=13 for control mice, n=36 for PHGDHtetO mice (G) Representative immunohistochemistry assessing Ki67 in control and PHGDH expressing (PHGDHtetO) BrafCA; Pten−/− tumors. 10x magnification, scale bar = 300 μm. The difference in Ki67 staining was significant (p = 0.0358) by an unpaired, two-tailed Welch’s T test. (H) Kaplan-Meier plot showing survival of control or PHGDH expressing (PHGDHtetO) BRCAfl/fl; Trp53+/−; MMTV-Cre mice with breast tumors. Difference in survival is significant (p = 0.0269) by a Mantel-Cox log-rank test. n=10 for control mice and n=22 for PHGDHtetO mice. (I) Western blot analysis of PHGDH expression in control or PHGDHtetO breast tumors arising in BRCAfl/fl; Trp53+/−; MMTV-Cre mice. (J) Representative PHGDH immunohistochemistry staining of mammary glands from 7-week old MMTV-rtTA (Control) and PHGDHtetO/+; MMTV-rtTA (PHGDHtetO) mice fed a doxycycline diet for 1 week prior to harvesting mammary tissue. Arrows indicate mammary ducts. 20x magnification, scale bar = 100 μm. PHGDHtetO mice exhibited a significant increase in the fraction of cells with high PHGDH expression (p=0.0025) by an unpaired, two-tailed Welch’s t test.
Mean +/− SD is shown for all panels.
PHGDH expression accelerates melanoma growth
To examine the role of PHGDH in melanoma growth and progression, PHGDHtetO; R26-M2rtTA mice were crossed to a mouse melanoma model initiated by Braf activation and Pten deletion in melanocytes (BrafCA; Tyr-CreER; Ptenfl/fl) (Dankort et al., 2009). To confirm that the PHGDHtetO allele was expressed in this model, we leveraged the fact that the PHGDHtetO transgene encodes human PHGDH (huPHGDH) that can be distinguished from endogenous mouse Phgdh (msPHGDH). Tumors with the PHGDHtetO allele express huPHGDH as well as endogenous msPHGDH, while control tumors express msPHGDH but not huPHGDH (Figure 1C). Consistent with this result, tumors from PHGDHtetO mice exhibit increased PHGDH protein expression (Figure 1D) using an antibody that recognizes human and mouse PHGDH with equal affinity (Mattaini et al., 2018). The PHGDHtetO allele did not alter the histological appearance of melanomas that formed (Figure 1E) or plasma serine levels (Figure S1B), but did decrease the median time for tumors to reach 1 cm3 from 68 to 46 days (Figure 1F). Increased PHGDH expression accelerated melanoma in both male and female mice, which exhibit different tumor growth kinetics in this model (Figure S1C). This phenotype was driven at least in part by increased cell proliferation, as tumors with the PHGDHtetO allele displayed increased staining for the proliferative marker Ki67 compared to control mice (Figure 1G), while no difference in staining for a marker of apoptosis, cleaved caspase 3, was observed (Figure S1D). Together, these data suggest that increased PHGDH expression can accelerate melanoma growth.
PHGDH expression accelerates breast cancer
PHGDH copy number gain is also observed in triple-negative breast cancer (Locasale et al., 2011; Possemato et al., 2011). To determine whether PHGDH expression plays a tumorigenic role in this cancer, the PHGDHtetO allele was crossed to a triple negative breast cancer model induced by mammary specific Brca1 deletion in Trp53 heterozygous mice (BRCAfl/fl; Trp53+/−; MMTV-Cre) (Xu et al., 1999). In addition, to confirm that any role of PHGDH can be attributed to PHGDH expression in the tissue where the cancer arises, increased PHGDH expression was limited to mammary epithelial cells with a mammary specific MMTV-rtTA allele (Whisenhunt et al., 2006). PHGDHtetO breast tumors reached 1 cm3 faster than control tumors, suggesting that PHGDH expression can also promote breast tumor progression (Figure 1H). Interestingly, PHGDH expression in end stage tumors is variable, and PHGDHtetO tumors do not exhibit increased PHGDH expression compared to control tumors (Figure 1I), even though PHGDHtetO mice express huPHGDH derived from the PHGDHtetO transgene (Figure S2A). Additionally, end stage PHGDHtetO tumors do not display differential staining of Ki67 or cleaved caspase 3 (Figure S2B-C). One possible explanation is that increased PHGDH expression is selected for in both PHGDHtetO and control tumors, and earlier PHGDH expression from the transgene contributes to earlier tumor outgrowth in this more protracted cancer model. To confirm that PHGDH expression is elevated early in PHGDHtetO mice, mammary glands from 7 week old PHGDHtetO;MMTV-rtTA and control MMTV-rtTA mice were stained for PHGDH. PHGDH expression was increased in mammary epithelial cells in PHGDHtetO mice compared to control mice (Figure 1J). Together, these data suggest that the PHGDHtetO allele provides an advantage to tumors prior to end stage, when PHGDHtetO tumors exhibit similar PHGDH expression as control tumors.
Breast cancer cell lines are dependent on PHGDH to produce serine
To determine whether PHGDH plays a role throughout breast tumor progression, we generated cell lines from end stage control tumors, which express PHGDH at levels similar to tumors from PHGDHtetO mice, and knocked down PHGDH expression using CRISPR interference (CRISPRi) (Figure 2A). PHGDH loss decreased serine synthesis pathway activity as assessed by 13C-labeled glucose incorporation into serine (Figure 2B), but had no effect on proliferation of these cells in culture (Figure 2C). This result could suggest that PHGDH is not required for proliferation of these cancer cells; however, it is also possible that PHGDH expression is beneficial specifically in the breast tumor environment. One difference between the cell culture and breast tumors environments is serine availability. The serine concentration in RPMI-1640 culture media is 285 μM. In contrast, the maximal serine concentration available to tumors is likely bounded by the amount of serine in plasma, and could be further affected by impaired nutrient delivery (Farnsworth et al., 2014), as serine concentrations in the center of tumors are lower than in the outer regions (Pan et al., 2016). To determine whether serine availability could plausibly be limiting for tumor growth under physiological conditions, the plasma serine concentration of fed C57BL/6J mice was measured, since C57BL/6J mice are the strain most similar to those used for the autochthonous melanoma and breast cancer models in this study. Plasma serine levels ranged from 92–314 μM (Figure 2D), values similar to the range of 53–262 μM reported for human plasma (Trabado et al., 2017). We examined whether culturing cells in the range of serine concentrations found in plasma affects proliferation of control and PHGDH-knockdown cells, and found that increased PHGDH expression provides a proliferative advantage only at lower serine concentrations (Figure 2E). These results suggest that serine availability could be an endogenous limitation for proliferation in some tissues with low serine availability.
Figure 2. Physiological serine concentrations approach a range that is limiting for cell proliferation in culture.

(A) Western blot showing CRISPRi-mediated knockdown of PHGDH expression in cells derived from an autochthonous breast tumor arising in a BRCAfl/fl; Trp53+/−; MMTV-Cre mouse. Cells with sgRNA targeting PHGDH (sgPHGDH-1) or a non-targeting sgRNA (sgctrl) are shown. (B) Fraction of 13C-labeled serine (fully labeled, M+3) in control (sgctrl) or PHGDH knockdown (sgPHGDH-1) cells cultured in U-13C glucose. The difference in the fraction of labeled serine between the cell types is significant (p< 0.0001) by an unpaired, Welch’s t test. (C) Proliferation rate of control (sgctrl) and PHGDH knockdown (sgPHGDH-1) cells. There is no significant change in proliferation rate by unpaired, two-tailed Welch’s t test (p = 0.2820). (D) Serine concentration in plasma of C57BL/6J mice collected at 11 AM. n=60 mice. (E) Proliferation rate of control (sgctrl) and PHGDH knockdown (sgPHGDH-1) breast cancer cells cultured in media containing the indicated amounts of serine. Grey box indicates the range of plasma serine concentrations measured in (D). (F) Plasma serine, glycine, and lysine concentrations measured in the indicated mouse strains fed ad lib on a control diet, fasted starting at 5 AM, or fed a serine and glycine free diet for one week prior to measurement. Plasma was collected at the specified times. n=5 mice on each diet. (G) Plasma serine and glycine concentrations in C57BL/6J mice fed a serine and glycine free diet, a control diet, or a high serine diet for the indicated time. Plasma was collected at 11 AM. n=5 mice on each diet. (H) Mouse weight for animals fed a serine and glycine free diet, a control diet, or a high serine diet for the indicated time. n=5 mice on each diet.
Mean +/− SD is shown for all panels.
Serine levels fluctuate in fed mice
The variability in plasma serine levels observed in both mouse and humans suggests that mammals do not actively maintain a constant serine levels in the blood; indeed, plasma serine concentrations in rats shift with diet (Kalhan et al., 2011). Another complication is that many mammals, including mice, do not continuously feed throughout the day (Anlinker and Mayer, 1956). Thus, fluctuations in plasma serine levels between meals, in addition to circadian effects on metabolic gene expression affecting nutrient levels in blood (Feng and Lazar, 2012), could lower serine in some tissues to levels where PHGDH expression might provide an advantage for proliferation. To characterize how plasma serine in mice varies with normal feeding patterns, plasma amino acid levels were measured over the course of a day in C57BL/6J and NOD.Cg-Prkdcscid Il2rgtm1Wjl/SzJ (NSG) mice that were either fed ad libitum or fasted. Serine levels were highest during daylight hours, and fell to fasting levels at 8 AM and 5 PM (Figure 2F, Table S1). This pattern was also observed for other non-essential amino acids such as glycine as well as essential amino acids such as lysine (Figure 2F). These results indicate that serine levels available to tumors fluctuate and likely fall to near fasting levels for periods of the day, further suggesting that serine may be limiting for tumor growth in some contexts.
Diet can modulate plasma serine availability
In order to examine whether changes in serine availability can affect the rate of tumor growth, we sought to modulate the amount of serine that cancer cells can access in tumors. Previous work has shown that plasma serine levels can be diminished by a serine and glycine deficient diet, which slows the growth of certain tumor types (Maddocks et al., 2017; Maddocks et al., 2013). Glycine is removed from these diets because glycine and serine can be interconverted, and glycine deprivation ensures that animals are not able to synthesize serine from dietary glycine (Maddocks et al., 2017; Maddocks et al., 2013). Feeding mice an amino acid defined diet lacking both serine and glycine (Table S2) stably lowered plasma serine and glycine levels for at least 30 days on the diet (Figure 2G). Mice fed a serine and glycine free diet also display lower levels of plasma serine and glycine over the course of the day compared to control mice (Figure 2F). Conversely, plasma lysine levels are similar in mice fed either a control diet or a serine and glycine free diet (Figure 2F), suggesting that normal amino acid homeostasis is not globally altered. Serine levels can also be increased through dietary manipulation, as mice fed a high serine diet (Table S2) have higher serine levels in the plasma with no changes in glycine (Figure 2G). Neither of these diets altered mouse body weight (Figure 2H) or produced gross abnormalities in mouse behavior or appearance. Further, the serine and glycine free diet and the high serine diet stably hold plasma serine concentrations at the low and high end of the normal physiological range, respectively. Thus, these diets can be used to examine the effects on tumor growth of having circulating serine levels that are at the high and low ends of the normal physiological range.
PHGDH provides serine to promote breast tumor growth in the mammary fat pad
To test whether PHGDH overcomes serine limitation in the breast microenvironment, cells from autochthonous breast tumors with or without PHGDH knockdown were orthotopically implanted into the mammary fat pads of NSG mice. The cells with PHGDH knockdown should retain lower serine synthesis pathway activity in tumors (Pacold et al., 2016). Under normal dietary serine conditions, tumors from control cells that express PHGDH (Figure S3A) grew more rapidly than tumors from PHGDH knockdown cells (Figure 3A). These data argue that PHGDH expression can promote tumor growth in the mammary fat pad. Tumors derived from control cells that express PHGDH were largely insensitive to dietary serine alterations (Figure 3B). In contrast, sgPHGDH tumors grew more slowly on a serine and glycine free diet (Figure 3C), suggesting that tumors with low PHGDH expression are sensitive to environmental serine levels. A second sgPHGDH cell line that had incomplete PHGDH knockdown (Figure S3A) was also sensitive to serine and glycine deprivation, but did not grow more rapidly on a high serine diet, suggesting that intermediate levels of PHGDH may be sufficient to sustain maximal growth on a control diet, but not on a serine and glycine free diet (Figure S3B). sgPHGDH tumors on a high serine diet grow at a similar rate to control tumors on a control diet, suggesting that the high serine diet was able to fully compensate for low PHGDH expression. Consistent with the idea that PHGDH helps tumors overcome serine limitation, serine and glycine levels were lower in sgPHGDH tumors than control tumors, while levels of essential amino acids such as valine and leucine were unchanged (Figure 3D-E, Figure S3C). Though this result is consistent with altered serine availability in tumors depending on PHGDH expression level, it is important to note that these tumors had different proliferation rates, and thus may have consumed serine at different rates. Thus, steady state tumor serine levels may not fully reflect serine availability. Serine synthesis pathway activity can also produce α-ketoglutarate and 2-hydroxyglutarate, but levels of α-ketoglutarate and 2-hydroxyglutarate were similar in sgPHGDH and control tumors (Figure 3F-G). Together, these data argue that a major effect of increased PHGDH activity in these cancers is to buffer against fluctuations in serine availability, insulating tumor cells from the effects of serine limitation.
Figure 3. PHGDH expression overcomes serine limitation in tumors growing in the mammary fat pad.

(A) Breast cancer cells from a breast tumor arising in a BRCAfl/fl; Trp53+/−; MMTV-Cre mouse with either a non-targeting sgRNA (sgctrl) or an sgRNA targeting PHGDH (sgPHGDH-1) were injected into the mammary fat pad of female NSG mice fed a control diet. Tumor size over time is shown. Tumor size at the final time point is significantly different based on an unpaired, two-tailed Welch’s t test (p = 0.0027). n=5 tumors per genotype. (B)-(C) Breast cancer cells from a breast tumor arising in BRCAfl/fl; Trp53+/−; MMTV-Cre mice with either a non-targeting sgRNA (sgctrl) (B) or an sgRNA targeting PHGDH (sgPHGDH-1) (C) were injected into the mammary fat pad of female NSG mice fed the indicated diets. Mice were fed the indicated diets starting the day that the cells were injected, and tumor size over time is shown. n=5 tumors per genotype. In (B), by comparing all three diet conditions, there was no significant correlation between increased dietary serine and increased tumor volume by an ANOVA test for trend (p=0.0770). There was no significant difference in final tumor volume between mice fed –ser/gly, control, or high serine diets based on unpaired, two-tailed Welch’s t tests for –ser/gly versus control (p=0.0986) and for control versus high serine diet (p=0.1217). In (C), by comparing all three diet conditions, there was a significant correlation between increased dietary serine and increased tumor volume by an ANOVA test for trend (p = 0.0022). There was a significant difference in final tumor volume between mice fed –ser/gly and control diets based on an unpaired, two-tailed Welch’s t test (p=0.0559). (D) Serine amount in control tumors (sgctrl) compared to PHGDH knockdown tumors (sgPHGDH-1). sgctrl tumors display a significant increase in serine concentration based on an unpaired, two-tailed Welch’s t test (p=0.032). n=4 tumors per genotype. (E) Glycine amount in control tumors (sgctrl) compared to PHGDH knockdown tumors (sgPHGDH-1). sgctrl tumors display a significant increase in glycine concentration based on an unpaired, two-tailed Welch’s t test (p=0.0332). n=4 tumors per genotype (F) Amount of α-ketoglutarate in control (sgctrl) and PHGDH knockdown (sgPHGDH-1) mammary fat pad orthotopic tumors in mice fed either a –ser/gly diet, a control diet, or a high serine diet as measured by LC/MS. No significant change in α-ketoglutarate levels were detected between sgctrl and sgPHGDH-1 tumors as determined by unpaired, two-tailed Welch’s t tests (p=0.5917, 0.6834, and 0.2908, respectively). (G) Amount of 2-hydroxyglutarate in control (sgctrl) and PHGDH knockdown (sgPHGDH-1) mammary fat pad orthotopic tumors in mice fed either a –ser/gly diet, a control diet, or a high serine diet as measured by LC/MS. No significant change in 2-hydroxyglutarate levels were detected between sgctrl and sgPHGDH-1 tumors as determined by unpaired, two-tailed Welch’s t tests (p=0.8387, 0.4603, and 0.8368, respectively). n=4 tumors per genotype.
Mean +/− SD is shown for all panels.
Serine availability may not be the same in all tissues. For instance, unlike breast tumors, tumors growing in the pancreas are not sensitive to dietary serine limitation (Maddocks et al., 2017). Consistent with the possibility that differences in serine levels could contribute to this phenomenon, the total tissue serine content is lower in the mammary fat pad than in other tissues, including pancreas (Figure S3E). Total tissue serine content includes both intracellular and extracellular serine and may not reflect differences in serine availability in the environment; nevertheless, to directly test whether tissue site affects dependence on PHGDH, cells derived from autochthonous breast tumors with or without PHGDH knockdown were implanted into the pancreata of NSG mice. Consistent with the pancreas being a more serine-replete environment than the mammary fat pad, mice with control or PHGDH knockdown cells implanted in the pancreas both succumb to pancreatic tumor burden with no statistically significant differences in survival (Figure S3F), suggesting that environmental serine availability may determine whether PHGDH expression promotes tumor growth.
To determine whether increased PHGDH expression in human cancer provides a similar advantage, we expressed PHGDH in MDA-MB-231 human triple negative breast cancer cells with low PHGDH expression that approximates levels in normal mammary glands (Figure S4A) (Mattaini et al., 2015; Possemato et al., 2011). Similar to the findings observed in murine breast cancer cells, PHGDH expression increases serine synthesis pathway activity (Figure S4B) and provides a proliferative advantage to MDA-MB-231 cells when serine levels are low (Figure 4A). To determine whether this proliferative advantage is retained in a physiological environment, MDA-MB-231 cells were injected orthotopically into the mammary fat pad of NSG mice. Tumors formed from PHGDH low control cells are sensitive to dietary serine and glycine deprivation, while tumors formed from PHGDH expressing cells better tolerate this condition. Further, PHGDH high cells deprived of dietary serine grow as rapidly as PHGDH low control tumors fed a serine replete diet (Figure 4B). The growth advantage conferred by PHGDH expression is dependent on PHGDH enzymatic activity, as expression of a dehydrogenase-dead R236E mutant of PHGDH does not alter tumor growth (Figure S4D). PHGDH expressing tumors also contained increased amounts of serine, with no significant change in glycine, α-ketoglutarate, or total 2-hydroxyglutarate levels (Figure 4C, Figure S4F-G). These results suggest that serine might be limiting for MDA-MB-231 mammary fat pad tumor growth even on a control diet. Consistent with this hypothesis, control xenografts in mice fed a high serine diet grew more rapidly than xenografts in mice fed a control diet (Figure 4D). Interestingly, PHGDH high xenografts in mice fed a control diet grew at the same rate as PHGDH low xenografts in mice fed a high serine diet, suggesting that either PHGDH expression or a high serine diet may be sufficient to overcome serine limitation. If so, combining PHGDH expression with a high serine diet would provide no further advantage. Consistent with this hypothesis, PHGDH expressing tumors in mice on a high serine diet grow at the same rate as control xenografts in mice on a high serine diet, or PHGDH expressing tumors in mice on a control diet (Figure 4E). Taken together, these data argue that the benefits of PHGDH and a high serine diet are redundant. This supports the hypothesis that PHGDH promotes increased tumor growth by providing serine to cells in serine-limited tumor environments.
Figure 4. PHGDH expression provides serine to promote growth of human breast cancer xenografts.

(A) Proliferation rate of empty vector control (+EV) and PHGDH expressing (+PHGDH) MDA-MB-231 breast cancer cell lines cultured in media containing the indicated amounts of serine. Grey box indicates the reported range of plasma serine concentrations in humans (Trabado et al., 2017). (B) Empty vector control (+EV) or PHGDH expressing (+PHGDH) MDA-MB-231 breast cancer cells were injected into mammary fat pads of female NSG mice. Measurement of tumor size over time is shown for tumors derived from the indicated cells in mice fed the indicated diets starting the day that the cells were injected. There is a significant increase in tumor volume at the final time point between +PHGDH and +EV tumors in mice fed either a control diet or a –ser/gly diet based on unpaired, two-tailed Welch’s t tests (p=0.0055 and 0.0012, respectively). There is a significant difference in final tumor volume between +EV tumors in mice fed a control diet versus a –ser/gly diet based on an unpaired, two-tailed Welch’s t test (p=0.0510). n=5 mice for each combination of genotype and diet. (C) Serine concentration in empty vector control (EV) and PHGDH expressing (+PHGDH) MDA-MB-231 mammary fat pad orthotopic tumors. PHGDH expressing tumors displayed a significant increase in serine concentration as determined by an unpaired, two-tailed Welch’s t test (p=0.0437). n=5 tumors for each genotype. (D)-(E) Empty vector control (+EV) or PHGDH expressing
(+PHGDH) MDA-MB-231 breast cancer cells were injected into mammary fat pads of female NSG mice. Measurement of tumor size over time is shown for tumors derived from the indicated cells in mice fed the indicated diets starting the day that the cells were injected. There is a significant increase in tumor volume at the final time point between +EV tumors in mice fed either a control diet or a high serine diet based on an unpaired, two-tailed Welch’s t test
(p=0.0268). There is no significant difference in tumor volume at the final time point between
+PHGDH control diet and +PHGDH high serine diet or between +EV high serine diet and +PHGDH high serine diet based on unpaired, two-tailed Welch’s t tests (p=0.9977 and 0.3277, respectively). n=5 mice for each combination of genotype and diet. (F) Schematic with select intermediates in de novo purine nucleotide biosynthesis. THF: tetrahydrofolate. AICAR: 5-aminoimidazole-4-carboxamide ribonucleotide. FAICAR: 5-formamidoimidazole-4-carboxamide ribonucleotide. (G) Ratio of total ion counts of AICAR to FAICAR by LC/MS in empty vector control (EV) and PHGDH expressing (+PHGDH) MDA-MB-231 mammary fat pad orthotopic tumors in mice fed either a diet lacking serine and glycine (-ser/gly), a control diet, or a high serine diet. PHGDH expressing tumors in mice fed a diet lacking serine and glycine and in mice fed a control diet showed a significant decrease in relative AICAR/FAICAR ratio relative to control tumors as determined by an unpaired, two-tailed Welch’s t test (p=0.0350 and 0.0419, respectively). There was no significant difference between the relative AICAR/FAICAR ratios in PHGDH expressing and control tumors derived from mice fed a high serine diet by an unpaired, two-tailed Welch’s t test (p=0.859). n=4 tumors per genotype.
Mean +/− SD is shown for all panels.
PHGDH supports serine-dependent biosynthetic processes
If tumors encounter serine deprivation under physiological conditions, biosynthetic processes that require serine may be perturbed. Serine is a donor of one-carbon units that are essential for downstream processes including nucleotide synthesis, lipid synthesis, and regeneration of SAM from SAH (Chiang et al., 1996; Lane and Fan, 2015), and all of these serine fates likely contribute to tumor growth. Multiple reactions in purine nucleotide synthesis require one-carbon units; one such reaction is the production of 5-formamidoimidazole-4-carboxamide ribonucleotide (FAICAR) production from 5-aminoimidazole-4-carboxamide ribonucleotide (AICAR) (Figure 4F). Thus, serine limitation in tumors could deplete one-carbon units and increase levels of AICAR relative to FAICAR. Indeed, the relative ratio of AICAR to FAICAR is higher in control MDA-MB-231 xenograft tumors than in tumors with high PHGDH expression (Figure 4G), consistent with the possibility that PHGDH expressing tumors are more capable of generating FAICAR. This effect is present both in mice fed a diet lacking serine and glycine and a control diet (Figure 4G), two contexts in which PHGDH expression promotes tumor growth (Figure 4D). In contrast, mice fed a high serine diet do not display a PHGDH-dependent effect on AICAR/FAICAR ratio (Figure 4G) or a PHGDH-dependent growth advantage (Figure 4E). These results indicate that serine-limited tumors are likely deficient in one-carbon units, which could contribute to slower proliferation. In support of this hypothesis, providing exogenous purines can promote cell proliferation in the absence of serine (Bao et al., 2016). In addition, either PHGDH expression or provision of a high serine diet mitigates alterations in the AICAR/FAICAR ratio, arguing that PHGDH expression benefits tumors by providing serine for biosynthetic processes that otherwise may be limiting for tumor growth.
DISCUSSION
Genetic events to increase PHGDH expression in cancer appear to be selected for because they allow faster cell proliferation in serine-limited tissue environments. Increasing the availability of serine through PHGDH expression or dietary changes provides a proliferative advantage to melanoma and breast cancer, arguing that serine availability may be low in tumors arising in these tissues. Further, though providing serine appears to underlie the benefit of PHGDH in these models, it may be that other tumor types or tumor locations are more limited by other processes; this could explain the serine-independent benefits that PHGDH expression provides in some contexts (Locasale et al., 2011; Mullarky et al., 2016; Pacold et al., 2016; Possemato et al., 2011). Of note, serine availability does not appear to be limiting in all tumors; some breast cancers express serine synthesis pathway enzymes at low levels (Possemato et al., 2011) and are not sensitive to loss of pathway activity (Pacold et al., 2016). Further, dietary serine deprivation does not inhibit mouse pancreatic ductal adenocarcinoma growth (Maddocks et al., 2017) and PHGDH expression does not affect the progression of tumors derived from breast cells implanted into the pancreas. These observations support a model in which tumor growth in different tissue contexts is limited by the availability of different nutrients.
It is unclear whether serine limitation decreases tumor growth by impairing the activity of a particular biosynthetic pathway. Dissecting this question is complicated by the fact that providing one downstream product of serine metabolism, such as nucleotides or lipids, will allow the serine that would have been used to make these molecules to be available for use in other pathways. As such, each of the biosynthetic fates of serine likely contributes to the serine requirement in tumors. However, deficiency of specific metabolites derived from serine may select for serine synthesis pathway activation. Nucleotide deficiency has been linked to the development of oncogene-induced senescence (Aird et al., 2013), and PHGDH expression may allow cells with oncogene activation to maintain nucleotide levels during periods of serine deprivation and avoid senescence. Indeed, bypass of oncogene-induced senescence can be a barrier to melanoma initiation (Damsky et al., 2015), suggesting one way in which PHGDH expression could cooperate with Braf activation to promote melanoma. Serine availability for lipid synthesis may also select for serine synthesis pathway activation. Serine deprivation alters sphingolipid and ceramide metabolism (Gao et al., 2018), and these lipid species can affect cell proliferation and survival. For instance, sphingosine-1-phosphate negatively regulates apoptotic processes (Segui et al., 2006), and low serine can result in production of 1-deoxysphinganine, an error product that induces growth arrest (Esaki et al., 2015; Sayano et al., 2016). The requirement to sustain nucleotide and lipid metabolism may impose a selective pressure to maintain serine availability for cancer cells in certain tissues early in tumor development. Therefore, cells that upregulate serine synthesis may be more capable of tumor initiation and progression because they can produce the various biomass components derived from serine.
Apart from potential effects on tumor initiation, serine availability may alter the apparent rate of tumor appearance. After tumor initiation, there is a period of proliferation that occurs before tumors are macroscopically detectable (Tubiana, 1989). Even for simultaneously initiated cancers, differences in serine availability could result in altered proliferation rates throughout early tumor progression that affect the time for a cancer to become clinically apparent. Thus, it could appear that higher serine diets promote cancer initiation, when in fact they affect the rate of cancer progression. Many studies to understand how diet affects cancer incidence are interpreted with respect to a risk of developing cancer; however, this study suggests that dietary alterations in nutrients levels could instead shorten the time for a cancer to become clinically apparent.
Serine availability is not the only metabolic parameter that can restrict tumor growth, and other metabolic pathways are likely selected for in response to low availability of microenvironmental nutrients. Which nutrients are most limiting for a given tumor is influenced by vascularization (Farnsworth et al., 2014), metabolic cooperation and competition with surrounding stromal and immune cells (Buck et al., 2017; Gupta et al., 2017), and nutrient scavenging ability (Recouvreux and Commisso, 2017). Furthermore, metabolite competition for membrane transport might affect nutrient uptake. As a consequence, plasma metabolite levels may not fully predict the capacity of tumors to obtain certain nutrients. The complex interplay between each of these factors could result in variability in which nutrients’ availability restrains cancer cell proliferation, even within one tissue of origin. Determining which metabolites and pathways are limiting for tumor growth has the potential to explain how cancer-associated genetic events arise and guide dietary interventions that reduce cancer progression.
Limitations of study
In this study, we utilized autochthonous melanoma and breast cancer models that are driven by oncogenes that may impact serine demand and may not fully represent the human disease. In addition, we used MDA-MB-231 cells that are derived from a breast tumor metastasis located in the lung, and may not be fully representative of a developing breast tumor. We also used plasma metabolite levels of as a proxy for nutrients available in the tumor, but additional factors could influence nutrient accessibility to cancer cells in tumors.
STAR METHODS
Contact for Reagent and Resource Sharing:
Further information and requests for resources and reagents should be directed to and will be fulfilled by the Lead Contact, Matthew Vander Heiden (mvh@mit.edu).
Experimental Model and Subject Details:
Mouse strains
PHGDHtetO mice were generated as described in (Mattaini et al., 2018), with the PHGDHtetO allele targeted to the ColA1 locus. PHGDHtetO was expressed using a R26-M2rtTA unless otherwise noted. BrafCA; Tyr-CreER and BrafCA; PTENfl/fl; Tyr-CreER mice are described in (Dankort et al., 2009), and were of mixed C57BL/6J and 129S4/SvJaeJ background. BRCAfl/fl; Trp53+/−; MMTV-Cre mice are described in (Xu et al., 1999). All experiments utilizing BRCAfl/flTrp53+/− mice also used an MMTV-rtTA (Whisenhunt et al., 2006) for mammary specific expression of PHGDH. Female NOD.Cg-Prkdcscid Il2rgtm1Wjl/SzJ (NSG) and male C57BL/6J mice were ordered from The Jackson Laboratory and were 12 weeks old at the time of experiments. All experiments were carried out in accordance with MIT Committee on Animal Care guidelines.
Cell lines
Cells were passaged in RPMI-1640 (Corning Life Sciences, Tewksbury, MA) with 10% fetal bovine serum (FBS) that had been heat inactivated for 30 min. at 56°C (VWR Seradigm, Lot 120B14). All cells were cultured in a Heracell (Thermofisher) humidified incubators at 37°C and 5% CO2. MDA-MB-231 cells were obtained from ATCC (Manassas, VA) and are derived from a breast tumor in a female patient. A control autochthonous breast tumor from a female mouse lacking the PHGDHtetO allele was used to generate the murine breast cancer cells, and that cell line was genotyped to ensure that it lacked both Brca1 and wild type Trp53.
Method Details
Mouse procedures
Mice were housed in SPF facilities kept at 68–72 °F. For all experiments using PHGDHtetO and control mice, all mice contained an rtTA and were treated with doxycycline; the only difference between experimental groups was the presence or absence of the PHGDHtetO allele. BrafCA;Tyr-CreER mice were treated on days 3 and 5 after birth with 10 μL of 50 mg/mL 4-hydroxytamoxifen (Cayman Chemical, Ann Arbor, MI, 17308) dissolved in dimethylsulfoxide using a paintbrush to spread the 4-hydroxytamoxifen across the underside of the mouse. BrafCA; Tyr-CreER mice were monitored for at least 1 year to determine if tumors developed. BrafCA; PTENfl/fl; Tyr-CreER mice were depilated with Nair (Church & Dwight, Ewing Township, NJ) over a 1 cm2 region in the lower center of the back, then treated the next day with 1 μL of 1.67 mg/mL 4-hydroxytamoxifen dissolved in 100% ethanol. Blood was collected from fed, anesthetized mice by retro-orbital bleeding at 11 AM unless otherwise indicated. Blood was placed directly into EDTA coated collection tubes (Sarstedt, Nümbrecht, Germany, 41.1395.105) and centrifuged 10’ at 845 × g; the supernatant of plasma was transferred to another tube. Mammary fat pad orthotopic injections were performed as described in (Kocaturk and Versteeg, 2015) with the following modifications: for experiments with the cell lines made from autochthonous breast tumors, 100,000 cells were injected in a volume of 100 μL phosphate buffered saline (PBS). For MDA-MB-231 experiments, 500,000 cells were injected in a volume of 100 μL PBS. For the experiment in Figure 4E, 200,000 cells were injected in a volume of 80 μL PBS. All tumors were monitored by caliper measurements. Mice were de-identified so that caliper measurements were blinded. Tumor volume was calculated using the formula ½ (width2 × length) and mice were euthanized when total tumor burden reached 1 cm3. For pancreatic implantation of cells, 100,000 cells were suspended in 100 μL PBS and injected into the pancreas. Mice were euthanized according to institutional guidelines and survival time was recorded.
Diets
Doxycycline hyclate (625 mg/kg) was administered through the diet (Envigo, Huntingdon, United Kingdom, TD.01306), which was changed once per week. Serine and glycine free (TD.160752), control (TD.110839), and high serine (TD.160575) diets were purchased from Envigo. Diet formulations are listed in Table S2.
Western blotting
Tumor pieces were homogenized in 1 mL RIPA buffer [25 mM Tris-Cl, 150 mM NaCl, 0.5% sodium deoxycholate, 1% Triton X-100, 1x cOmplete protease inhibitor (Roche, Basel, Switzerland)] using a GentleMACS tissue homogenizer (Miltenyi Biotec, Bergisch Gladbach, Germany). For tissue culture cells, cells were scraped in 300 μL RIPA buffer. In each case, the resulting lysate was clarified by centrifugation at 21000 × g for 20 min. Protein concentration of the lysate was determined by BCA assay (Thermofisher). Lysates were resuspended at 1 mg/mL in Laemmli SDS-PAGE sample loading buffer (10% glycerol, 2% SDS, 60 mM Tris-Cl pH 6.8, 1% b-mercaptoethanol, 0.01% bromophenol blue) and denatured at 100°C for 5 min. Extracts (30 μg of protein) were resolved by SDS-PAGE using 12% acrylamide gels running at 120 V until the dye front left the gel. After SDS-PAGE resolution, protein extracts were transferred to nitrocellulose using an iBlot semi-dry transfer system (Thermofisher). Membranes were blocked in 5% non-fat dry milk, incubated in primary antibodies to PHGDH (Sigma-Aldrich, St. Louis, MO, HPA021241, 1:1000) or vinculin (Abcam, Cambridge, MA, ab18058, 1:250) and detected using HRP-conjugated secondary antibodies and chemiluminescence.
Histology
Tissues were fixed in 10% formalin (VWR, Radnor, PA, 48218–700) for 24 hours at room temperature, then stored in 70% ethanol until embedding in paraffin. For immunohistochemistry, antigen retrieval was performed at 97 °C for 20 minutes using pH 6.0 citrate buffer composed of 10 mM sodium citrate and 0.05% Tween 20. The following antibodies were used for immunohistochemistry: Sox10 (Santa Cruz Biotechnology, Dallas, TX, sc-17342, 1:100), PHGDH (Sigma-Aldrich, HPA021241, 1:2000), Ki67 (BD Biosciences, Franklin Lakes, NJ, 550609, 1:40), and cleaved caspase 3 (Cell Signaling Technology, Danvers, MA 9661S, 1:300). Slides were scanned using an Aperio slide scanner (Leica Biosystems, Wetzlar, Germany), and images were analyzed using Aperio ImageScope. Ki67 and PHGDH staining was quantitated using the Positive Pixel Counter v9 in Aperio ImageScope. For Ki67, a region of each tumor measuring 1.5 mm by 0.7 mm was quantitated at 10x magnification. For PHGDH, 5 mammary glands were quantitated per mouse at 20x magnification using a color threshold of 0.1. Cleaved caspase 3 staining was quantitated by scoring 300 cells per tumor as positive or negative. Samples were de-identified before all staining quantitation.
RT-qPCR
RNA was collected from tumors using Trizol reagent (Thermofisher, Waltham, MA). Tumor pieces were digested in 1 mL of Trizol using a GentleMACS tissue homogenizer and RNA was isolated according to standard protocol (Rio et al., 2010). cDNA was reverse transcribed using an iScript cDNA Synthesis Kit (Bio-Rad, Hercules, CA). RT-qPCR was performed with SYBR Green on a LightCycler 480 II machine (Roche). Primers used are described in (Mattaini et al., 2018).
CRISPR interference
CRISPR interference (Qi et al., 2013) knockdown of PHGDH was performed using the pLV hU6-sgRNA hUbC-dCas9-KRAB-T2a-Puro plasmid described in (Thakore et al., 2015) (Addgene plasmid # 71236). Guides were selected using algorithms developed in (Horlbeck et al., 2016; Sanson et al., 2018) and are listed in the Key Resources Table.
Cell culture and media
All cell lines were regularly tested for mycoplasma contamination using the Mycoprobe mycoplasma detection kit (R and D Systems, Minneapolis, MN). For experiments, cells were grown in RPMI-1640 with the indicated concentrations of serine with 10% FBS that has been dialyzed to remove small molecules. RPMI-1640 with varying levels of serine was made using the method outlined in (Muir et al., 2017). Briefly, enough of all of the components of RPMI-1640 media except for serine were weighed out to make 25 L of media, then the resulting powder was homogenized using an electric blade coffee grinder (Hamilton Beach, Glen Allen, VA, 80365) that had been washed with methanol then water. The resulting powder was resuspended in water to make RPMI-1640 media lacking serine. Serine was dissolved in water to make 1000-fold concentrated stock solutions, then added back to RPMI-1640 media lacking serine to achieve the indicated concentrations of serine in RPMI. Cellular proliferation rate in different media conditions was determined as previously described (Sullivan et al., 2015). Briefly, cell lines proliferating in log phase in RPMI-1640 medium were trypsinized, counted and plated into six well dishes (Corning Life Sciences) in 2 mL of RPMI-1640 medium and incubated overnight. Initial seeding density was 40,000 cells/well. The next day, a six well plate of cells was trypsinized and counted to provide a number of cells at the start of the experiment. Cells were then washed twice with 2 mL of phosphate buffered saline (PBS), and 8 mL of the indicated media was added. This large volume of media was chosen to prevent nutrient depletion. Cells were then trypsinized and counted 4 days after adding the indicated media. Proliferation rate was determined using the following formula: Proliferation rate in doublings/day = [Log2(Final Day 4 cell count/Initial Day 0 cell count)]/4 days. Cells were counted using a Cellometer Auto T4 Plus Cell Counter (Nexcelom Bioscience, Lawrence, MA).
Generation of mouse tumor cell lines
A control autochthonous breast tumor arising in a female BRCAfl/fl; Trp53+/−; MMTV-Cre mouse lacking the PHGDHtetO allele was disaggregated using dissecting scissors, then resuspended in 5 mL sterile PBS with 3 mg/mL dispase II (Roche), 1 mg/mL collagenase I (Worthington Biochemical, Lakewood, NJ), and 0.1 mg/mL DNase I (Sigma-Aldrich). This solution was incubated at 37 °C for 30 minutes, then EDTA was added to a final concentration of 10 mM to stop the digestion reaction. The digested tumor was passed through a 70 μm cell strainer then washed twice with sterile PBS and plated in RPMI-1640. Genomic DNA was isolated from the cell line using a DNeasy Blood and Tissue Kit (Qiagen, Hilden, Germany) and genotyped using standard PCR methods (Mattaini et al., 2018; Xu et al., 1999) to ensure that cell lines were derived from tumor cells that had deleted Brca1 and lacked any wild type Trp53.
Metabolite extraction
For analysis of mouse plasma, 5 μL of plasma was mixed with 5 μL of a standard composed of a 13C amino acid mix (Cambridge Isotopes, Tewksbury, MA, MSK-A2–1.2) diluted to a concentration of 200 μM per amino acid in order to allow for absolute quantitation of amino acid levels. 600 μL 80% HPLC grade methanol (Sigma-Aldrich, 646377–4X4L) containing 1 μg norvaline (Sigma-Aldrich, N7627) per sample was added to each tube, vortexed for 10 minutes at 4 °C, then centrifuged at 21000 × g at 4°C for 10 minutes. 400 μL of sample was removed and dried under nitrogen. For analysis of tumor metabolites, tumors were snap-frozen in liquid nitrogen, then ground on liquid nitrogen using a mortar and pestle to obtain a homogenous powder. Approximately 10 mg of tumor powder was weighed, then 5 μL of a standard composed of a 13C amino acid mix (Cambridge Isotopes, MSK-A2–1.2) diluted to a concentration of 200 μM per amino acid, 600 μL HPLC grade methanol, 300 μL HPLC grade water (Sigma-Aldrich), and 400 μL chloroform (Sigma-Aldrich) were added. Samples were vortexed for 10 minutes at 4 °C, then centrifuged at 21000 × g at 4°C for 10 minutes. 400 μL of the aqueous layer was removed and dried under nitrogen.
13C-glucose tracing
For tracing of 13C glucose into serine, 100,000 cells were plated per well in 6-well plates (Corning Life Sciences) and allowed to attach overnight. Cells were then switched to media containing uniformly labeled 13C glucose (U-13C glucose) in place of glucose. Cells were incubated for 24 hours in media containing 13C glucose. On ice, culture media was aspirated and plates were washed three times with 150 mM NaCl. 600 μL of 80:20 HPLC grade methanol:HPLC grade water was added to each well, and cells were scraped using the top end of a pipette tip. The resulting liquid was transferred to an Eppendorf tube, vortexed for 10 minutes at 4 °C, then centrifuged at 21000 × g at 4°C for 10 minutes. 400 μL of the aqueous layer was removed and dried under nitrogen.
GC/MS
Polar metabolites were analyzed by GC-MS as described previously (Lewis et al., 2014). Dried and frozen metabolite extracts were derivatized with 16 mL MOX reagent (Thermofisher, TS-45950) for 60 min. at 37°C. Samples were then derivatized with N-tertbutyldimethylsilyl-N-methyltrifluoroacetamide with 1% tert-butyldimethylchlorosilane (Sigma-Aldrich) 30 min. at 60°C. Following derivatization, samples were analyzed by GC/MS, using a DB-35MS column (Agilent Technologies, Santa Clara, CA) installed in an Agilent 7890A gas chromatograph coupled to an Agilent 5997B mass spectrometer. Helium was used as the carrier gas at a flow rate of 1.2 mL/min. One microliter of sample was injected in split mode (all samples were split 1:1) at 270°C. After injection, the GC oven was held at 100°C for 1 min. and increased to 300°C at 3.5 °C/min. The oven was then ramped to 320°C at 20 °C/min. and held for 5 min. at this 320°C. The MS system operated under electron impact ionization at 70 eV and the MS source and quadrupole were held at 230°C and 150°C respectively. The detector was used in scanning mode, and the scanned ion range was 100–650 m/z. Mass isotopomer distributions were determined by integrating appropriate ion fragments for each metabolite (Lewis et al., 2014) using in-house software (Young et al., 2008) that corrects for natural abundance using previously described methods (Fernandez et al., 1996). Absolute quantitation of samples was obtained by comparing peak area for the 12C amino acid with the peak area of the corresponding 13C standard. α-ketoglutarate abundance was quantitated by normalizing the α-ketoglutarate peak area to a norvaline internal standard and to the weight of the tumor that was extracted for analysis.
LC/MS
Dried tumor extracts were resuspended in 100 μL HPLC grade water. LC-MS analysis was performed using a QExactive orbitrap mass spectrometer using an Ion Max source and heated electro- spray ionization (HESI) probe coupled to a Dionex Ultimate 3000 UPLC system (Thermofisher). External mass calibration was performed every 7 days. Samples were separated by chromatography by injecting 10 μL of sample on a SeQuant ZIC-pHILIC 2.1 mm x 150 mm (5 μm particle size) column. Flow rate was set to 150 mL/min. and temperatures were set to 25°C for the column compartment and 4°C for the autosampler tray. Mobile phase A was 20 mM ammonium carbonate, 0.1% ammonium hydroxide. Mobile phase B was 100% acetonitrile. The chromatographic gradient was: 0–20 min.: linear gradient from 80% to 20% mobile phase B; 20–20.5 min.: linear gradient from 20% to 80% mobile phase B; 20.5 to 28 min.: hold at 80% mobile phase B. The mass spectrometer was operated in full scan, polarity-switching mode and the spray voltage was set to 3.0 kV, the heated capillary held at 275°C, and the HESI probe was held at 350°C. The sheath gas flow rate was 40 units, the auxiliary gas flow was 15 units and the sweep gas flow was one unit. The MS data acquisition was performed in a range of 70–1000 m/z, with the resolution set set at 70,000, the AGC target at 1×10⁶, and the maximum injection time at 20 msec. Relative quantitation of polar metabolites was performed with XCalibur QuanBrowser 2.2 (Thermo Fisher Scientific) using a 5 ppm mass tolerance and referencing an in-house library of chemical standards. Peak areas were normalized to tumor weight and 13C-leucine standard peak area.
Quantification and statistical analysis
Survival of BrafCA; PTENfl/fl; Tyr-CreER mice was compared using a stratified Cox proportional hazards model in order to test whether PHGDH expression scales up the relative hazard ratios in both male and female mice, which have different baseline hazards in this model. Survival of BRCAfl/fl; Trp53+/− mice was compared using a Mantel-Cox log-rank test. Mice were excluded from survival studies if they displayed non-tumor related health problems. No other data was excluded from the study. All further statistical information is described in the figure legends.
Supplementary Material
Table S1. Related to Figure 2; Plasma amino acid concentrations for mice described in Figure 2.
Highlights:
PHGDH expression accelerates mouse models of melanoma and breast cancer
Physiological serine levels can restrain tumor growth in breast cancer
Increased dietary serine levels can accelerate tumor progression
PHGDH expression only benefits tumors in tissues with low serine availability
Context and Significance:
In order to expand, tumors must consume various nutrients. Understanding which of these nutrients are limiting for specific kinds of cancer and blocking their availability may be a new form of anti-cancer therapy. Here, researchers show that certain tumor types, such as melanoma and breast cancer, are unable to acquire enough of one particular nutrient, the amino acid serine, from their environment. However, such tumors can adapt by increasing their own production of serine. These results suggest that cancers arising in some tissues may be particularly sensitive to anti-cancer therapies that decrease the capacity for tumors to produce serine or acquire it from their local environment.
ACKNOWLEDGEMENTS
We thank Jen Sinnott for assistance with statistical analysis, and the Koch Institute Swanson Biotechnology Center for technical support, specifically Kathy Cormier. K.R.M. was supported by NSF Graduate Research Fellowship DGE-1122374. K.R.M. and M.R.S. were supported by T32-GM007287, and M.R.S. acknowledges support from an MIT Koch Institute Graduate Fellowship. A.M. was supported by F32CA213810. M.G.V.H. acknowledges support from R21CA198028, R01CA168653, the MIT Ludwig Center, the MIT Center for Precision Cancer Medicine, SU2C, the Lustgarten Foundation, and a Faculty Scholar Grant from HHMI.
Footnotes
DECLARATION OF INTERESTS
M.G.V.H. is on the scientific advisory board of Agios Pharmaceuticals, Aeglea Biotherapeutics, and Auron Therapeutics. The other authors declare no competing interests.
Publisher's Disclaimer: This is a PDF file of an unedited manuscript that has been accepted for publication. As a service to our customers we are providing this early version of the manuscript. The manuscript will undergo copyediting, typesetting, and review of the resulting proof before it is published in its final citable form. Please note that during the production process errors may be discovered which could affect the content, and all legal disclaimers that apply to the journal pertain.
REFERENCES
- Adams CM (2007). Role of the transcription factor ATF4 in the anabolic actions of insulin and the anti-anabolic actions of glucocorticoids. J Biol Chem 282, 16744–16753. [DOI] [PubMed] [Google Scholar]
- Aird KM, Zhang G, Li H, Tu Z, Bitler BG, Garipov A, Wu H, Wei Z, Wagner SN, Herlyn M, et al. (2013). Suppression of nucleotide metabolism underlies the establishment and maintenance of oncogene-induced senescence. Cell Rep 3, 1252–1265. [DOI] [PMC free article] [PubMed] [Google Scholar]
- Anlinker J, and Mayer J (1956). An Operant Conditioning Technique for Studying Feeding-Fasting Patterns in Normal and Obese Mice. Journal of Applied Physiology 8, 667–670. [DOI] [PubMed] [Google Scholar]
- Bao XR, Ong SE, Goldberger O, Peng J, Sharma R, Thompson DA, Vafai SB, Cox AG, Marutani E, Ichinose F, et al. (2016). Mitochondrial dysfunction remodels onecarbon metabolism in human cells. Elife 5. [DOI] [PMC free article] [PubMed] [Google Scholar]
- Ben-Sahra I, Hoxhaj G, Ricoult SJH, Asara JM, and Manning BD (2016). mTORC1 induces purine synthesis through control of the mitochondrial tetrahydrofolate cycle. Science 351, 728–733. [DOI] [PMC free article] [PubMed] [Google Scholar]
- Buck MD, Sowell RT, Kaech SM, and Pearce EL (2017). Metabolic Instruction of Immunity. Cell 169, 570–586. [DOI] [PMC free article] [PubMed] [Google Scholar]
- Chen JY, Chung F, Yang GZ, Pu MY, Gao H, Jiang W, Yin H, Capka V, Kasibhatla S, Laffitte B, et al. (2013). Phosphoglycerate dehydrogenase is dispensable for breast tumor maintenance and growth. Oncotarget 4, 2502–2511. [DOI] [PMC free article] [PubMed] [Google Scholar]
- Chiang PK, Gordon RK, Tal J, Zeng GC, Doctor BP, Pardhasaradhi K, and McCann PP (1996). S-Adenosylmethionine and methylation. FASEB J 10, 471–480. [PubMed] [Google Scholar]
- Chin L (2003). The genetics of malignant melanoma: lessons from mouse and man. Nat Rev Cancer 3, 559–570. [DOI] [PubMed] [Google Scholar]
- Damsky W, Micevic G, Meeth K, Muthusamy V, Curley DP, Santhanakrishnan M, Erdelyi I, Platt JT, Huang L, Theodosakis N, et al. (2015). mTORC1 activation blocks BrafV600E-induced growth arrest but is insufficient for melanoma formation. Cancer Cell 27, 41–56. [DOI] [PMC free article] [PubMed] [Google Scholar]
- Dankort D, Curley DP, Cartlidge RA, Nelson B, Karnezis AN, Damsky WE Jr., You MJ, DePinho RA, McMahon M, and Bosenberg M (2009). Braf(V600E) cooperates with Pten loss to induce metastatic melanoma. Nat Genet 41, 544–552. [DOI] [PMC free article] [PubMed] [Google Scholar]
- DeNicola GM, Chen PH, Mullarky E, Sudderth JA, Hu Z, Wu D, Tang H, Xie Y, Asara JM, Huffman KE, et al. (2015). NRF2 regulates serine biosynthesis in nonsmall cell lung cancer. Nat Genet 47, 1475–1481. [DOI] [PMC free article] [PubMed] [Google Scholar]
- Ding J, Li T, Wang X, Zhao E, Choi JH, Yang L, Zha Y, Dong Z, Huang S, Asara JM, et al. (2013). The histone H3 methyltransferase G9A epigenetically activates the serine-glycine synthesis pathway to sustain cancer cell survival and proliferation. Cell Metab 18, 896–907. [DOI] [PMC free article] [PubMed] [Google Scholar]
- Esaki K, Sayano T, Sonoda C, Akagi T, Suzuki T, Ogawa T, Okamoto M, Yoshikawa T, Hirabayashi Y, and Furuya S (2015). L-Serine Deficiency Elicits Intracellular Accumulation of Cytotoxic Deoxysphingolipids and Lipid Body Formation. J Biol Chem 290, 14595–14609. [DOI] [PMC free article] [PubMed] [Google Scholar]
- Fan J, Teng X, Liu L, Mattaini KR, Looper RE, Vander Heiden MG, and Rabinowitz JD (2015). Human phosphoglycerate dehydrogenase produces the oncometabolite D-2-hydroxyglutarate. ACS Chem Biol 10, 510–516. [DOI] [PMC free article] [PubMed] [Google Scholar]
- Farnsworth RH, Lackmann M, Achen MG, and Stacker SA (2014). Vascular remodeling in cancer. Oncogene 33, 3496–3505. [DOI] [PubMed] [Google Scholar]
- Feng D, and Lazar MA (2012). Clocks, metabolism, and the epigenome. Mol Cell 47, 158–167. [DOI] [PMC free article] [PubMed] [Google Scholar]
- Fernandez CA, DesRosiers C, Previs SF, David F, and Brunengraber H (1996). Correction of C-13 mass isotopomer distributions for natural stable isotope abundance. Journal of Mass Spectrometry 31, 255–262. [DOI] [PubMed] [Google Scholar]
- Gao X, Lee K, Reid MA, Sanderson SM, Qiu C, Li S, Liu J, and Locasale JW (2018). Serine Availability Influences Mitochondrial Dynamics and Function through Lipid Metabolism. Cell Rep 22, 3507–3520. [DOI] [PMC free article] [PubMed] [Google Scholar]
- Gupta S, Roy A, and Dwarakanath BS (2017). Metabolic Cooperation and Competition in the Tumor Microenvironment: Implications for Therapy. Front Oncol 7, 68. [DOI] [PMC free article] [PubMed] [Google Scholar]
- Hausinger RP (2004). FeII/alpha-ketoglutarate-dependent hydroxylases and related enzymes. Crit Rev Biochem Mol Biol 39, 21–68. [DOI] [PubMed] [Google Scholar]
- Horlbeck MA, Gilbert LA, Villalta JE, Adamson B, Pak RA, Chen Y, Fields AP, Park CY, Corn JE, Kampmann M, et al. (2016). Compact and highly active next-generation libraries for CRISPR-mediated gene repression and activation. Elife 5. [DOI] [PMC free article] [PubMed] [Google Scholar]
- Hosios AM, Hecht VC, Danai LV, Johnson MO, Rathmell JC, Steinhauser ML, Manalis SR, and Vander Heiden MG (2016). Amino Acids Rather than Glucose Account for the Majority of Cell Mass in Proliferating Mammalian Cells. Dev Cell 36, 540–549. [DOI] [PMC free article] [PubMed] [Google Scholar]
- Hwang IY, Kwak S, Lee S, Kim H, Lee SE, Kim JH, Kim YA, Jeon YK, Chung DH, Jin X, et al. (2016). Psat1-Dependent Fluctuations in alpha-Ketoglutarate Affect the Timing of ESC Differentiation. Cell Metab 24, 494–501. [DOI] [PubMed] [Google Scholar]
- Kalhan SC, Uppal SO, Moorman JL, Bennett C, Gruca LL, Parimi PS, Dasarathy S, Serre D, and Hanson RW (2011). Metabolic and genomic response to dietary isocaloric protein restriction in the rat. J Biol Chem 286, 5266–5277. [DOI] [PMC free article] [PubMed] [Google Scholar]
- Kocaturk B, and Versteeg HH (2015). Orthotopic injection of breast cancer cells into the mammary fat pad of mice to study tumor growth. J Vis Exp. [DOI] [PMC free article] [PubMed] [Google Scholar]
- Labuschagne CF, van den Broek NJ, Mackay GM, Vousden KH, and Maddocks ODK (2014). Serine, but not glycine, supports one-carbon metabolism and proliferation of cancer cells. Cell Rep 7, 1248–1258. [DOI] [PubMed] [Google Scholar]
- Lane AN, and Fan TW (2015). Regulation of mammalian nucleotide metabolism and biosynthesis. Nucleic Acids Res 43, 2466–2485. [DOI] [PMC free article] [PubMed] [Google Scholar]
- Lewis CA, Parker SJ, Fiske BP, McCloskey D, Gui DY, Green CR, Vokes NI, Feist AM, Vander Heiden MG, and Metallo CM (2014). Tracing compartmentalized NADPH metabolism in the cytosol and mitochondria of mammalian cells. Mol Cell 55, 253–263. [DOI] [PMC free article] [PubMed] [Google Scholar]
- Li S, Swanson SK, Gogol M, Florens L, Washburn MP, Workman JL, and Suganuma T (2015). Serine and SAM Responsive Complex SESAME Regulates Histone Modification Crosstalk by Sensing Cellular Metabolism. Mol Cell 60, 408–421. [DOI] [PubMed] [Google Scholar]
- Locasale JW, Grassian AR, Melman T, Lyssiotis CA, Mattaini KR, Bass AJ, Heffron G, Metallo CM, Muranen T, Sharfi H, et al. (2011). Phosphoglycerate dehydrogenase diverts glycolytic flux and contributes to oncogenesis. Nat Genet 43, 869–874. [DOI] [PMC free article] [PubMed] [Google Scholar]
- Ma EH, Bantug G, Griss T, Condotta S, Johnson RM, Samborska B, Mainolfi N, Suri V, Guak H, Balmer ML, et al. (2017). Serine Is an Essential Metabolite for Effector T Cell Expansion. Cell Metab 25, 345–357. [DOI] [PubMed] [Google Scholar]
- Maddocks ODK, Athineos D, Cheung EC, Lee P, Zhang T, van den Broek NJF, Mackay GM, Labuschagne CF, Gay D, Kruiswijk F, et al. (2017). Modulating the therapeutic response of tumours to dietary serine and glycine starvation. Nature 544, 372–376. [DOI] [PubMed] [Google Scholar]
- Maddocks ODK, Berkers CR, Mason SM, Zheng L, Blyth K, Gottlieb E, and Vousden KH (2013). Serine starvation induces stress and p53-dependent metabolic remodelling in cancer cells. Nature 493, 542–546. [DOI] [PMC free article] [PubMed] [Google Scholar]
- Mattaini KR, Brignole EJ, Kini M, Davidson SM, Fiske BP, Drennan CL, and Vander Heiden MG (2015). An epitope tag alters phosphoglycerate dehydrogenase structure and impairs ability to support cell proliferation. Cancer Metab 3, 5. [DOI] [PMC free article] [PubMed] [Google Scholar]
- Mattaini KR, Sullivan MR, Lau AN, Fiske BP, Bronson RT, and Vander Heiden MG (2018). Increased PHGDH expression uncouples hair follicle cycle progression and promotes inappropriate melanin accumulation. BioRxiv pre-print. 10.1101/249250 [DOI] [Google Scholar]
- Muir A, Danai LV, Gui DY, Waingarten CY, Lewis CA, and Vander Heiden MG (2017). Environmental cystine drives glutamine anaplerosis and sensitizes cancer cells to glutaminase inhibition. Elife 6. [DOI] [PMC free article] [PubMed] [Google Scholar]
- Mullarky E, Lucki NC, Beheshti Zavareh R, Anglin JL, Gomes AP, Nicolay BN, Wong JC, Christen S, Takahashi H, Singh PK, et al. (2016). Identification of a small molecule inhibitor of 3-phosphoglycerate dehydrogenase to target serine biosynthesis in cancers. Proc Natl Acad Sci U S A 113, 1778–1783. [DOI] [PMC free article] [PubMed] [Google Scholar]
- Mullen TD, Hannun YA, and Obeid LM (2012). Ceramide synthases at the centre of sphingolipid metabolism and biology. Biochem J 441, 789–802. [DOI] [PMC free article] [PubMed] [Google Scholar]
- Newman AC, and Maddocks ODK (2017). Serine and Functional Metabolites in Cancer. Trends Cell Biol 27, 645–657. [DOI] [PubMed] [Google Scholar]
- Nilsson LM, Forshell TZ, Rimpi S, Kreutzer C, Pretsch W, Bornkamm GW, and Nilsson JA (2012). Mouse genetics suggests cell-context dependency for Myc-regulated metabolic enzymes during tumorigenesis. PLoS Genet 8, e1002573. [DOI] [PMC free article] [PubMed] [Google Scholar]
- Ou Y, Wang SJ, Jiang L, Zheng B, and Gu W (2015). p53 Protein-mediated regulation of phosphoglycerate dehydrogenase (PHGDH) is crucial for the apoptotic response upon serine starvation. J Biol Chem 290, 457–466. [DOI] [PMC free article] [PubMed] [Google Scholar]
- Pacold ME, Brimacombe KR, Chan SH, Rohde JM, Lewis CA, Swier LJ, Possemato R, Chen WW, Sullivan LB, Fiske BP, et al. (2016). A PHGDH inhibitor reveals coordination of serine synthesis and one-carbon unit fate. Nat Chem Biol 12, 452–458. [DOI] [PMC free article] [PubMed] [Google Scholar]
- Pan M, Reid MA, Lowman XH, Kulkarni RP, Tran TQ, Liu X, Yang Y, Hernandez-Davies JE, Rosales KK, Li H, et al. (2016). Regional glutamine deficiency in tumours promotes dedifferentiation through inhibition of histone demethylation. Nat Cell Biol 18, 1090–1101. [DOI] [PMC free article] [PubMed] [Google Scholar]
- Pavlova NN, and Thompson CB (2016). The Emerging Hallmarks of Cancer Metabolism. Cell Metab 23, 27–47. [DOI] [PMC free article] [PubMed] [Google Scholar]
- Possemato R, Marks KM, Shaul YD, Pacold ME, Kim D, Birsoy K, Sethumadhavan S, Woo HK, Jang HG, Jha AK, et al. (2011). Functional genomics reveal that the serine synthesis pathway is essential in breast cancer. Nature 476, 346–350. [DOI] [PMC free article] [PubMed] [Google Scholar]
- Qi LS, Larson MH, Gilbert LA, Doudna JA, Weissman JS, Arkin AP, and Lim WA (2013). Repurposing CRISPR as an RNA-guided platform for sequence-specific control of gene expression. Cell 152, 1173–1183. [DOI] [PMC free article] [PubMed] [Google Scholar]
- Recouvreux MV, and Commisso C (2017). Macropinocytosis: A Metabolic Adaptation to Nutrient Stress in Cancer. Front Endocrinol (Lausanne) 8, 261. [DOI] [PMC free article] [PubMed] [Google Scholar]
- Rio DC, Ares M Jr., Hannon GJ, and Nilsen TW (2010). Purification of RNA using TRIzol (TRI reagent). Cold Spring Harb Protoc 2010, pdb prot5439. [DOI] [PubMed] [Google Scholar]
- Samanta D, Park Y, Andrabi SA, Shelton LM, Gilkes DM, and Semenza GL (2016). PHGDH Expression Is Required for Mitochondrial Redox Homeostasis, Breast Cancer Stem Cell Maintenance, and Lung Metastasis. Cancer Res 76, 4430–4442. [DOI] [PubMed] [Google Scholar]
- Sanson KR, Hanna RE, Hegde M, Donovan KF, Strand C, Sullender ME, Vaimberg EW, Goodale A, Root DE, Piccioni F, et al. (2018). Optimized libraries for CRISPR-Cas9 genetic screens with multiple modalities. Nat Commun 9, 5416. [DOI] [PMC free article] [PubMed] [Google Scholar]
- Sayano T, Kawano Y, Kusada W, Arimoto Y, Esaki K, Hamano M, Udono M, Katakura Y, Ogawa T, Kato H, et al. (2016). Adaptive response to l-serine deficiency is mediated by p38 MAPK activation via 1-deoxysphinganine in normal fibroblasts. FEBS Open Bio 6, 303–316. [DOI] [PMC free article] [PubMed] [Google Scholar]
- Segui B, Andrieu-Abadie N, Jaffrezou JP, Benoist H, and Levade T (2006). Sphingolipids as modulators of cancer cell death: potential therapeutic targets. Biochim Biophys Acta 1758, 2104–2120. [DOI] [PubMed] [Google Scholar]
- Sullivan LB, Gui DY, Hosios AM, Bush LN, Freinkman E, and Vander Heiden MG (2015). Supporting Aspartate Biosynthesis Is an Essential Function of Respiration in Proliferating Cells. Cell 162, 552–563. [DOI] [PMC free article] [PubMed] [Google Scholar]
- Thakore PI, D’Ippolito AM, Song L, Safi A, Shivakumar NK, Kabadi AM, Reddy TE, Crawford GE, and Gersbach CA (2015). Highly specific epigenome editing by CRISPR-Cas9 repressors for silencing of distal regulatory elements. Nat Methods 12, 1143–1149. [DOI] [PMC free article] [PubMed] [Google Scholar]
- Trabado S, Al-Salameh A, Croixmarie V, Masson P, Corruble E, Feve B, Colle R, Ripoll L, Walther B, Boursier-Neyret C, et al. (2017). The human plasma-metabolome: Reference values in 800 French healthy volunteers; impact of cholesterol, gender and age. PLoS One 12, e0173615. [DOI] [PMC free article] [PubMed] [Google Scholar]
- Tubiana M (1989). Tumor Cell Proliferation Kinetics and Tumor Growth Rate. Acta Oncologica 28, 113–121. [DOI] [PubMed] [Google Scholar]
- Vance JE, and Tasseva G (2013). Formation and function of phosphatidylserine and phosphatidylethanolamine in mammalian cells. Biochim Biophys Acta 1831, 543–554. [DOI] [PubMed] [Google Scholar]
- Vander Heiden MG, and DeBerardinis RJ (2017). Understanding the Intersections between Metabolism and Cancer Biology. Cell 168, 657–669. [DOI] [PMC free article] [PubMed] [Google Scholar]
- Whisenhunt TR, Yang X, Bowe DB, Paterson AJ, Van Tine BA, and Kudlow JE (2006). Disrupting the enzyme complex regulating O-GlcNAcylation blocks signaling and development. Glycobiology 16, 551–563. [DOI] [PubMed] [Google Scholar]
- Xu X, Wagner KU, Larson D, Weaver Z, Li C, Ried T, Hennighausen L, Wynshaw-Boris A, and Deng CX (1999). Conditional mutation of Brca1 in mammary epithelial cells results in blunted ductal morphogenesis and tumour formation. Nat Genet 22, 37–43. [DOI] [PubMed] [Google Scholar]
- Ye D, Guan KL, and Xiong Y (2018). Metabolism, Activity, and Targeting of D- and L-2-Hydroxyglutarates. Trends Cancer 4, 151–165. [DOI] [PMC free article] [PubMed] [Google Scholar]
- Young JD, Walther JL, Antoniewicz MR, Yoo H, and Stephanopoulos G (2008). An elementary metabolite unit (EMU) based method of isotopically nonstationary flux analysis. Biotechnol Bioeng 99, 686–699. [DOI] [PubMed] [Google Scholar]
- Zambrowicz BP, Imamoto A, Fiering S, Herzenberg LA, Kerr WG, and Soriano P (1997). Disruption of overlapping transcripts in the ROSA beta geo 26 gene trap strain leads to widespread expression of beta-galactosidase in mouse embryos and hematopoietic cells. Proc Natl Acad Sci U S A 94, 3789–3794. [DOI] [PMC free article] [PubMed] [Google Scholar]
Associated Data
This section collects any data citations, data availability statements, or supplementary materials included in this article.
Supplementary Materials
Table S1. Related to Figure 2; Plasma amino acid concentrations for mice described in Figure 2.