

Abstract
Despite many neuroimaging studies in the past years, the neuroanatomical substrates of major depressive disorder (MDD) subcortical structures are still not well understood. Since hippocampus and amygdala are the two vital subcortical structures that most susceptible to MDD, finding the evidence of morphological changes in their subregions may bring some new insights for MDD research. Combining structural magnetic resonance imaging (MRI) with novel morphometry analysis methods, we recruited 25 MDD patients and 28 healthy controls (HC), and investigated their volume and morphological differences in hippocampus and amygdala. Relative to volumetric method, our methods detected more significant global morphological atrophies (p<0.05). More precisely, subiculum and cornu ammonis (CA) 1 subregions of bilateral hippocampus, lateral (LA) and basolateral ventromedial (BLVM) of left amygdala and LA, BLVM, central (CE), amygdalostriatal transition area (ASTR), anterior cortical (ACO) and anterior amygdaloid area (AAA) of right amygdala were demonstrated prone to atrophy. Correlation analyses between each subject’s surface eigenvalues and Hamilton Depression Scale (HAMD) were then performed. Correlation results showed that atrophy areas in hippocampus and amygdala have slight tendencies of expanding into other subregions with the development of MDD. Finally, we performed group morphometric analysis and drew the atrophy and expansion areas between MDD-Medicated group (only 19 medicated subjects in MDD group were included) and HC group, found some preliminary evidence about subregional morphological resilience of hippocampus and amygdala. These findings revealed new pathophysiologic patterns in the subregions of hippocampus and amygdala, which can help with subsequent smaller-scale MDD research.
Keywords: Hippocampus, Amygdala, Major depressive disorder, Subcortical structures, morphometry
Introduction
Major depressive disorder (MDD) is a widely prevalent (Kessler et al. 2003; Hasin et al. 2005; J. Ferrari et al. 2013), costly (Greenberg and Birnbaum 2005; Wang et al. 2010) and recurrent mental disease (Sullivan et al. 2000), which affecting approximately 350 million people each year (Marcus et al. 2012). Because of the general impairments on cognitive functions (Snyder 2013), MDD patients always meet serious obstructions in social contact, education and occupation (Kessler et al. 2005; Snyder 2013). The causes of MDD are complex, its pathogenesis and profile of effects in the brain are still rudimentary compared with knowledge of other common chronic and potentially fatal multifactorial conditions (Krishnan and Nestler 2008; Nho et al. 2015; Schmaal et al. 2017).
Documented by prior research, hippocampi and amygdalae played a vital role in the regulation of emotional learning (Morris et al. 1998), expression (Adolphs et al. 1994), working memory (Winocur et al. 2006; Saxe et al. 2007) and broad information processing associated with memory (Wood et al. 1999), which were always considered more easily affected in MDD (Sheline et al. 1996; Sheline et al. 1998; Mervaala et al. 2000; C. Lange and E. Irle 2004; Hastings et al. 2004; Videbech and Ravnkilde 2004; Tang et al. 2007; Hamilton et al. 2008; Kronenberg et al. 2009; Van et al. 2009). The study of these two structures may provide a potential seat for a clear description of morphological alterations underlying corresponding neurological dysfunctions. Many prior structural MRI research found that MDD group have reduced volumes of hippocampi (Sheline et al. 1996; Mervaala et al. 2000; C. Lange and E. Irle 2004; Maller et al. 2007), especially on the bilateral sides of tail parts (Maller et al. 2007; Malykhin et al. 2010). Even HC subjects could show a relative smaller volume of left and right hippocampus if their mothers have recurrent episodes of depression (Chen et al. 2010). As for amygdala, volumetric findings in MDD studies are inconsistent (Gunten et al. 2000; Frodl et al. 2002; Frodl et al. 2003; C. Lange and E. Irle 2004; Hastings et al. 2004; Rosso et al. 2005; Kronenberg et al. 2009; Van et al. 2009). Both greater (Frodl et al. 2002; Frodl et al. 2003; C. Lange and E. Irle 2004; Van et al. 2009) and smaller (Sheline et al. 1998; Gunten et al. 2000; Hastings et al. 2004; Rosso et al. 2005; Kronenberg et al. 2009) amygdalae were showed.
To our knowledge, all of the above studies were focusing on volumetric analyses (Sheline et al. 1996; Sheline et al. 1998; Mervaala et al. 2000; C. Lange and E. Irle 2004; Hastings et al. 2004; Tang et al. 2007; Hamilton et al. 2008). Although these previous studies have yielded many good insights in volumetric changes of MDD group, inconsistent findings (especially for the amygdala) have still not been reasonably addressed. This may due to that volumetric methods usually give a more general description on the whole or partial volume of hippocampus and amygdala, while more subdividable research is still lacking. Recent years, some studies provided evidence that hippocampus and amygdala are anatomically subdividable (Ballmaier et al. 2008; Cavedo et al. 2011; Dudek et al. 2016) — different subregions of hippocampus and amygdala have different inputs from and outputs to different brain regions subserving a number of specific functions. In fact, the internal pathological changes of hippocampus and amygdala during MDD duration are complex and microcosmic—changes of synaptic strength (Linden and Connor 2003; Bannerman et al. 2014), neural circuits (Price and Drevets 2012) and brain-derived neurotrophic factor (Angelucci et al. 2005; Bus et al. 2015) were all be documented. From literature, we found few studies have tried to explore the subregional deformations in hippocampi and amygdalae. Nonetheless, two prior studies, in structure and function, revealed heterogeneous mechanism in different subregions of human hippocampus. Ballmaier et al. (2008) found the regional surface contractions caused by late-onset elderly MDD were occurred in specific subfields rather than the whole left and right hippocampus. Dimsdalezucker et al. (2018) demonstrated CA1 and CA3 subregions of hippocampus differentially support spontaneous retrieval of episodic contexts. These two subregional findings implied that it is advantageous to study the deformations in the scale of subregions in both hippocampi and amygdalae of MDD group.
Several prior studies (C. Lange and E. Irle 2004; Hamilton et al. 2008; Van et al. 2009; Malykhin et al. 2010) pointed out that medicated MDD subjects have increased hippocampal volume compared with unmedicated patients. However, few research have explored whether the recovery effects were also existed in the subregional morphometry of hippocampus and amygdala.
The aim of our study is fourfold. First, by leveraging our novel subcortical morphometry pipeline (Wang et al. 2013a; Lao et al. 2016), we want to validate the hypothesis that the subregional morphometric alterations may more significant and sensitive than the whole volume alterations in hippocampus and amygdala when comparing MDD patients with controls. These subregional alterations can reveal more details about the pathogenesis of MDD and its influence to local brain functions. Second, we try to investigate which of these areas of significance are atrophy areas and which are expansion areas, further determining the morphological change direction of the subregions. Third, we will calculate the correlations between the surface eigenvalues and the scores of Hamilton Depression Scale (see (Bech et al. 1981), HAMD is a measure of the severity of depressive states), attempting to find the potential morphological development tendency of hippocampus and amygdala during MDD duration. Fourth, a MDD subgroup — MDD-Medicated group will be picked to perform the same pipeline with HC group, for exploring the recovery effects in subregional morphometry of hippocampus and amygdala after medicated.
Materials and methods
Participants
Participants in this study included 25 patients diagnosed with MDD and 28 age- and sex- matched healthy controls. The MDD patients were recruited from the Gansu Provincial Hospital, while the HC subjects were recruited through newspaper advertisements. MDD participants were diagnosed by two experienced psychiatrists using Structured Clinical Interview for DSM-IV Axis I Disorders (SCID) (First et al. 2002). The inclusion criteria for MDD patients were as follows: (1) met the DSM-IV (SCID) for MDD; (2) 19–65 years with the ability to give voluntary informed consent; (3) satisfied criteria for undergoing an MRI scan; and (4) could be managed as outpatients. Of all the MDD patients, six patients were currently medication free, five patients were treated with monotherapy (with one of the lexapro, paroxetine, fluoxetine, deanxit, zoloft and effexor), and 14 patients were treated with combination therapy (with two or more of the lexapro, paroxetine, fluoxetine, deanxit, zoloft and effexor). The HC subjects were enrolled if they had no current or past history of MDD, other major physical or neurological illness, or substance abuse. All HC subjects were interviewed using the Structured Clinical Interview for DSM-IV, non-patient edition. All the MDD and HC subjects were right-handed. HC participants were excluded if they reported a first-degree relative with a mood disorder or for any exclusion criteria of the MRI scanning. Both MDD patients and HC participants have executed the evaluation of 17-item Hamilton Rating Scale for Depression (HAMD-17).
MRI data acquisition
Imaging was performed on a 3.0 T Siemens Trio scanner (Siemens, Erlangen, Germany). The 3D T1-weighted image was acquired covering the whole brain (128 sagittal slices, repetition time (TR) = 2530 ms, echo time (TE) = 3.39 ms, slice thickness/gap = 1.33/0 mm, in-plane resolution = 256×192 mm, inversion time (TI) = 1100 ms, field of view (FOV) = 256×256 mm, flip angle (FA) = 7º). The scans were optimized for the best gray and white matter contrast, both at the cortical and at the subcortical/deep gray level.
Segmentation, reconstruction and registration
All the T1-weighted brain volume MRI scans were automatically segmented using FIRST (available at https://fmrib.ox.ac.uk/fsl/fslwiki/FIRST/), which is an integrated tool developed as a part of the FSL library. These segmented images were spatially normalized to the MNI template space with a 9-parameter (3 translations, 3 rotations and 3 scales) linear transformation using Minctracc algorithm (Collins et al. 1994) for the correction of head tilt and alignment. To equalize image intensities across subjects, registered scans were also histogram-matched. After segmentation for the hippocampus and amygdala for each participant, the results were strictly checked by two independent anatomists to verify their quality.
All the segmentation results of hippocampus and amygdala were then processed through surface conformal slit mapping (Wang et al. 2008). This method allows us to compare and analyze surface data effectively on a simpler parameter domain, which avoids considering the complicated brain surfaces (Wang et al. 2013a). Finally, we aligned surfaces in the parameter domain with a fluid registration technique to maintain smooth, one-to-one topology (Christensen et al. 2002; Shi et al. 2013). The one-to-one correspondence achieved between vertices allows us to accurately analyze localized information on the surfaces of hippocampus and amygdala.
The whole processing pipeline
Fig. 1 illustrates the whole processing pipeline applied in this paper, which includes the segmentation of subcortical structures, surface reconstruction, surface registration, group difference analysis, the calculation of atrophy and expansion areas and the correlation analysis between surface eigenvalues of MDD subjects and their HAMD scores.
Fig. 1.
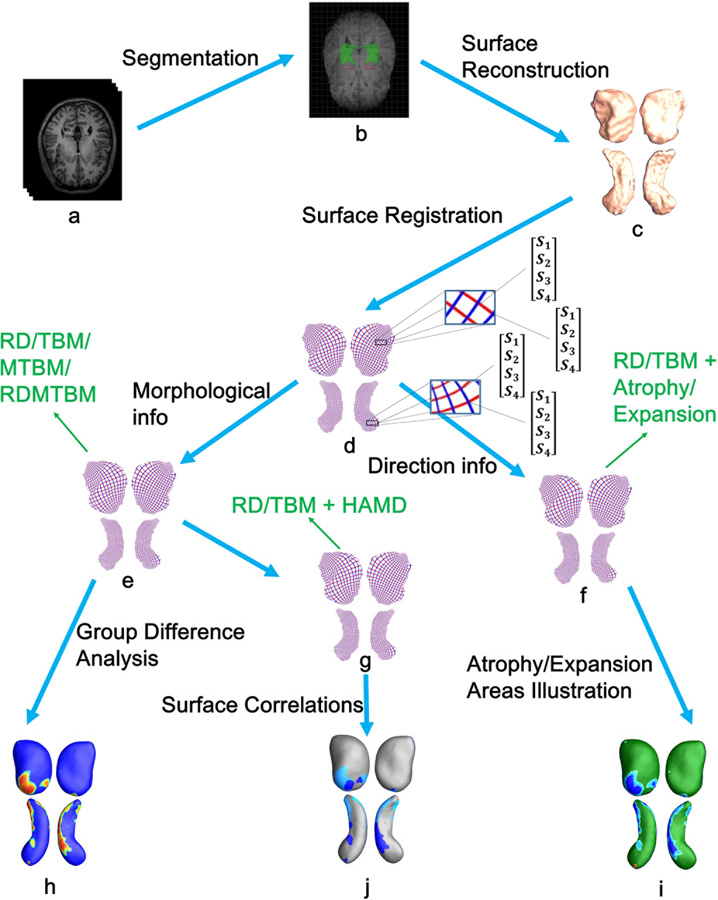
For simplicity, only the surfaces of left amygdala and hippocampus are used for illustration. In the pipeline, letters a—j represent: a T1-MR images; b subcortical structure segmentation; c reconstruction of 3D surface models; d one-to-one correspondence obtained from surface registration; e surface morphological information acquisition; f combine RD/TBM values with atrophy/expansion areas calculated by expression (2) and (3); g combine RD/TBM values with HAMD scores; h group difference analysis; i the atrophy and expansion areas of MDD group versus HC group; j the correlation analysis between each MDD subject’s surface eigenvalues (RD/TBM) and their HAMD scores.
Group differences mapping
To detect group differences in the subdivisions of hippocampus and amygdala, some novel features were used, including:
The RD: radial distance, refers to the distance from a medial axis to a vertex on the surface — which represents the thickness of the shape at each vertex to the medial axis (Pizer et al. 1999; Thompson et al. 2004). The iso-parametric curve (see red curves in Fig. 1 d) is perpendicular to the medial axis, on the computed conformal grid (Wang et al. 2011), after which RD value is easily found at each vertex.
- The TBM: surface tensor-based morphometry (Davatzikos 1996; Thompson et al. 2000; Woods 2003; Chung et al. 2008) examines spatial derivatives (detJ, where J is the Jacobian matrix of the deformation from the registration) of the deformation maps that register brains to common template. Suppose is a map from surface S1 to surface S2. The derivative map of is the linear map between the tangent spaces , induced by the map , which also defines the Jacobian matrix of . In the grid surface, the derivative map is approximated by the linear map from one face [v1, v2, v3] to another [w1, w2, w3]. First, the surfaces [v1, v2, v3] and [w1, w2, w3] are isometrically embedded onto the Klein disk (Shi et al. 2015), the planar coordinates of the vertices vi, wi are denoted by the same symbol vi, wi. Then the Jacobian matrix for the derivative map can be explicitly computed as (Wang et al. 2009):
Finally, the TBM is defined as . TBM is complementary to RD, as the RD primarily measures changes in thickness while the TBM mainly captures changes in local surface area.(1) The MTBM: surface multivariate tensor-based morphometry represented the logged deformation tensors (Wang et al. 2013), which was showed in prior studies (Wang et al. 2009; Wang et al. 2013a). Here this feature was used as supplement and reinforcement of TBM results.
The RDMTBM: RDMTBM is the combination of radial distance and MTBM, which takes advantage of the vertex-wise changes in thickness and regional surfaces. Here we only made a preliminary exploration of this feature. In future, our team will focus on the classification performance between MDD and HC groups and other applications based on this feature.
Statistics used for the univariate measures were t-tests (for RD/TBM), while the multivariate statistics were computed using the Hotelling’s T2 tests (Hotelling 1992) (for MTBM/RDMTBM). Hotelling’s T2 test is a commonly used multivariate test method, which can be understood as the extension of the t-test and in following papers can find detailed descriptions (Lepore et al. 2008; Wang et al. 2013a; Wang et al. 2013b).
Here we run two permutation tests on the images: a surface vertex-based one that allows us not to assume a normal distribution, and one over the whole structure to correct for multiple comparisons (Nichols and Holmes 2002; Styner et al. 2006).
Given two groups of hippocampus (or amygdala) surfaces, on each surface vertex, we compute a t value with true group labels to represent the difference between the two groups of subjects on this vertex. We then randomly assign the hippocampus (or amygdala) surfaces into two groups with same number of subjects in each group as in the true grouping and re-compute the t value on each surface vertex, which we denote as the t’ value. The random group assignment is permuted 10,000 times and results in 10,000 t’ values on each vertex. A probability on each surface vertex is computed as the ratio of the number of t’ values which are greater than the t value to the number of total permutations. These probability values (p-values) are color coded on an average hippocampus (or amygdala) shape to build the significance p-map (uncorrected, see Fig. 3 and Fig. 4) of the group comparison. Given a pre-defined statistical threshold of p = 0.05, the feature in a significance p-map is defined as number of surface vertices with p-values lower than this threshold, which is also regarded as the real effect in the true experiment. The feature is then compared with features that occur by accident in the random groupings. A ratio is computed describing the fraction of the time an effect of similar or greater magnitude to the real effect occurs in the random assignments. This ratio is the chance of the observed pattern occurring by accident and thus provides an overall significance value of the map (corrected for multiple comparisons) (Thompson et al. 2003; Shi et al. 2015).
Fig. 3.
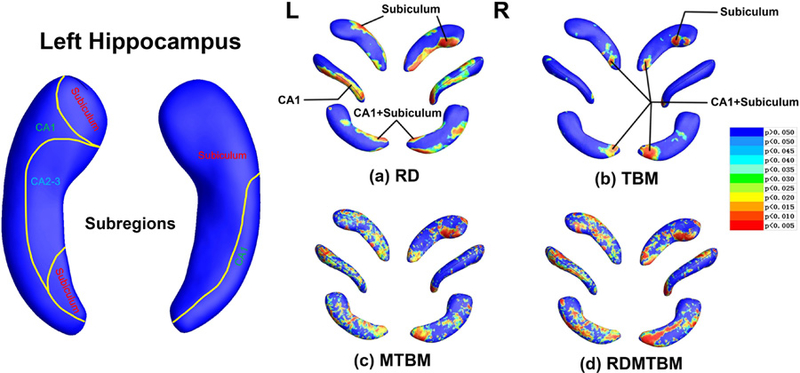
Hippocampus statistical p maps: overall p-values are p = 0.0253 and p = 0.0044 for left and right hippocampus RD (a), p = 0.0823 and p = 0.0283 for left and right hippocampus TBM (b), p = 0.0093 and p = 0.0147 for left and right hippocampus MTBM (c), p = 0.0080 and p = 0.0067 for left and right hippocampus RDMTBM (d). L, left; R, right.
Fig. 4.
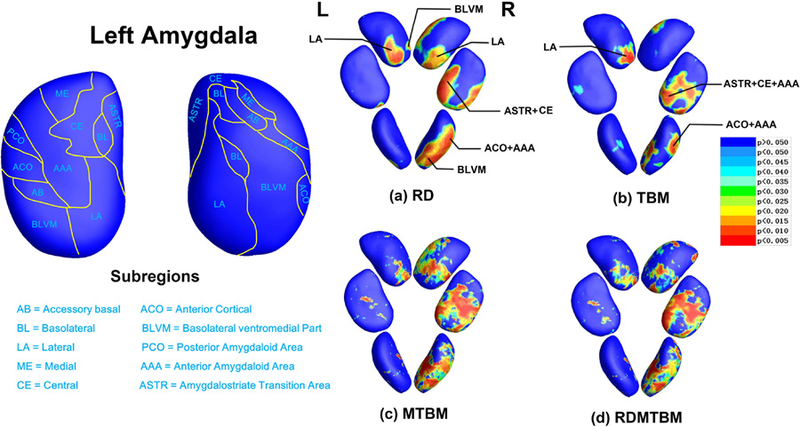
Amygdala statistical p maps: overall p-values are p = 0.1306 and p = 0.0086 for left and right amygdala RD (a), p = 0.1866 and p = 0.0467 for left and right amygdala TBM (b), p = 0.1552 and p = 0.0147 for left and right amygdala MTBM (c), p = 0.1241 and p = 0.0094 for left and right amygdala RDMTBM (d). L, left; R, right.
The calculation of atrophy and expansion areas
After detecting group differences, we performed some analyses to capture the direction of changes in regional group differences that found by radial distance and detJ — to locate which areas are atrophying and which are expanding. Suppose each RD value r at each vertex that we obtained is ri (i is the vertex id), the significance level given for each vertex is p-value = 0.05, and the NMDD and NNC represented the number of MDD and HC subjects, separately. Then each ri in each MDD and HC subject can be represented as riMDD and riHC. Finally, we can list the following expression:
| (2) |
Analogously, we can also generate the following expression for TBM:
| (3) |
As we mentioned earlier, the RD measures the thickness changes in the directions that perpendicular to the medial axis, while the detJ indicates the differences in regional surface areas. In both expressions (2) and (3), if the results of the subtractions are smaller than 0, that is, these vertices and parts they represented in MDD group are atrophying relative to HC group, and vice versa for results greater than 0.
The correlation analysis between each MDD subject’s surface features (RD/TBM) and their HAMD scores.
The HAMD score level, to some extent, can reflect the severity of depression (Bech et al. 1981; Williams 1988; Williams 2001). Hence, we ranked the HAMD scores for each subject in the MDD group, and calculated its correlations with each subject’s eigenvalues in every vertex that detected by RD and detJ. The correlation analysis may help to reveal the vulnerable subregions in hippocampus and amygdala, and can predict the trend of deformation during MDD duration. In order to describe the calculation methods of the correlation analysis, we drew the following matrix that represent the whole eigenvalues in MDD group:
| (4) |
where v refers to each eigenvalue in each vertex (here refers to RD or detJ), and m is the total number of vertices for each hippocampus or amygdala. Since each MDD subject has its own HAMD scores, we also list all of their HAMD scores as a matrix as follows:
| (5) |
The calculation method is that we continuously extract each row in matrix (4) to perform the Pearson correlation analysis with matrix (5), and according the coefficients (p-values and r-values) generated in the Pearson correlation analysis to draw these vulnerable parts on the surfaces of the two subcortical structures.
Results
Demographic and clinical characteristics
The demographic and clinical characteristics of the participants are summarized in Table 1. Significant group differences were only found in HAMD scores (p < 0.001), TSD (Time Since Diagnosis) (p < 0.001) and right amygdala volumes (p = 0.048). Each MDD subject’s volume distributions of hippocampus and amygdala along with HAMD scores were showed in Fig. 2
Table 1.
Demographic and clinical data of participants
| Variables | MDD (N = 25) |
MDD-Medicated (N = 19) |
HC (N = 28) |
MDD vs. HC | MDD-Medicated vs. HC | |||
|---|---|---|---|---|---|---|---|---|
| Mean | (SD) | Mean | (SD) | Mean | (SD) | P* | P* | |
| Ages(years) | 36.6 | 12.8 | 36.2 | 12.8 | 34.3 | 12.4 | NS | NS |
| Sex | 15 (60%) men | 12 (63.2%) men | 15 (53.6%) men | NS# | NS# | |||
| HAMD | 18.2 | 6.4 | 18.1 | 6.3 | 0.8 | 1.4 | <0.001 | <0.001 |
| TSD(years) | 6.4 | 6.0 | 7.2 | 6.5 | 0 | 0 | <0.001 | <0.001 |
| THV(mm3) | 8798.2 | 2710.5 | 8998.4 | 2704.3 | 9863.1 | 1743.8 | NS | NS |
| LHV(mm3) | 4303.5 | 1687.2 | 4280.8 | 1472.4 | 4701.4 | 991.6 | NS | NS |
| RHV(mm) | 4494.7 | 1351.2 | 4717.6 | 1337.3 | 5161.7 | 926.6 | NS | NS |
| TAV(mm) | 2453.3 | 1023.1 | 2702.4 | 1006.9 | 2916.1 | 702.8 | NS | NS |
| LAV(mm) | 1247.7 | 540.7 | 1388.5 | 530.9 | 1405.3 | 349.9 | NS | NS |
| RAV(mm) | 1205.6 | 583.9 | 1313.9 | 589.1 | 1510.7 | 511.3 | 0.048 | NS |
SD Standard Deviation, NS Not Significant, TSD Time Since Diagnosis, THV Total Hippocampus Volume, LHV Left Hippocampus Volume, RHV Right Hippocampus Volume, TAV Total Amygdala Volume, LAV Left Amygdala Volume, RAV Right Amygdala Volume
Student’s t-test for independent samples
χ2 test
Fig. 2.
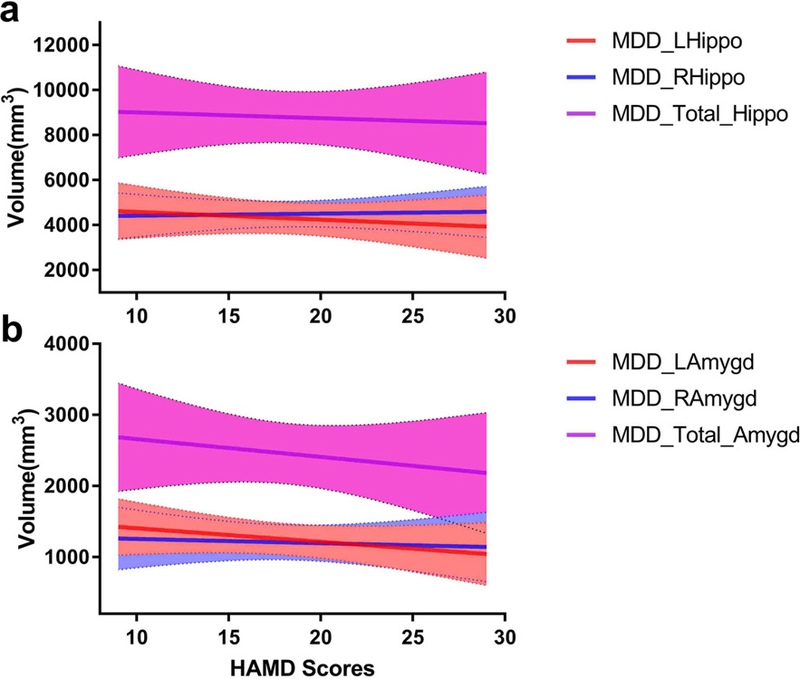
a Left, right and total hippocampal volume distributions along with HAMD scores in the MDD group. b Volume distributions of left, right and total amygdala along with HAMD scores in MDD group.
Regional group morphometric differences
Subregions and areas of significant abnormality in the hippocampus and amygdala of MDD group comparing with HC group were showed in Fig. 3 and Fig. 4. The template surfaces for the hippocampus and amygdala (shown in the left parts of Fig. 3 and Fig. 4) were subdivided into multiple distinct subregions according to the guidance of two independent anatomists and some prior studies (Maller et al. 2007; Ballmaier et al. 2008; Cavedo et al. 2011).
With the pathological effects of MDD, the two hippocampus displayed similarity in morphological changes. In terms of RD, the left hippocampus (global p = 0.0253) and right hippocampus (global p = 0.0044) displays strongly significant clusters that located from the most posterior tail sections (in CA1 and subiculum subregions) to anterior head parts (in subiculum subregion). As for TBM, the two sides of hippocampus (left: global p = 0.0823; right: global p = 0.0283) show consistent clusters of significance in the tail sections (in CA1 and subiculum subregions), while the right hippocampus displays extra areas of significance on anterior head parts (in subiculum subregion). In conclusion, CA1 and subiculum are two vulnerable subregions in bilateral hippocampus.
Different with hippocampus, the two amygdala show some asymmetry. For left amygdala, no matter in the RD (global p = 0.1306) or TBM (global p = 0.1866), its areas of significance are mainly included in LA and BLVM subregions. For right amygdala, considering both RD (global p = 0.0086) and TBM (global p = 0.0467), the significant areas were extensively presented in LA, BLVM, CE, ASTR, ACO and AAA subregions.
Multivariate tests (MTBM/RDMTBM) of hippocampus and amygdala also gave most overlapped clusters of significance that had found in TBM and RD, though their results were more sensitive but a bit noisier. Most of the global p-values (except left amygdala) calculated by the four features reached the threshold of 0.05 — which we set here for the statistical significance of each subcortical structure. Obviously, all these features we used here were more sensitive than just considering the overall volumes (Table 1).
Atrophy and expansion areas illustrated
The significant atrophy and expansion regions were captured by combining the group morphometric difference results and the expression (2) and (3). Widespread atrophies (cold colors) and small expansions (warm colors) were marked in “Atrophy” and “Expansion” in Fig. 5. The significant atrophy parts in bilateral hippocampus (Fig. 5) are widely located on anterior head (in subiculum subregion) and posterior tail (in CA1 subregion). The two smaller significant expansion areas (Fig. 5) in left hippocampus are also located on the CA1 subregion. Bilateral amygdalae also showed widespread significant atrophy in LA, BLVM, CE, ASTR, ACO and AAA subregions (Fig. 5). In the TBM of right amygdala, a small significant expansion area were found in CE subregion (Fig. 5 b).
Fig. 5.
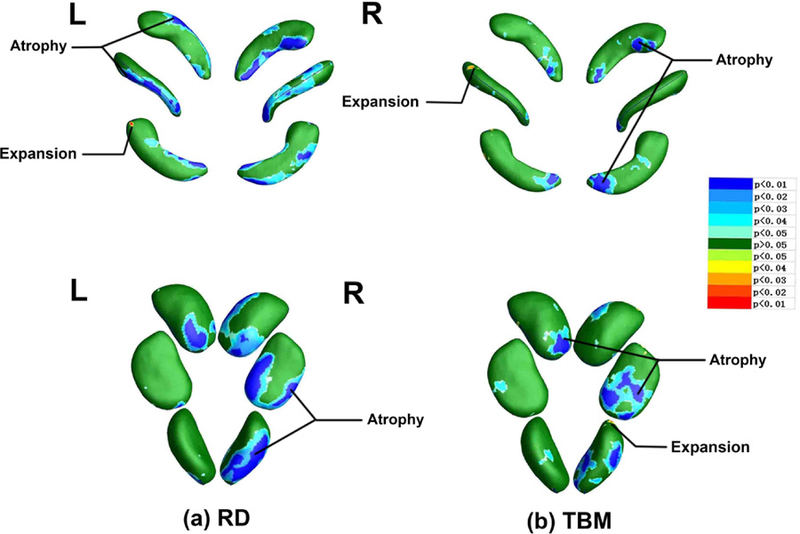
a Atrophy and expansion areas of hippocampus and amygdala in radial distance. b Atrophy and expansion areas of hippocampus and amygdala in detJ. The cold colors represent atrophy areas, while warm colors represent expansion areas.
Correlation areas between surface feature values of MDD subjects and their HAMD scores
According to the expression (4) and (5), Fig. 6 was generated. This figure display r-values distributions that meet p-values less than 0.05 (the threshold we set for each vertex) when performing Pearson correlation analysis between each subject’s RD/TBM eigenvalues and their HAMD scores. The correlation results supported these atrophy areas we found before (Fig. 5), although these strong negative correlation areas (r < −0.80, see Fig. 6 a) found here were a little shifted relative to these strong significant atrophy areas (p < 0.01, see Fig. 5 a). It is suggested that atrophic subregions of hippocampus have potential but slight tendencies of expanding into CA2–3 subregions, while similar trends in amygdala were seen in medial (ME), accessory basal (AB) and posterior cortical (PCO) subregions. These results revealed new insights to MDD group itself — as the HAMD score increases, these severely atrophy areas in hippocampus and amygdala have a tendency to gradually extend into more subregions (Ballmaier et al. 2008).
Fig. 6.
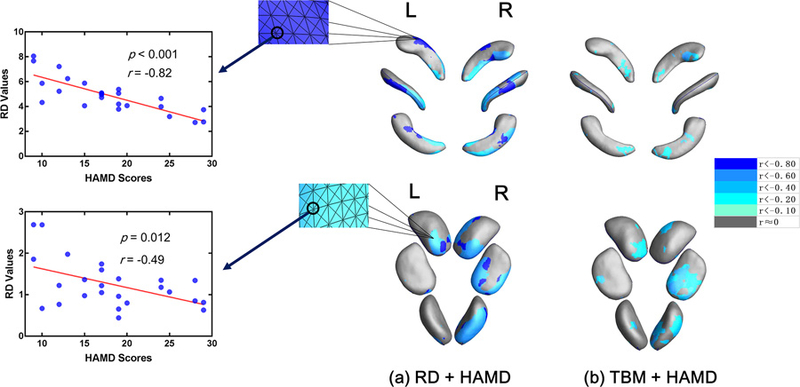
a Correlation areas of hippocampus and amygdala in radial distance. b Correlation areas of hippocampus and amygdala in detJ. Negative correlation enhanced when colors changing from grey to blue.
Morphological resilience of MDD subjects after receiving medical treatments
In this part, we analyzed group morphometric differences and drew atrophy and expansion areas between the MDD-Medicated group and HC group, obtained some preliminary evidence about morphological resilience, when comparing with results of group morphometric differences between MDD and HC groups hereinbefore. To simplify, group difference maps between MDD and HC groups are represented as “MDD” (see Fig. 7), while group difference maps between MDD-Medicated and HC groups are represented as “MDD-Medicated” (also see Fig. 7).
Fig. 7.
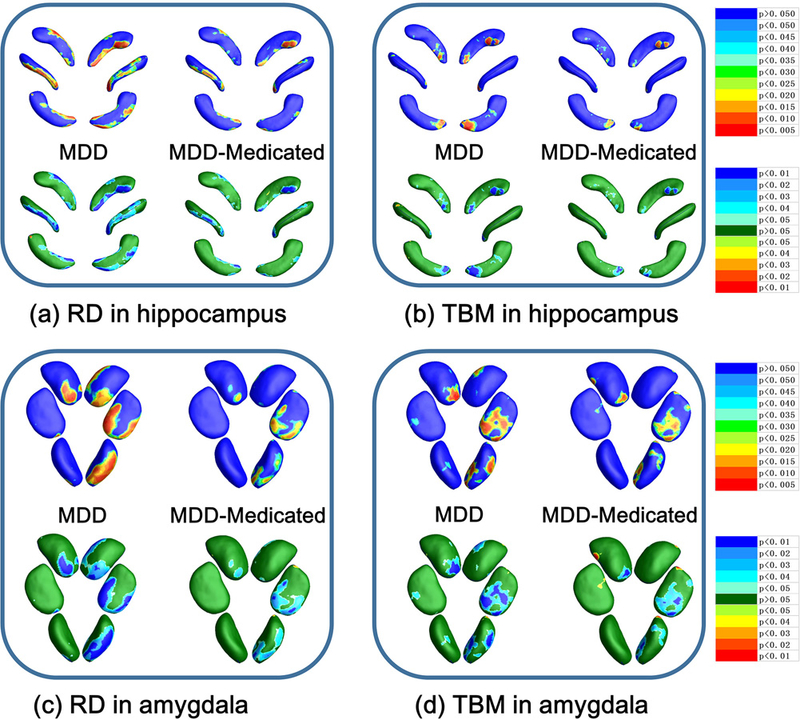
a RD results of MDD group vs. MDD-Medicated group in hippocampus. b TBM results of MDD group vs. MDD-Medicated group in hippocampus. c RD results of MDD group vs. MDD-Medicated group in amygdala. d TBM results of MDD group vs. MDD-Medicated group in amygdala. Hippocampus statistical p maps in MDD-Medicated group: overall p-values are p = 0.0533 and p = 0.0616 for left and right hippocampus RD (a), p = 0.1787 and p = 0.1751 for left and right hippocampus TBM (b). Amygdala statistical p maps in MDD-Medicated group: overall p-values are p = 0.6572 and p = 0.0535 for left and right amygdala RD (c), p = 0.3033 and p = 0.0384 for left and right amygdala TBM (d).
There are two aspects that can provide evidence for the morphological resilience of MDD-Medicated group. Firstly, relative to MDD group, MDD-Medicated group has smaller areas of significant group morphometric differences in hippocampus and amygdala when comparing with HC group (see top line of Fig. 7 a~d). Secondly, MDD-Medicated group has smaller atrophy areas and weaker atrophic effects (see the bottom line of Fig. 7 a~d) in hippocampus and amygdala. These results suggest that hippocampus and amygdala of MDD-Medicated group are closer to HC group in morphometry, which can be understood as morphological resilience after medicated.
Discussion
There are four main discoveries in this paper. Firstly, instead of significant overall volume difference between groups, morphological alterations were more obvious in specific subregions of hippocampus and amygdala in MDD patients (Fig. 3 and Fig. 4). These morphological abnormalities at the level of subdivisions of the hippocampus (reached global significance (p<0.05) on both sides) and amygdala (reached global significance (p<0.05) on right side) to some extent reminded researchers the pathological changes in subcortical structures may be unreliable or unstable if they were speculated only from the overall volume change directions.
Secondly, although most of the areas of significant group differences were atrophy areas, we found the atrophy and expansion effects in subregions of hippocampus and amygdala exist simultaneously (Fig. 5). Different subregions of hippocampus and amygdala have different degrees of morphometric vulnerability to MDD.
Thirdly, we applied the correlation analysis between surface eigenvalues and HAMD scores, and displayed some potential but slightly morphological development trends along with HAMD scores in hippocampus and amygdala (Fig. 6).
Fourthly, we provided subregional morphometric evidence that medicated MDD patients have stronger morphometric resilience than unmedicated MDD patients (Fig. 7). Our morphometric results of MDD-Medicated group, more subtly, supported prior volume studies about recovery effects brought about by medical treatments (C. Lange and E. Irle 2004; Hamilton et al. 2008; Van et al. 2009; Malykhin et al. 2010).
Prior research and our works
Most of prior research, as we described in earlier, were mainly focusing on using volumetry methods to describe the global volume changes of hippocampus and amygdala. To be specific, Sheline et al. (1996) investigated a sample of ten women with a history of recurrent MDD and found smaller hippocampal volumes than a group of pair-wise matched normal controls. Mervaala et al. (2000) revealed significant hippocampal asymmetry (left smaller than right) in both MDD and control groups, and the present study also showed similar patterns. Using medicated subjects with similar ages to these in our study, C. Lange and E. Irle (2004) found smaller hippocampal volumes in MDD group and revealed the amygdala volume had a tendency to increase first and then continually decrease with prolonged disorder duration. Our MDD-Medicated group, in two aspects, also revealed similar mechanisms: (1) the morphometric atrophy effects in hippocampus of MDD-Medicated group are weaker than that of MDD group but still locally significant; (2) MDD-Medicated group showed weaker atrophy effects and stronger expansion effects in amygdala (Fig. 7 c~d) than MDD group.
To our knowledge, regional structural changes of hippocampus have been documented in a small amount of literatures. Based on manual segmentation, Neumeister et al. (2005) reported decreased hippocampal volume in its whole and more pronounced in the posterior region. Maller et al. (2007) divided hippocampus into head, body, and tail sections, and found local volume reductions in the most posterior region of the tail of the hippocampus in treatment-resistant depressive patients. According to the same subregion (head, body, tail) segmentation method, Malykhin et al. (2010) found significant volume reduction in the hippocampal tail bilaterally, right hippocampal head and right total hippocampus in MDD patients. Their another pivotal finding is that medicated MDD patients showed increased hippocampal body volume compared with both healthy controls and unmedicated patients. Cole et al. (2010) noted the main hippocampal body was relatively intact while deformations were evident particularly in the tail region within the subiculum and CA1 subfield but as well in the CA2–3 subfields. Together, the above two studies further enhanced the persuasiveness that different subregions of hippocampus have different degrees of vulnerability to neuronal damage associated with MDD, as well as the resilience to medication. The findings of smaller expansion areas in the CA1 subregion of left hippocampus in our MDD group also supported their conclusions. More precisely, Posener et al. (2003) indicated specific abnormalities in the subiculum of hippocampus in MDD patients, and Ballmaier et al. (2008) reported extensive morphological abnormalities in the subiculum and CA1 subregions which extended into the CA2–3 subfields in the late-life MDD patients. Our correlation analysis results in hippocampus showed similiar morphological development trends from atrophic subregions (CA1 and subiculum) into CA2–3 subregions.
Only two prior research revealed the morphological changes in the MDD amygdala. Sheline et al. (1998) confirmed that amygdala core nuclei volumes rather than mean total amygdala volumes were decreased in recurrent MDD. Then, the BLVM, CE and ME subregions of MDD amygdala were revealed pronounced in morphometric changes (Joshi et al. 2016). For all we know, our study for the first time mapped the morphological changes in the subregions of MDD amygdala. Our results showed not only morphological differences between different subregions of the same amygdala, but great asymmetry of morphological changes between the left and right amygdala when subjects encountering MDD. As pointed out in a very large sample size MDD research (Schmaal et al. 2016), the total volumes of amygdala in MDD patients have a tendency to decrease with the severity of MDD. Here we only found significant group volumetric differences in right amygdala (table 1). Obviously, when atrophy effects are highly localized, our novel features are likely to detect regional changes in amygdala that volumetric measures may miss.
Vulnerable subregions found in this study and their functions
In primates, the posterior portion of the hippocampus was thought to be more important than anterior areas for encoding of spatial memory and certain forms of nonspatial memory (Moser and Moser 2015), and it was proved mainly involved in memory retrieval in human (Lepage et al. 2015). A study assessed hippocampal function using a virtual-reality spatial memory navigation task and found that depressed patients performed significantly worse than healthy subjects on the spatial memory navigation task (Gould et al. 2007). Therefore, the atrophy areas found in CA1 subregion in this study provided the structural explanation of impaired spatial memory. The subiculum has been specifically implicated in the retrieval of episodic recollections (Zeineh et al. 2003; Eldridge et al. 2005; Viskontas et al. 2009), and the atrophy of subiculum was showed as the earliest hippocampal anatomical marker of AD (Carlesimo et al. 2015). Memory impairments are associated with hippocampal atrophy in MDD (Golomb et al. 1993; Hickie et al. 2005). In these patterns of memory impairments, deficits in episodic memory are the most commonly reported feature for hippocampus (Tulving and Markowitsch 1998; Smith and Mizumori 2006; Mormino et al. 2009). These deficits usually become more prominent when depression transforms from first episode to recurrent (Fossati et al. 2004). Airaksinen et al. (2007) suggested that low episodic memory performance predated depressive diagnosis and might be considered as a premorbid marker of MDD. Autobiographical memory is usually described as a kind of episodic memory, and a main component of it is the recall of specific event in one’s life (Brewer 1986). Many prior research have documented that individuals with MDD have difficulty in recalling specific autobiographical events (Williams and Broadbent 1986; Williams and Scott 1988), especially recalling those positive than negative memories (Lemogne et al. 2006). Together, these atrophy areas found in CA1 and subiculum subregions of hippocampus (Fig. 5) in the present study provided morphological evidence to the underlying causes of impaired spatial memory and episodic memory in MDD patients. Combining with our correlation analysis results (Fig. 6), these extending trends of atrophy areas in MDD group from subiculum and CA1 subregions to others (CA2 and CA3) may predict the latter damages to other hippocampus-dependent subregional functions, such as sociocognitive memory processing (Hitti and Siegelbaum 2014), resistance to cell death (Dudek et al. 2016), fear memory retrieval (Sun et al. 2017) and object mnemonic discrimination (Reagh et al. 2018).
In amygdala, the LA subregion is a crucial site of neural changes that occur during fear conditioning (Ledoux et al. 1990; Rodrigues et al. 2004). The BL subregion mainly involved in unconscious processing modulated activity (Etkin et al. 2004), while the VM subregion might be pivotal for controlling the predatory behavior (Fonberg 1981). The ACO subregion mainly involves in generating innate odour-driven behaviors (Root et al. 2014) and the AAA subregion initiates defensive and aggressive responses elicited by olfactory (Cádiz-Moretti et al. 2017). Besides, the ASTR subregion is engaged in distinct forebrain circuits (Shammah-Lagnado et al. 1999), while the CE subregion is required for fear acquisition, whereas conditioned fear responses are driven by output neurons in the ME subregion (Ciocchi et al. 2010). Previous research revealed that even higher familial risk in MDD seems to be associated with smaller amygdala volumes (K et al. 2012). Observed by Dannlowski et al. (2007), the hyperactivity in right amygdala could be a determinant for a more severe depression course. Combining the above two studies and our asymmetrical results in amygdala morphometry (Fig. 4 and Fig. 5), it is suggested the functional hyperactivity in the right amygdala may be a potential compensation mechanism for its volume decrease. A prior research observed the significant activity in right amygdala in the negative-word/self-reference condition and in left amygdala in positive-word/self-reference condition (Yoshimura et al. 2009). Abercrombie et al. (1998) revealed that metabolic rate in the right amygdala was positively correlated with negative affect of MDD patients. As a result, the biased morphological changes found in MDD amygdala in this study structurally revealed the typical emotional feature of MDD patients — positive emotion diminishes while negative emotion elevates (Silk et al. 2003; Liverant et al. 2008; Heller et al. 2009). Additionally, Phelps et al. (2001) and Zald (2003) have suggested that the right amygdala responds to unanticipated or unconscious processing of emotional stimuli. The hyperactivity of unconscious rapid path to the right amygdala in MDD patients sometimes may lead to perception of threats when none exist (Ahmari 2015). Correlation analysis results (Fig. 6) showed that the strong atrophy subregions of amygdala have slightly tendencies of expanding into ME, AB and PCO subregions, these may indicate further pathological alterations induced by MDD.
Limitations
There are several limitations in this study. First, the group size may be further improved, larger sample size may provide stronger statistical effects. Second, our study is cross-sectional. Longitudinal and follow-up subjects are needed in further study to determine the possible causative mechanisms in subregions, such as apoptosis and decreased neurogenesis (Lucassen et al. 2006), which may be driven by hypercortisolemia or diminished neurotrophin levels (Czéh and Lucassen 2007). Third, we did not collect genetic data and ignored these environmental factors that caused MDD. A prior research identified some gene-based associations to the presence of depressive symptoms in older adults (Nho et al. 2015). Some other studies (Caspi et al. 2003; Lesch 2004; Uher 2008; Schnittker 2010) found the gene-environment interactions play a crucial role in understanding why stressful experiences lead to MDD in some people but not in others. For example, the serotonin transporter (5-HTT) gene was found to moderate the influence of stressful life events on MDD (Caspi et al. 2003).
Conclusion
Although some limitations exist, we found the subiculum and CA1 subregions of bilateral hippocampus, the LA and BLVM subregions of left amygdala and the LA, BLVM, CE, ASTR, ACO and AAA subregions of right amygdala were more vulnerable than other subregions in MDD patients. Our correlation analysis results supported the vulnerability of these atrophy subregions and revealed some potential morphological development trends in MDD hippocampus and amygdala. Comparing results between MDD-Medicated group and MDD group, we provided some preliminary evidence that medicated MDD patients have stronger morphological resilience in hippocampus and amygdala. Our research can serve as a cohesive force which gradually convert volumetric research of MDD subcortical structures into subregional studies.
Funding:
This study was supported by the National Basic Research Program of China (973 Program) (No.2014CB744600), the National Natural Science Foundation of China (Grant No.61210010, No.61632014 and No.61571047), the Program of International S&T Cooperation of MOST (No.2013DFA11140), the Program of Beijing Municipal Science & Technology Commission (No.Z171100000117005), the National Key Research and Development Program of China (No.2016YFC1307203) and the Fundamental Research Funds for the Central Universities (lzujbky-2017-kb08).
Footnotes
Compliance with Ethical Standards
Conflict of Interest: All authors declared no conflict of interest.
Ethical approval: All procedures performed in studies involving human participants were in accordance with the ethical standards of the institutional and national research committee and with the 1964 Helsinki declaration and its later amendments or comparable ethical standards. This article does not contain any studies with animals performed by any of the authors.
Informed consent: Informed written consents were obtained from all individual participants included in the study.
References
- Abercrombie HC et al. (1998) Metabolic rate in the right amygdala predicts negative affect in depressed patients Neuroreport 9:3301. [DOI] [PubMed] [Google Scholar]
- Adolphs R, Tranel D, Damasio H (1994) Impaired recognition of emotion in facial expressions following bilateral damage to the human amygdala Nature 372:669–672 [DOI] [PubMed] [Google Scholar]
- Ahmari S (2015) Neuroscience: Inside the fear factor Nature 524:34–34 [Google Scholar]
- Airaksinen E, Wahlin Å, Forsell Y, Larsson M (2007) Low episodic memory performance as a premorbid marker of depression: Evidence from a 3-year follow-up European Psychiatry 115:S221–S221 [DOI] [PubMed] [Google Scholar]
- Angelucci F, Brenè S, Mathé AA (2005) BDNF in schizophrenia, depression and corresponding animal models Molecular Psychiatry 10:345. [DOI] [PubMed] [Google Scholar]
- Ballmaier M et al. (2008) Hippocampal morphology and distinguishing late-onset from early-onset elderly depression American Journal of Psychiatry 165:229–237 [DOI] [PMC free article] [PubMed] [Google Scholar]
- Bannerman DM, Sprengel R, Sanderson DJ, Mchugh SB, Rawlins JNP, Monyer H, Seeburg PH (2014) Hippocampal synaptic plasticity, spatial memory and anxiety Nature Reviews Neuroscience 15:181–192 [DOI] [PubMed] [Google Scholar]
- Bech P, Allerup P, Gram LF, Reisby N, Rosenberg R, Jacobsen O, Nagy A (1981) The Hamilton Depression Scale Acta Psychiatrica Scandinavica 63:290–299 [DOI] [PubMed] [Google Scholar]
- Brewer WF (1986) Autobiographical Memory International Encyclopedia of the Social & Behavioral Sciences 3:282–288 [Google Scholar]
- Bus BAA, Molendijk ML, Tendolkar I, Penninx BWJH, Prickaerts J, Elzinga BM, Voshaar RCO (2015) Chronic depression is associated with a pronounced decrease in serum brain-derived neurotrophic factor over time Molecular Psychiatry 20:602. [DOI] [PubMed] [Google Scholar]
- Lange C, Irle E (2004) Enlarged amygdala volume and reduced hippocampal volume in young women with major depression Psychological Medicine 34:1059–1064 [DOI] [PubMed] [Google Scholar]
- Cádiz-Moretti B, Abellán-Álvaro M, Pardo-Bellver C, Martínez-García F, Lanuza E (2017) Afferent and efferent projections of the anterior cortical amygdaloid nucleus in the mouse Journal of Comparative Neurology 525 [DOI] [PubMed] [Google Scholar]
- Carlesimo GA, Piras F, Orfei MD, Iorio M, Caltagirone C, Spalletta G (2015) Atrophy of presubiculum and subiculum is the earliest hippocampal anatomical marker of Alzheimer’s disease Alzheimers & Dementia 1:24. [DOI] [PMC free article] [PubMed] [Google Scholar]
- Caspi A et al. (2003) Influence of life stress on depression: moderation by a polymorphism in the 5-HTT gene Science 301:386–389 [DOI] [PubMed] [Google Scholar]
- Cavedo E et al. (2011) Local amygdala structural differences with 3T MRI in patients with Alzheimer disease Neurology 76:727. [DOI] [PMC free article] [PubMed] [Google Scholar]
- Chen MC, Hamilton JP, Gotlib IH (2010) Decreased hippocampal volume in healthy girls at risk of depression Archives of General Psychiatry 67:270. [DOI] [PMC free article] [PubMed] [Google Scholar]
- Christensen GE, Rabbitt RD, Miller MI (2002) Deformable templates using large deformation kinematics IEEE Transactions on Image Processing A Publication of the IEEE Signal Processing Society 5:1435–1447 [DOI] [PubMed] [Google Scholar]
- Chung MK, Dalton KM, Davidson RJ (2008) Tensor-based cortical surface morphometry via weighted spherical harmonic representation IEEE Transactions on Medical Imaging 27:1143–1151 [DOI] [PubMed] [Google Scholar]
- Ciocchi S et al. (2010) Encoding of conditioned fear in central amygdala inhibitory circuits Nature 468:277. [DOI] [PubMed] [Google Scholar]
- Cole J et al. (2010) Subregional hippocampal deformations in major depressive disorder J Affect Disord 126:272–277 [DOI] [PMC free article] [PubMed] [Google Scholar]
- Collins DL, Neelin P, Peters TM, Evans AC (1994) Automatic 3D intersubject registration of MR volumetric data in standardized Talairach space Journal of Computer Assisted Tomography 18:192. [PubMed] [Google Scholar]
- Czéh B, Lucassen PJ (2007) What causes the hippocampal volume decrease in depression? Are neurogenesis, glial changes and apoptosis implicated? European Archives of Psychiatry & Clinical Neuroscience 257:250–260 [DOI] [PubMed] [Google Scholar]
- Dannlowski U et al. (2007) Amygdala reactivity to masked negative faces is associated with automatic judgmental bias in major depression: a 3 T fMRI study Journal of Psychiatry & Neuroscience Jpn 32:423. [PMC free article] [PubMed] [Google Scholar]
- Davatzikos C (1996) Spatial Normalization of 3D Brain Images Using Deformable Models Journal of Computer Assisted Tomography 20:656–665 [DOI] [PubMed] [Google Scholar]
- Dimsdalezucker HR, Ritchey M, Ekstrom AD, Yonelinas AP, Ranganath C (2018) CA1 and CA3 differentially support spontaneous retrieval of episodic contexts within human hippocampal subfields Nature Communications 9:294. [DOI] [PMC free article] [PubMed] [Google Scholar]
- Dudek SM, Alexander GM, Farris S (2016) Rediscovering area CA2: unique properties and functions Nature Reviews Neuroscience 17:89. [DOI] [PMC free article] [PubMed] [Google Scholar]
- Eldridge LL, Engel SA, Zeineh MM, Bookheimer SY, Knowlton BJ (2005) A dissociation of encoding and retrieval processes in the human hippocampus Journal of Neuroscience the Official Journal of the Society for Neuroscience 25:3280–3286 [DOI] [PMC free article] [PubMed] [Google Scholar]
- Etkin A, Klemenhagen KC, Dudman JT, Rogan MT, Hen R, Kandel ER, Hirsch J (2004) Individual differences in trait anxiety predict the response of the basolateral amygdala to unconsciously processed fearful faces Neuron 44:1043–1055 [DOI] [PubMed] [Google Scholar]
- First M, Spitzer R, Gibbon M, Williams J (2002) Structured Clinical Interview for DSM-IV Axis I disorders [DOI] [PubMed]
- Fonberg E (1981) MANIPULATION OF VARIOUS ASPECTS ON THE EMOTIONAL BEHAVIOR BY AMYGDALAR LESIONS AND IMIPRAMINE TREATMENT Brain & Behaviour:487–494
- Fossati P, Harvey PO, Bastard GL, Ergis AM, Jouvent R, Allilaire JF (2004) Verbal memory performance of patients with a first depressive episode and patients with unipolar and bipolar recurrent depression Journal of Psychiatric Research 38:137–144 [DOI] [PubMed] [Google Scholar]
- Frodl T et al. (2002) Enlargement of the amygdala in patients with a first episode of major depression Biological Psychiatry 51:708. [DOI] [PubMed] [Google Scholar]
- Frodl T et al. (2003) Larger amygdala volumes in first depressive episode as compared to recurrent major depression and healthy control subjects Biological Psychiatry 53:338. [DOI] [PubMed] [Google Scholar]
- Golomb J, Leon MJD, Kluger A, George AE, Tarshish C, Ferris SH (1993) Hippocampal Atrophy in Normal Aging: An Association With Recent Memory Impairment Archives of Neurology 50:967–973 [DOI] [PubMed] [Google Scholar]
- Gould NF et al. (2007) Performance on a virtual reality spatial memory navigation task in depressed patients Am J Psychiatry 164:516–519 [DOI] [PubMed] [Google Scholar]
- Greenberg PE, Birnbaum HG (2005) The economic burden of depression in the US: societal and patient perspectives Expert Opin Pharmacother 6:369. [DOI] [PubMed] [Google Scholar]
- Gunten Av, Fox NC, Cipolotti L, Ron MA (2000) A Volumetric Study of Hippocampus and Amygdala in Depressed Patients With Subjective Memory Problems Journal of Neuropsychiatry & Clinical Neurosciences 12:493. [DOI] [PubMed] [Google Scholar]
- Hamilton JP, Siemer M, Gotlib IH (2008) Amygdala volume in Major Depressive Disorder: A meta-analysis of magnetic resonance imaging studies Molecular Psychiatry 13:993. [DOI] [PMC free article] [PubMed] [Google Scholar]
- Hasin DS, Goodwin RD, Stinson FS, Grant BF (2005) Epidemiology of major depressive disorder: results from the National Epidemiologic Survey on Alcoholism and Related Conditions Arch Gen Psychiatry 62:1097–1106 doi: 10.1001/archpsyc.62.10.1097 [DOI] [PubMed] [Google Scholar]
- Hastings RS, Parsey RV, Oquendo MA, Arango V, Mann JJ (2004) Volumetric analysis of the prefrontal cortex, amygdala, and hippocampus in major depression Neuropsychopharmacology Official Publication of the American College of Neuropsychopharmacology 29:952. [DOI] [PubMed] [Google Scholar]
- Heller AS et al. (2009) Reduced Capacity to Sustain Positive Emotion in Major Depression Reflects Diminished Maintenance of Fronto-Striatal Brain Activation Proceedings of the National Academy of Sciences of the United States of America 106:22445–22450 [DOI] [PMC free article] [PubMed] [Google Scholar]
- Hickie I et al. (2005) Reduced hippocampal volumes and memory loss in patients with early- and late-onset depression British Journal of Psychiatry 186:197–202 [DOI] [PubMed] [Google Scholar]
- Hitti FL, Siegelbaum SA (2014) The hippocampal CA2 region is essential for social memory Nature 508:88–92 [DOI] [PMC free article] [PubMed] [Google Scholar]
- Hotelling H (1992) The Generalization of Student’s Ratio Springer; New York, [Google Scholar]
- Ferrari AJ, Somerville AJ, Baxter AJ, Norman R, Patten SB, Vos T, Whiteford HA (2013) Global variation in the prevalence and incidence of major depressive disorder: a systematic review of the epidemiological literature Psychological Medicine 43:471–481 [DOI] [PubMed] [Google Scholar]
- Joshi SH et al. (2016) Structural Plasticity of the Hippocampus and Amygdala Induced by Electroconvulsive Therapy in Major Depression Biological Psychiatry 79:282–292 [DOI] [PMC free article] [PubMed] [Google Scholar]
- K S, A C, D L, AJ F, G C, G B, T F (2012) Impact of family history and depression on amygdala volume Psychiatry Research: Neuroimaging 203:24–30 [DOI] [PubMed] [Google Scholar]
- Kessler RC et al. (2003) The epidemiology of major depressive disorder: results from the National Comorbidity Survey Replication (NCS-R) Jama 289:3095. [DOI] [PubMed] [Google Scholar]
- Kessler RC, Berglund P, Demler O, Jin R, Merikangas KR, Walters EE (2005) Lifetime prevalence and age-of-onset distributions of DSM-IV disorders in the National Comorbidity Survey Replication Bmc Complementary & Alternative Medicine 14:422–422 [DOI] [PubMed] [Google Scholar]
- Krishnan V, Nestler EJ (2008) The molecular neurobiology of depression Nature 455:894–902 [DOI] [PMC free article] [PubMed] [Google Scholar]
- Kronenberg G, Tebartz vEL, Regen F, Deuschle M, Heuser I, Colla M (2009) Reduced amygdala volume in newly admitted psychiatric in-patients with unipolar major depression Journal of Psychiatric Research 43:1112–1117 [DOI] [PubMed] [Google Scholar]
- Lao Y, Wang Y, Shi J, Ceschin R, Nelson MD, Panigrahy A, Leporé N (2016) Thalamic alterations in preterm neonates and their relation to ventral striatum disturbances revealed by a combined shape and pose analysis Brain Structure & Function 221:487–506 [DOI] [PMC free article] [PubMed] [Google Scholar]
- Ledoux JE, Cicchetti P, Xagoraris A, Romanski LM (1990) The lateral amygdaloid nucleus: sensory interface of the amygdala in fear conditioning Journal of Neuroscience the Official Journal of the Society for Neuroscience 10:1062–1069 [DOI] [PMC free article] [PubMed] [Google Scholar]
- Lemogne C et al. (2006) Episodic autobiographical memory in depression: Specificity, autonoetic consciousness, and self-perspective Consciousness & Cognition 15:258–268 [DOI] [PubMed] [Google Scholar]
- Lepage M, Habib R, Tulving E (2015) Hippocampal PET activations of memory encoding and retrieval: the HIPER model Hippocampus 8:313–322 [DOI] [PubMed] [Google Scholar]
- Lepore N et al. (2008) Generalized Tensor-Based Morphometry of HIV/AIDS Using Multivariate Statistics on Deformation Tensors IEEE Transactions on Medical Imaging 27:129. [DOI] [PMC free article] [PubMed] [Google Scholar]
- Lesch KP (2004) Gene–environment interaction and the genetics of depression Journal of Psychiatry & Neuroscience Jpn 29:174–184 [PMC free article] [PubMed] [Google Scholar]
- Linden DJ, Connor JA (2003) Long-term synaptic depression Annual Review of Neuroscience 18:319–357 [DOI] [PubMed] [Google Scholar]
- Liverant GI, Brown TA, Barlow DH, Roemer L (2008) Emotion regulation in unipolar depression: the effects of acceptance and suppression of subjective emotional experience on the intensity and duration of sadness and negative affect Behaviour Research & Therapy 46:1201–1209 [DOI] [PubMed] [Google Scholar]
- Lucassen PJ et al. (2006) Stress, depression and hippocampal apoptosis CNS & Neurological Disorders - Drug Targets (Formerly Current Drug Targets 5:- [DOI] [PubMed]
- Maller JJ, Daskalakis ZJ, Fitzgerald PB (2007) Hippocampal volumetrics in depression: the importance of the posterior tail Hippocampus 17:1023–1027 [DOI] [PubMed] [Google Scholar]
- Malykhin NV, Carter R, Seres P, Coupland NJ (2010) Structural changes in the hippocampus in major depressive disorder: contributions of disease and treatment Journal of Psychiatry & Neuroscience Jpn 35:337. [DOI] [PMC free article] [PubMed] [Google Scholar]
- Marcus DBM, Yasamy MT, Ommeren MV, Saxena S, Dan C (2012) A Global Public Health Concern
- Mervaala E et al. (2000) Quantitative MRI of the hippocampus and amygdala in severe depression Psychological Medicine 30:117–125 [DOI] [PubMed] [Google Scholar]
- Mormino EC et al. (2009) Episodic memory loss is related to hippocampal-mediated β-amyloid deposition in elderly subjects Brain 132:1310–1323 [DOI] [PMC free article] [PubMed] [Google Scholar]
- Morris JS, Öhman A, Dolan RJ (1998) Conscious and unconscious emotional learning in the human amygdala Nature 393:467–470 [DOI] [PubMed] [Google Scholar]
- Moser MB, Moser EI (2015) Functional differentiation in the hippocampus Hippocampus 8:608–619 [DOI] [PubMed] [Google Scholar]
- Neumeister A et al. (2005) Reduced hippocampal volume in unmedicated, remitted patients with major depression versus control subjects Biol Psychiatry 57:935–937 [DOI] [PubMed] [Google Scholar]
- Nho K et al. (2015) Comprehensive Gene- and Pathway-Based Analysis of Depressive Symptoms in Older Adults Journal of Alzheimers Disease Jad 45:1197–1206 [DOI] [PMC free article] [PubMed] [Google Scholar]
- Nichols TE, Holmes AP (2002) Nonparametric permutation tests for functional neuroimaging: a primer with examples Human Brain Mapping 15:1–25 [DOI] [PMC free article] [PubMed] [Google Scholar]
- Phelps EA, O’Connor KJ, Gatenby JC, Gore JC, Grillon C, Davis M (2001) Activation of the left amygdala to a cognitive representation of fear Nature Neuroscience 4:437–441 [DOI] [PubMed] [Google Scholar]
- Pizer SM, Fritsch DS, Yushkevich PA, Johnson VE, Chaney EL (1999) Segmentation, registration, and measurement of shape variation via image object shape IEEE Transactions on Medical Imaging 18:851–865 [DOI] [PubMed] [Google Scholar]
- Posener JA et al. (2003) High-dimensional mapping of the hippocampus in depression American Journal of Psychiatry 160:83. [DOI] [PubMed] [Google Scholar]
- Price JL, Drevets WC (2012) Neural circuits underlying the pathophysiology of mood disorders Trends in Cognitive Sciences 16:61–71 [DOI] [PubMed] [Google Scholar]
- Reagh ZM, Noche JA, Tustison NJ, Delisle D, Murray EA, Yassa MA (2018) Functional Imbalance of Anterolateral Entorhinal Cortex and Hippocampal Dentate/CA3 Underlies Age-Related Object Pattern Separation Deficits 97:1187–1198.e1184 [DOI] [PMC free article] [PubMed] [Google Scholar]
- Rodrigues SM, Schafe GE, Ledoux JE (2004) Molecular Mechanisms Underlying Emotional Learning and Memory in the Lateral Amygdala Neuron 44:75. [DOI] [PubMed] [Google Scholar]
- Root CM, Denny CA, Hen R, Axel R (2014) The participation of cortical amygdala in innate, odour-driven behaviour Nature 515:269–273 [DOI] [PMC free article] [PubMed] [Google Scholar]
- Rosso IM, Cintron CM, Steingard RJ, Renshaw PF, Young AD, Yurgeluntodd DA (2005) Amygdala and hippocampus volumes in pediatric major depression Biological Psychiatry 57:21–26 [DOI] [PubMed] [Google Scholar]
- Saxe MD et al. (2007) Paradoxical Influence of Hippocampal Neurogenesis on Working Memory Proceedings of the National Academy of Sciences of the United States of America 104:4642–4646 [DOI] [PMC free article] [PubMed] [Google Scholar]
- Schmaal L et al. (2017) Cortical abnormalities in adults and adolescents with major depression based on brain scans from 20 cohorts worldwide in the ENIGMA Major Depressive Disorder Working Group Molecular Psychiatry 22:900. [DOI] [PMC free article] [PubMed] [Google Scholar]
- Schmaal L et al. (2016) Subcortical brain alterations in major depressive disorder: findings from the ENIGMA Major Depressive Disorder working group Mol Psychiatry 21:806–812 [DOI] [PMC free article] [PubMed] [Google Scholar]
- Schnittker J (2010) Gene-environment correlations in the stress-depression relationship Journal of Health & Social Behavior 51:229. [DOI] [PubMed] [Google Scholar]
- Shammah-Lagnado SJ, Alheid GF, Heimer L (1999) Afferent connections of the interstitial nucleus of the posterior limb of the anterior commissure and adjacent amygdalostriatal transition area in the rat Neuroscience 94:1097–1123 [DOI] [PubMed] [Google Scholar]
- Sheline YI, Gado MH, Price JL (1998) Amygdala core nuclei volumes are decreased in recurrent major depression Neuroreport 9:2023–2028 [DOI] [PubMed] [Google Scholar]
- Sheline YI, Wang PW, Gado MH, Csernansky JG, Vannier MW (1996) Hippocampal atrophy in recurrent major depression Proceedings of the National Academy of Sciences of the United States of America 93:3908–3913 [DOI] [PMC free article] [PubMed] [Google Scholar]
- Shi J et al. (2015) Studying ventricular abnormalities in mild cognitive impairment with hyperbolic Ricci flow and tensor-based morphometry Neuroimage 104:1–20 [DOI] [PMC free article] [PubMed] [Google Scholar]
- Shi J, Thompson PM, Gutman B, Wang Y (2013) Surface fluid registration of conformal representation: application to detect disease burden and genetic influence on hippocampus Neuroimage 78:111. [DOI] [PMC free article] [PubMed] [Google Scholar]
- Silk JS, Steinberg L, Morris AS (2003) Adolescents’ emotion regulation in daily life: links to depressive symptoms and problem behavior Child Development 74:1869–1880 [DOI] [PubMed] [Google Scholar]
- Smith DM, Mizumori SJ (2006) Hippocampal place cells, context, and episodic memory Hippocampus 16:716–729 [DOI] [PubMed] [Google Scholar]
- Snyder HR (2013) Major depressive disorder is associated with broad impairments on neuropsychological measures of executive function: A meta-analysis and review Psychological Bulletin 139:81–132 [DOI] [PMC free article] [PubMed] [Google Scholar]
- Styner M et al. (2006) Framework for the Statistical Shape Analysis of Brain Structures using SPHARM-PDM Insight Journal 1071:242. [PMC free article] [PubMed] [Google Scholar]
- Sullivan PF, Neale MC, Kendler KS (2000) Genetic Epidemiology of Major Depression: Review and Meta-Analysis American Journal of Psychiatry 157:1552. [DOI] [PubMed] [Google Scholar]
- Sun Q, Sotayo A, Cazzulino AS, Snyder AM, Denny CA, Siegelbaum SA (2017) Proximodistal heterogeneity of hippocampal CA3 pyramidal neuron intrinsic properties, connectivity, and reactivation during memory recall Neuron 95:656–672. e653 [DOI] [PMC free article] [PubMed] [Google Scholar]
- Tang Y et al. (2007) Reduced ventral anterior cingulate and amygdala volumes in medication-naïve females with major depressive disorder: A voxel-based morphometric magnetic resonance imaging study Psychiatry Research 156:83. [DOI] [PubMed] [Google Scholar]
- Thompson P, Giedd JN, Woods RP, Macdonald D, Evans AC, Toga AW (2000) GROWTH PATTERNS IN THE DEVELOPING HUMAN BRAIN DETECTED USING CONTINUUM-MECHANICAL TENSOR MAPPING Nature 404:190–193 [DOI] [PubMed] [Google Scholar]
- Thompson PM et al. (2004) Mapping hippocampal and ventricular change in Alzheimer disease Neuroimage 22:1754–1766 [DOI] [PubMed] [Google Scholar]
- Thompson PM et al. (2003) Dynamics of Gray Matter Loss in Alzheimer’s Disease Journal of Neuroscience the Official Journal of the Society for Neuroscience 23:994–1005 [DOI] [PMC free article] [PubMed] [Google Scholar]
- Tulving E, Markowitsch HJ (1998) Episodic and declarative memory: role of the hippocampus Hippocampus 8:198. [DOI] [PubMed] [Google Scholar]
- Uher R (2008) The implications of gene-environment interactions in depression: will cause inform cure? Mol Psychiatry 13:1070–1078 [DOI] [PubMed] [Google Scholar]
- Van EP et al. (2009) Amygdala volume marks the acute state in the early course of depression Biological Psychiatry 65:812–818 [DOI] [PubMed] [Google Scholar]
- Videbech P, Ravnkilde B (2004) Hippocampal volume and depression: a meta-analysis of MRI studies American Journal of Psychiatry 161:1957–1966 [DOI] [PubMed] [Google Scholar]
- Viskontas IV, Carr VA, Engel SA, Knowlton BJ (2009) The neural correlates of recollection: hippocampal activation declines as episodic memory fades Hippocampus 19:265–272 [DOI] [PubMed] [Google Scholar]
- Wang PS, Simon G, Kessler RC (2010) The economic burden of depression and the cost-effectiveness of treatment International Journal of Methods in Psychiatric Research 12:22–33 [DOI] [PMC free article] [PubMed] [Google Scholar]
- Wang Y, Chan TF, Toga AW, Thompson PM Multivariate Tensor-Based Brain Anatomical Surface Morphometry via Holomorphic One-Forms. In: International Conference on Medical Image Computing & Computer-assisted Intervention, 2009. pp 337–344 [DOI] [PMC free article] [PubMed]
- Wang Y, Gu X, Chan TF, Thompson PM, Yau ST Conformal slit mapping and its applications to brain surface parameterization. In: International Conference on Medical Image Computing and Computer-Assisted Intervention, 2008. pp 585–593 [DOI] [PubMed]
- Wang Y, Panigrahy A, Ceschin R, Liu S, Thompson PM, Leporé N (2013b) Surface Morphometry of Subcortical Structures in Premature Neonates
- Wang Y et al. (2013) Surface Multivariate Tensor-based Morphometry on Premature Neonates: A Pilot Study
- Wang Y et al. (2011) Surface-based TBM boosts power to detect disease effects on the brain: An N = 804 ADNI study ☆ Neuroimage 56:1993–2010 [DOI] [PMC free article] [PubMed] [Google Scholar]
- Wang Y et al. (2013a) Applying tensor-based morphometry to parametric surfaces can improve MRI-based disease diagnosis Neuroimage 74:209–230 [DOI] [PMC free article] [PubMed] [Google Scholar]
- Williams JB (1988) A structured interview guide for the Hamilton Depression Rating Scale Archives of General Psychiatry 45:742. [DOI] [PubMed] [Google Scholar]
- Williams JB (2001) Standardizing the Hamilton Depression Rating Scale: past, present, and future European Archives of Psychiatry & Clinical Neuroscience 251 Suppl 2:II6. [DOI] [PubMed] [Google Scholar]
- Williams JM, Broadbent K (1986) Autobiographical memory in suicide attempters Journal of Abnormal Psychology 95:144. [DOI] [PubMed] [Google Scholar]
- Williams JM, Scott J (1988) Autobiographical memory in depression Psychological Medicine 18:689. [DOI] [PubMed] [Google Scholar]
- Winocur G, Wojtowicz JM, Sekeres M, Snyder JS, Wang S (2006) Inhibition of neurogenesis interferes with hippocampus‐dependent memory function Hippocampus 16:296. [DOI] [PubMed] [Google Scholar]
- Wood ER, Dudchenko PA, Eichenbaum H (1999) The global record of memory in hippocampal neuronal activity Nature 397:613. [DOI] [PubMed] [Google Scholar]
- Woods RP (2003) Characterizing volume and surface deformations in an atlas framework: theory, applications, and implementation Neuroimage 18:769. [DOI] [PubMed] [Google Scholar]
- Yoshimura S, Ueda K, Suzuki S, Onoda K, Okamoto Y, Yamawaki S (2009) Self-referential processing of negative stimuli within the ventral anterior cingulate gyrus and right amygdala Brain & Cognition 69:218–225 [DOI] [PubMed] [Google Scholar]
- Zald DH (2003) The human amygdala and the emotional evaluation of sensory stimuli Brain Res Brain Res Rev 41:88–123 [DOI] [PubMed] [Google Scholar]
- Zeineh MM, Engel SA, Thompson PM, Bookheimer SY (2003) Dynamics of the hippocampus during encoding and retrieval of face-name pairs Science 299:577–580 [DOI] [PubMed] [Google Scholar]