Figure 6.
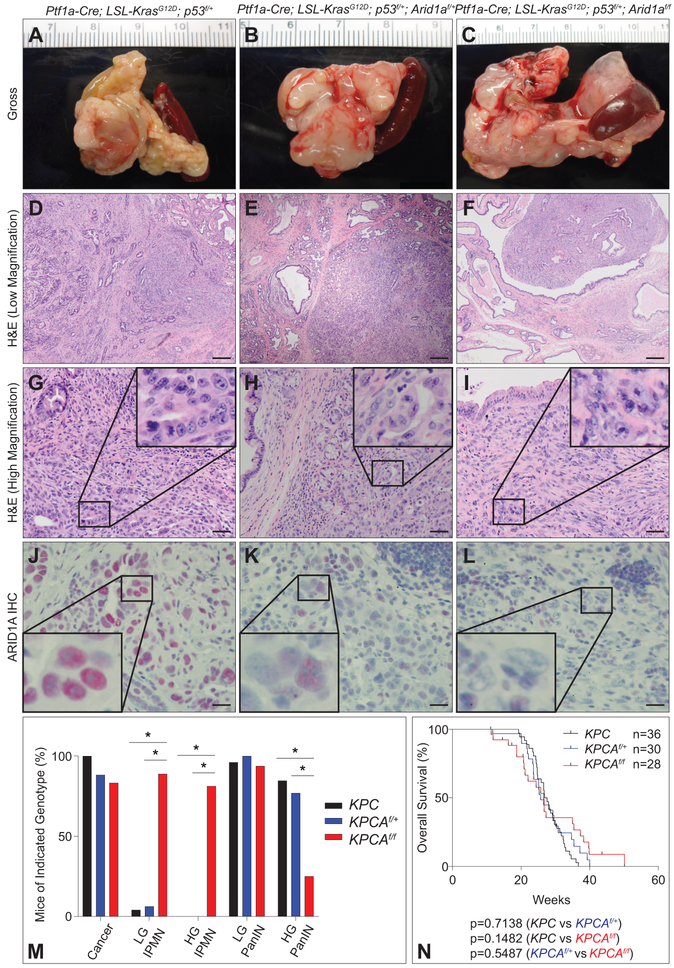
Arid1a mutation in KrasG12D; p53 PDAC model. (A-C) Gross images at necropsy of (A) Ptf1a-Cre; KrasG12D; p53f/+ (KPC), (B) Ptf1a-Cre; KrasG12D; p53f/+; Arid1af/+ (KPCAf/+), and (C) Ptf1a-Cre; KrasG12D; p53f/+; Arid1af/f (KPCAf/f). (D-F) Low magnification H&E of (D) KPC PDAC with associated PanIN, (E) KPCAf/+ PDAC with mix of precursors, and (F) KPCAf/f PDAC with associated IPMN. Bar=200 μm. (G-I) High magnification H&E reveals (I and inset) high grade KPCAf/f PDAC compared to (G and inset) KPC and (H and inset) KPCAf/+. Bar=50 μm. (J-L) ARID1A IHC demonstrates intact ARID1A staining in (J) KPC PDAC and (K) KPCAf/+ PDAC and loss of ARID1A staining in (L) KPCAf/f PDAC. Bar=20 μm. (M) Quantification of percent incidence of cancer, LG IPMN, HG IPMN, LG PanIN, and HG PanIN in mice sacrificed at signs of distress; n=36 mice for KPC, 30 mice for KPCAf/+, and 26 mice for KPCAf/f, *p<0.05. (N) Kaplan-Meier plot of overall survival (OS) for KPC (black, n=36, 27.22 weeks), KPCAf/+ (blue, n=30, 25.71 weeks), and KPCAf/f (red, n=28, 26.57 weeks) shows no significant differences in survival.

