Abstract
RNA sequencing (RNA-seq) has become the widely preferred choice for surveying the genome-wide transcriptome complexity in many organisms. However, the broad adaptation of this methodology into the clinic still needs further evaluation of potential effect of sample preparation factors on its analytical reliability using patient samples. In this study, we examined the impact of three major sample preparation factors (i.e., cDNA library storage time, the quantity of input RNA, and cryopreservation of cell samples) on sequence biases, gene expression profiles, and enriched biological functions using RNAs isolated from primary B cell and CD4+ cell blood samples of healthy subjects. Our comprehensive comparison results suggested that different cDNA library storage time, quantity of input RNA, and cryopreservation of cell samples did not significantly alter gene transcriptional expression profiles generated by RNA-seq experiments. These findings shed new lights on the potential applications of RNA-seq technique to patient samples in a regular clinical setting.
Keywords: RNA-seq, quantity of input RNA, library storage time, cryopreservation, lincRNA
1. Introduction
Whole transcriptome RNA sequencing (RNA-seq) technology has been widely used in biomedical and clinical research [1]. For instance, RNA-seq serves as a routine platform for studying differential expression patterns, analyzing alternative splicing events, and identifying novel transcripts in several organisms [2]. RNA-seq can also investigate other genome-wide transcriptional changes, such as chimeric gene fusions, single nucleotide variants, and insertions and deletion events [3]. By coupling with other omics datasets such as genome-wide association study (GWAS), chromatin immunoprecipitation sequencing (ChIP-seq), proteomics, and metabolomics, RNA-seq can help systematically investigate multi-model biological problems [4]. To facilitate the identification of novel genes/transcripts, RNA-seq can also conduct de novo transcriptome characterization [5]. The versatility of RNA-seq makes it an increasingly widely used technology for the systematic characterization of whole transcriptomes in many organisms and diseases. Despite these advantages of RNA-seq [6, 7], it is still a rapidly developing biotechnology that faces several challenges. For instance, multiple library preparation steps used to generate RNA-Seq datasets may introduce potential confounding factors and biases, including the sample preparation, sequencing platforms and processes, and bioinformatics analysis approaches. Numerous studies have primarily focused on comparing different sequencing processes and the bioinformatics analyses so far. For instance, the sequencing process can introduce potential variation and biases on the outputs of RNA-seq experiments, including the library construction (e.g., random hexamer mispriming [8, 9] , PCR artifacts [10] and amplification [11], contamination by off-target transcripts, and differences in fragment size), the sequencing protocols, sequencing equipments (e.g., IonTorrent, PacBio, Illumina, and 454) [12], and sequencing depth [13–15]. Bioinformatics analysis approaches can also influence the outputs of RNA-seq experiments, such as different normalization methods [16, 17], quality filter [18, 19], batch effects [20], annotated databases [21, 22], and various estimation methods on gene/transcript expression [23, 24]. However, one oftenoverlooked aspect is the sample preparation process. The sample preparation may also bring potential variation and biases on RNA-seq experiments, including RNA isolation, sample handling, library storage time, RNA input level (e.g., differences in the quantity of starting RNA), and sample cryopreservation (e.g., fresh or cryopreserved). Despite a few studies investigating the potential effects of library storage time, the quantity of input RNA [25], and cryopreservation of cell samples [26] that can be routine preparation steps in RNA-seq experiments, potential effects of these factors on the outputs of RNA-seq outputs using RNAs isolated from individual immune cell types in patients’ blood samples is still largely unknown, which may influence the calls of gene expression therefore the downstream functional studies.
In this study, we investigated the potential effects of different library storage time, quantity of input RNA, and sample cryopreservation on the gene level characterization of RNA-seq data. Our comparison results suggested that different quantity levels of input RNA, library storage time, and sample cryopreservation may introduce few variation and biases, while they did not alter overall gene transcriptional expression profiles of RNAseq experiments.
2. Materials and methods
2.1. Cell isolation
Human primary B cells and CD4+ cells were isolated from freshly drawn peripheral blood using magnetic beads as described previously [27]. Blood samples were obtained from healthy volunteers giving written consent under Institutional Review Board approved protocol (12–002580) at Mayo Clinic.
2.2. RNA and cDNA library preparation
All RNA samples considered fresh were derived from freshly isolated cells, stored as cell lysates in Qiazol (Qiagen). For RNA samples considered from frozen, peripheral blood mononuclear cells (PBMCs) were isolated from fresh whole blood then frozen in Cosmic calf serum containing 5 percent DMSO at −80 degree; CD4+ cells were isolated from the thawed PBMCs using magnetic beads, and RNA was isolated using Qiazol in parallel with the other samples. Once purified using miRNAeasy kits (Qiagen), RNA was stored at −80 degree in water.
The cDNA libraries were prepared in the Mayo Clinic Medical Genome Facility Gene Expression Core using mRNA TruSeq v.2 (Illumina) as per manufacturer’s procedures [27] and stored in water at −80 degree. The Truseq library preparation protocol is designed to capture RNA with polyA tails in an un-stranded fashion thus washes away ribosomal RNA (rRNA) during the wash procedures. For input RNA titration, 1 microgram or 500, 250, or 100 nanograms of the same sample RNA was used to make the cDNA libraries.
2.3. Bioinformatics analyses
All biological samples (Supplementary Table S1) were sequenced using the HiSeq 2000 platform (Illumina) with a 50-bp pair-end sequencing protocol in the Mayo Clinic DNA Sequencing Core Facility. Raw RNA-seq reads were aligned to the human genome assembly (GRCh38) for per sample using the Ensembl annotation (Homo_sapiens.GRCh38.84.gtf) by the HISAT2 (Version 2.0.4) [28].
The quality control of RNA-seq was conducted and gene counts were computed by the Qualimap (Version 2.2) [29] with the Ensembl annotation (Homo_sapiens.GRCh38.84.gtf). The Qualimap provides ratios between mean coverage at the 5’ region, the 3’ region and the whole transcript: the 5’ bias is the ratio between mean coverage at the 5’ region and the whole transcript, the 3’ bias is the ratio between mean coverage at the 3’ region and the whole transcript, and the 5’−3’ bias is the ratio between both biases. The results of the quality control generated by Qualimap were assembled using the MultiQC [30].
The raw mapped reads were normalized to the count per million (CPM) values at gene level for all downstream statistical analyses as described in previous studies [29, 31] . The genes were considered to be differentially expressed across different groups if they had greater than a 2-fold change and a false discovery rate (FDR) less than 0.05 using the edgeR R package [32]. One gene was considered expressed if it had the CPM value greater than 10 in at least 1 sample in the same group.
2.4. Statistical analyses
The principal component analysis (PCA) was conducted using the plotMDS function in the edgeR package. Hierarchical clustering was performed using the pvclust R package [33] with multiscale bootstrap resampling (i.e., 1000 time), and p-values were computed for each of the clusters (e.g., AU, approximately unbiased; BP, bootstrap probability). The correlation analysis was performed using the corrplot R package with Pearson correlation coefficient.
2.5. Gene functional enrichment analyses
Gene functional enrichment analyses were performed using the Database for Annotation, Visualization and Integrated Discovery (DAVID) v6.8 [34] based on the GO molecular function and the KEGG pathway annotations.
2.6. Availability of data and materials
The sequencing data set has been deposited in the NCBI Gene Expression Omnibus (GEO) database (GEO accession number GSE110417).
3. Results
We investigated the potential impact of the sample preparation factors, including library storage time, quantity of input RNA, and sample cryopreservation, on RNA-seq experiments using B cells or CD4+ cells in blood samples of healthy subjects (Supplementary Table S1).
3.1. The impact of the library storage time on RNA-seq experiments
To explore the impact of the library storage time on RNA-seq outputs, we investigated the differences between two groups of CD4+ blood samples: one group contains patient samples with original cDNA libraries (i.e., original group) prepared by the Truseq protocol, and the other contains samples with same cDNA libraries stored under −80 degrees for three years (i.e., 3-year group; Supplementary Table S1). In addition, for Subject #107, we also compared its original library and the newly constructed cDNA library (i.e., 107SRN) from the original RNA stored under −80 degree for three years. We first investigated the potential difference of sequencing biases between the original and stored libraries. The aligned percentage of all samples was larger than 92% in both groups. The median insert size of the 107SRN sample was the largest among all samples (Supplementary Table S1). The GC percentage, 3’ bias, 5’ bias, and 5’−3’ bias were very similar between two groups (Fig. 1A). The total read counts in exonic, intergenic, and intronic regions of Subjects #107, 109, and 110 in the 3-year group were obviously smaller than their counterparts in the original group largely due to the less total mapped reads, whereas the percentage of mapped reads showed little variation between the two groups (Fig. 1B and 1C). Intriguingly, the percentage of known spliced alignments in the 3-year group was slightly higher than that of the original group, while the percentage of novel spliced alignments exhibited an opposite trend (Fig. 1D).
Fig. 1.
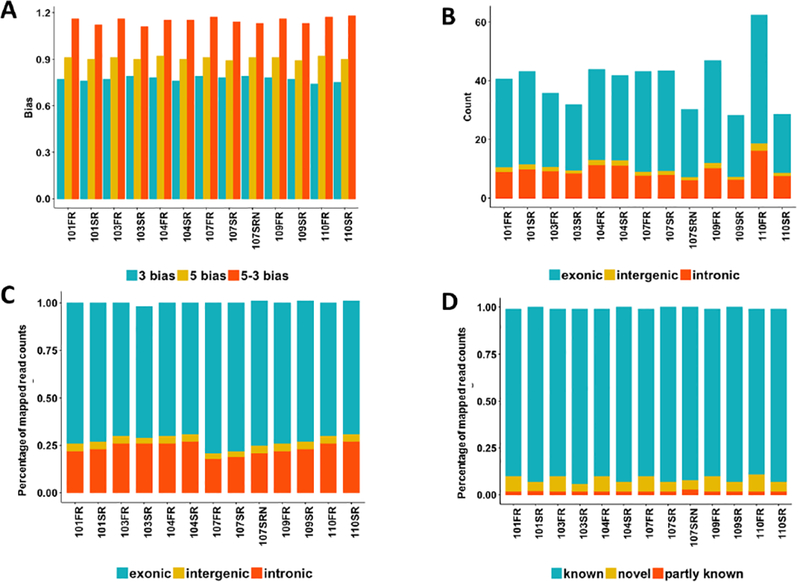
The impact of the library storage time on the sequencing biases in RNA-seq experiments. (A) The distribution of the 3’, 5’, and 5–3’ bias across all samples; (B) the distribution of mapped read counts (million) in the exonic, intergenic, and intronic regions at different RNA input levels; (C) The percentage of mapped reads within the exonic, intergenic, and intronic regions at different RNA input levels; (D) the percentage of known, novel, and partly known spliced alignments of all samples based on the Ensembl annotation (Homo_sapiens.GRCh38.84.gtf).
We also investigated the gene level expression abundance and differential expression patterns between the two groups. The density distribution of gene expression was highly concordant for all samples (Fig. 2A). The PCA plot suggested that the two RNA-seq libraries from same individuals are closest despite the difference of their storage conditions (Fig. 2B). Furthermore, three RNA libraries of Subject #107 (i.e., 107FR for the original library, 107SR for the 3-year library, and 107SRN for the new constructed library from the same RNA after three years), exhibited highly correlated expression patterns (Fig. 2C, 2D, and 2E) with only a few uniquely expressed genes in each sample (Fig. 2F). We identified several pathways enriched in these uniquely expressed genes (Supplementary Table S4). Similarly, enriched biological functions and pathways were highly overlapped in expressed genes based on the gene functional enrichment analysis (Supplementary Fig. S1). Nevertheless, 107SRN showed significant expressional difference from the original libraries (i.e., 107SR and 107FR) by the hierarchically clustering analysis (Fig. 3A). The median abundance of gene expression in the 3-year group remained the same or higher than that in the original group for same individuals (Fig. 3B). Both groups also shared a large number of commonly expressed genes (Fig. 3D), with 140 differentially expressed genes between groups (Supplementary Table S2).
Fig. 2.
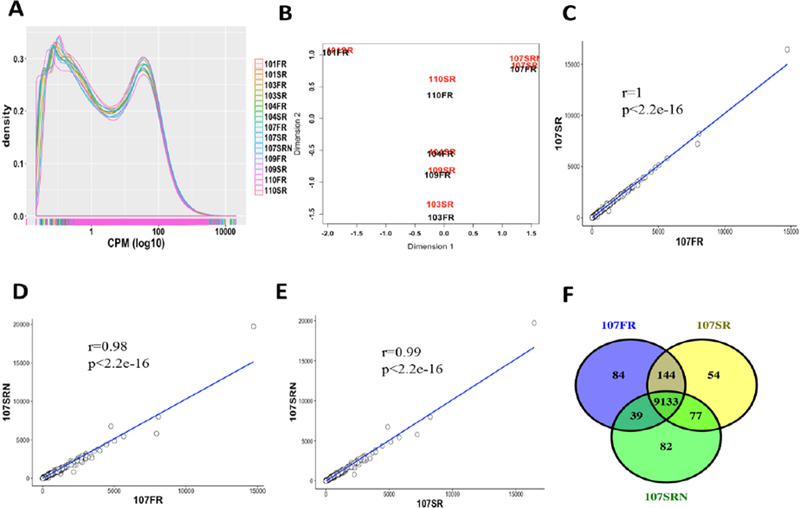
The impact of the library storage time on the gene level expression abundance. (A) The density distribution of the gene CPM value of all samples; (B) The PCA plot of all samples; (C-E) the pairwise correlation plots of gene CPM values between three RNA libraries of Subject #107; and (F) the overlap of expressed genes of three RNA libraries of Subject #107.
Fig. 3.
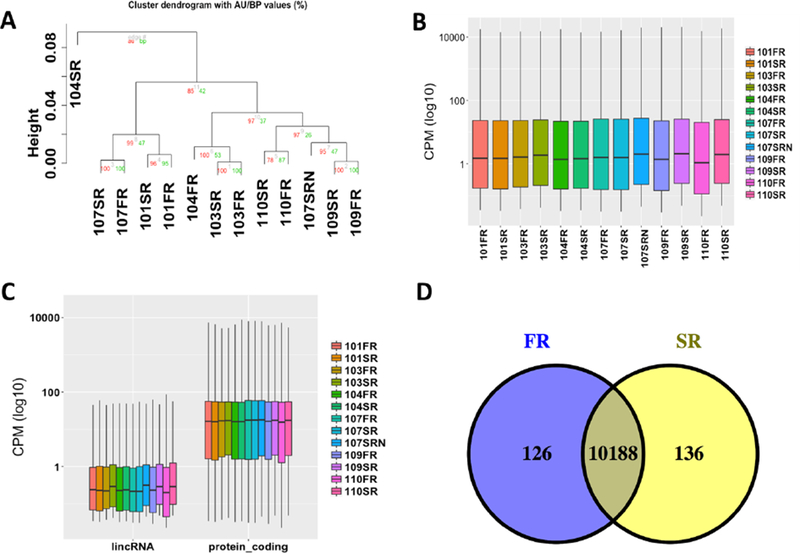
The comparison of RNA-seq samples of different library storage time. (A) The hierarchically clustering analysis of gene profiles of all samples; (B) the distribution of the gene CPM values of all samples; (C) the comparison of the CPM values between lincRNAs and protein-coding genes of all samples; and (D) the overlap of expressed genes of different library storage time (FR, original libraries; SR, 3-year libraries).
Compared with the protein-coding genes, most of the long intergenic noncoding RNAs (lincRNA) genes showed more significant variation between two groups (Fig. 3C). Since most lincRNAs are lowly expressed (i.e., the CPM value is less than 1), we then compared the expression level of all lincRNAs and protein-coding genes with CPM values less than 1 (Supplementary Fig. S6). |We observed similar expression variation between these two groups, suggesting that the higher variation of lincRNAs could be due to its low expression.
3.2. The impact of input RNA on RNA-seq experiments
Standard RNA-seq protocols usually require a relative large amount of input RNA, which makes it difficult to apply to scarce and degraded RNA from fixed clinical samples. To explore the impact of the RNA input level on RNA-seq experiments, we compared the outputs of different RNA input levels (i.e., level 1 = 1 microgram input RNA; level 100 = 100 nanograms input RNA; level 250 = 250 nanograms input RNA; level 500 = 500 nanograms input RNA) using B cells of blood samples from the same healthy subject (i.e., Subject #113).
We first investigated the sequencing biases of samples with different RNA inputs from the same RNA library. Overall, the aligned percentage of all RNA input levels was higher than 90%, and the median insert size, 3’ bias, 5’ bias, and 5’−3’ bias were quite similar across all RNA input levels (Fig. 4A). The GC percentage was slightly increased as RNA input level increased (Supplementary Table S1). Within the exonic, intergenic, and intronic regions, although the raw mapped read counts of RNA input level 1 and 100 were lower than those of level 250 and 500 (Fig. 4B), the percentage of mapped reads remained almost the same across all RNA input levels (Fig. 4C). Similarly, the percentage of known spliced alignments, partly known spliced alignments, and novel spliced alignments were quite comparable across all RNA input levels (Fig. 4D).
Fig. 4.
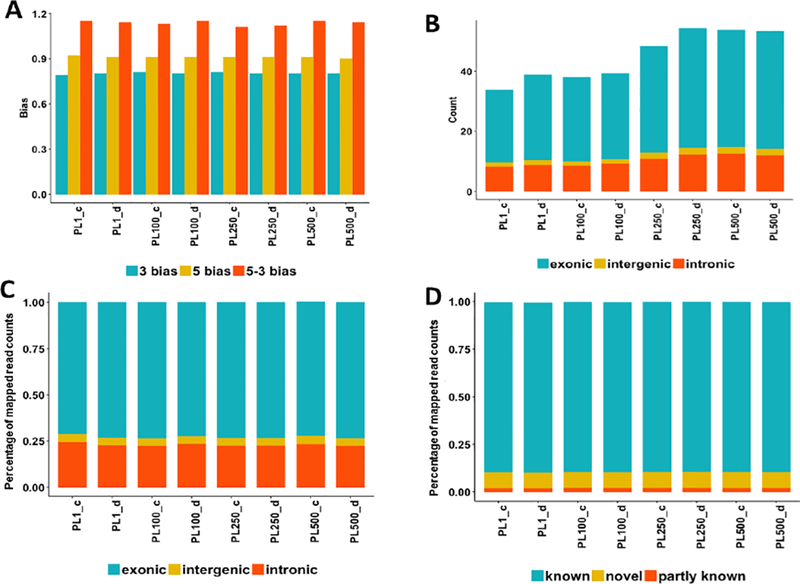
The impact of the RNA concentration on the sequencing biases in RNA-seq experiments. (A) The distribution of the 3’, 5’, and 5–3’ bias across all samples; (B) the distribution of read counts (million) in the exonic, intergenic, and intronic regions; (C) The percentage of the mapped reads within the exonic, intergenic, and intronic regions at different RNA input levels; (D) the percentage of known, novel, and partly known spliced alignments of all samples based on the Ensembl annotation (Homo_sapiens.GRCh38.84.gtf).
We also explored the potential effect of different RNA input levels on the gene expressional abundance and differential expression. The density distribution of gene expression was highly similar across all RNA input levels (Fig. 5A). Samples of different RNA input levels from the same RNA library were quite similar with each other by both PCA and cluster analysis (Fig. 5B and 5C). The median abundance of gene expression was comparable across all RNA input levels (Fig. 5D). Both protein-coding genes and lincRNA genes had almost similar trend with the total gene expression across all levels of input RNA (Fig. 5D and 5E). Since most expressed genes of different RNA input levels were same (Fig. 5F), it is not surprising that they were enriched in similar biological functions and pathways based on the gene functional enrichment analysis (Supplementary Fig. S2 and S3). One-way ANOVA analysis indicated little difference among different RNA input levels (p-value = 0.954), and only a small number of differentially expressed genes were detected between levels (Fig. 5G; Supplementary Table S5), of which one pathway was over represented, i.e., Spliceosomal Cycle.
Fig. 5.
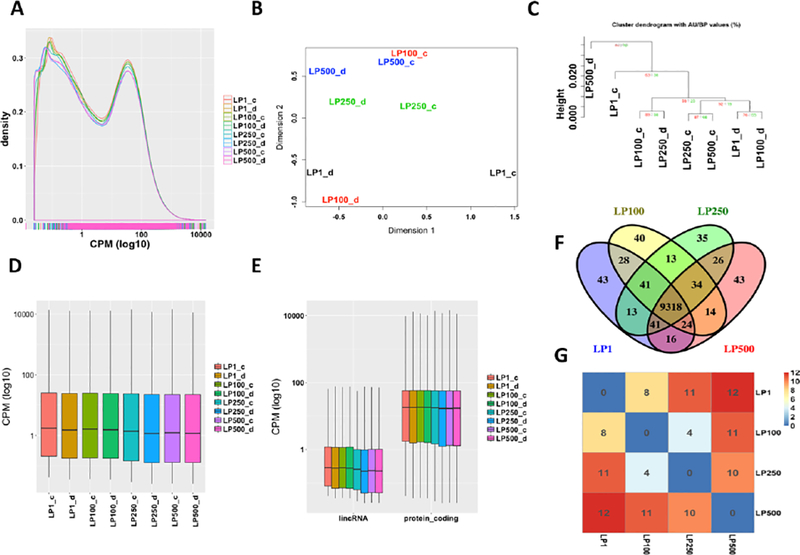
The impact of the input RNA quantity on the gene level expression abundance. (A) The density distribution of the gene CPM value of all samples; (B) The PCA plot of all samples; (C) the hierarchically clustering analysis of all samples; (D) the distribution of the gene CPM values of all samples; (E) the comparison of the CPM values between lincRNAs and protein-coding genes of all samples; (F) the overlap of expressed genes from different input RNA levels (LP1, 1 microgram of input RNA; LP100, 100 nanogram of input RNA; LP250, 250 nanogram of input RNA; LP500, 500 nanogram of input RNA); and (G) the number of differentially expressed genes between libraries derived from different RNA inputs.
3.3. The impact of the sample cryopreservation on RNA-seq experiments
Cryopreservation usually results in an increased proportion of damages cells, which could potentially affect the outputs of RNA-seq experiments. To explore the potential impact of sample cryopreservation on RNA-seq experiments, we investigated the groups of fresh and cryopreserved CD4+ RNA-seq samples derived from 4 healthy subjects (i.e., each subject has both fresh and cryopreserved RNA-seq samples).
First, the aligned percentage of all samples was larger than 91%, and the GC percentage remained almost the same across both conditions (Supplementary Table S1). The 5’−3’ bias of cryopreserved samples was slightly higher than that of fresh samples, while the 3’ bias of cryopreserved samples was slightly lower than that of fresh samples (Fig. 6A). The mapped read counts of cryopreserved samples were higher than those of fresh samples expect for Subject #510 (Fig. 6B). The percentage of mapped reads had slight difference between cryopreserved and fresh samples (Fig. 6C). The percentage of known spliced alignments, partly known spliced alignments, and novel spliced alignments remained almost the same across samples under different cryopreserved conditions (Fig. 6D).
Fig. 6.
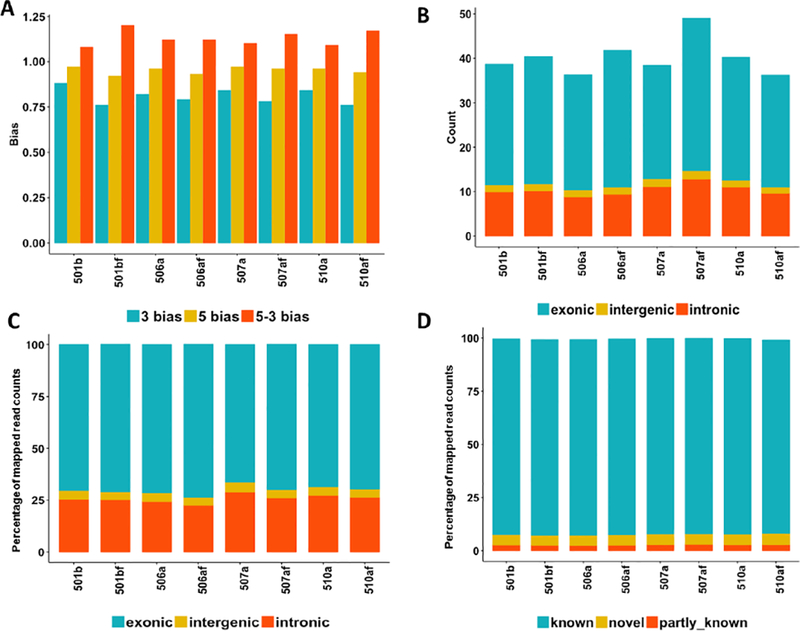
The impact of the cell cryopreservation on the sequencing biases in RNA-seq experiments. (A) The distribution of the 3’, 5’, and 5–3’ bias across all samples; (B) the distribution of read counts (million) in the exonic, intergenic, and intronic regions; (C) the percentage of the mapped reads within the exonic, intergenic, and intronic regions; (D) the percentage of known, novel, and partly known spliced alignments of all samples based on the Ensembl annotation (Homo_sapiens.GRCh38.84.gtf).
We also investigated the potential effect of cryopreservation on the gene expression abundance and differentially expression changes. The density distribution of gene expression was similar between fresh and cryopreserved samples (Fig. 7A). Samples from same individuals were more similar than those under same cryopreserved conditions (Fig. 7B). The fresh and cryopreserved samples were clustered into separate groups by hierarchical clustering analysis (i.e., AU (Approximately Unbiased) p-value = 91% and BP (Bootstrap Probability) p-value = 94%; Fig. 7C). The median gene expression level of both fresh and cryopreserved samples kept almost the same (Fig. 7D). Both the protein-coding genes and lincRNA genes shared similar trend with the overall gene expression between cryopreserved and fresh groups (Fig. 7D and 7E). Samples in both fresh and cryopreservation groups shared most expressed genes (Fig. 7F). Not surprisingly, similar biological functions and pathways were enriched in both conditions based on the gene functional enrichment analysis (Supplementary Fig. S4). Overall, we identified 90 differentially expressed genes between fresh and cryopreservation groups (Supplementary Table S3).
Fig. 7.
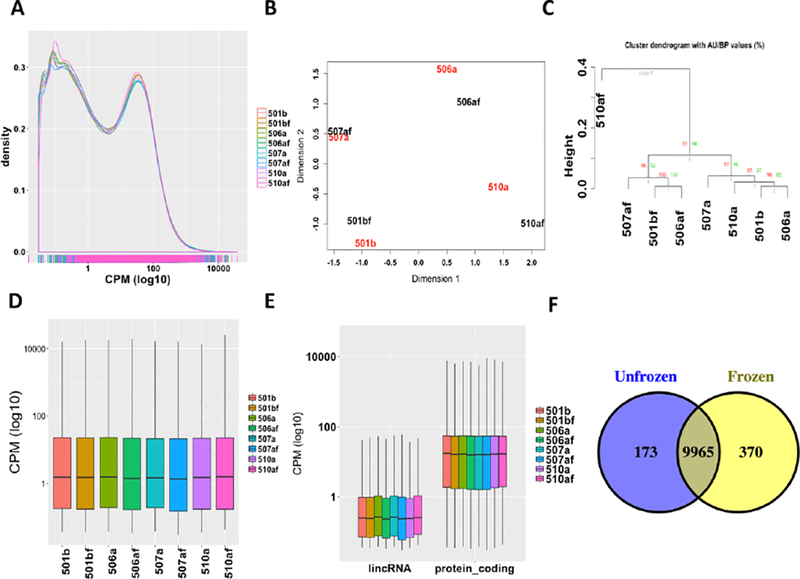
The impact of cell cryopreservation on the gene level expression abundance. (A) The density distribution of the gene CPM value of all samples; (B) The PCA plot of all samples; (C) the hierarchically clustering analysis of all samples; (D) the distribution of the gene CPM values of all samples; (E) the comparison of the CPM values between lincRNAs and protein-coding genes of all samples; and (F) the overlap of expressed genes from different cryopreserved conditions (Unfrozen, fresh samples; Frozen, cryopreserved samples).
4. Discussions
RNA-seq is prevalently used to explore the genome-wide transcriptional activities, in which diverse preparation steps can affect quantitative and qualitative downstream analysis of RNA-seq experiments. In this study, we investigated the effects of three important sample preparation factors on RNA-seq experiments, and found that small ranges of variations of these factors did not significantly affect downstream gene expression analysis and results interpretation. Since these factors are clinically relevant, we believe that our evaluation on them can shed lights on the potential applications of RNA-seq technology in a regular clinical setting in the future.
Multiple steps may introduce confounding variation and biases in RNA-seq experiments. Nevertheless, the sample preparation is often overlooked. For library storage time, some 3-year samples show higher gene expression than the original samples partly because long time storage may result in RNA degradation. Romero et al. observed that RNA quality may affect the measurement of gene expression, and their results indicated that mean RPKM increases as sample RNA Integrity Number (RIN) decreases [35]. However, in our analysis, we didn’t observe statistically significant correlation between them (Supplementary Fig. S5). For different quantity levels of input RNA, if the RNA quality meets the standard to conduct RNA-seq experiments, they shared similar transcriptional profiles. Although cryopreservation could result in an increased proportion of damaged cells, we found that cryopreserved conditions did not significantly alter the gene expression profiles of RNA-seq experiments, consistent with the previous finding that the conservation process did not alter transcriptional profiles in cryopreserved cells and tissue [36].
5. Conclusions
In summary, our study indicated that different library storage time, quantity of input RNA, and sample cryopreservation did not significantly alter gene level transcriptional expression profiles of RNA-seq experiments.
Supplementary Material
Acknowledgements
The authors would like to acknowledge the scientists and staff of the Mayo Clinic Medical Genome Facility Gene Expression Core for all library preparation, data acquisition and processing through their RNAseq pipeline. This project was supported by the National Cancer Institute grant P30 CA134274 to the University of Maryland Baltimore.
Footnotes
Publisher's Disclaimer: This is a PDF file of an unedited manuscript that has been accepted for publication. As a service to our customers we are providing this early version of the manuscript. The manuscript will undergo copyediting, typesetting, and review of the resulting proof before it is published in its final citable form. Please note that during the production process errors may be discovered which could affect the content, and all legal disclaimers that apply to the journal pertain.
Competing interests
The authors declare that they have no competing interests.
Contributor Information
Lei Wang, Email: LeiWang@som.umaryland.edu.
Sara J. Felts, Email: felts.sara@mayo.edu.
Virginia P. Van Keulen, Email: vankeulen.virginia@mayo.edu.
Larry R. Pease, Email: pease.larry@mayo.edu.
Yuji Zhang, Email: yuzhang@som.umaryland.edu.
References
- 1.Byron SA, Van Keuren-Jensen KR, Engelthaler DM, Carpten JD, Craig DW: Translating RNA sequencing into clinical diagnostics: opportunities and challenges. Nat Rev Genet 2016, 17(5):257–271. [DOI] [PMC free article] [PubMed] [Google Scholar]
- 2.Ozsolak F, Milos PM: RNA sequencing: advances, challenges and opportunities. Nature reviews Genetics 2011, 12(2):87–98. [DOI] [PMC free article] [PubMed] [Google Scholar]
- 3.Wang Z, Gerstein M, Snyder M: RNA-Seq: a revolutionary tool for transcriptomics. Nat Rev Genet 2009, 10(1):57–63. [DOI] [PMC free article] [PubMed] [Google Scholar]
- 4.Conesa A, Madrigal P, Tarazona S, Gomez-Cabrero D, Cervera A, McPherson A, Szcześniak MW, Gaffney DJ, Elo LL, Zhang X et al. : A survey of best practices for RNA-seq data analysis. Genome Biology 2016, 17(1). [DOI] [PMC free article] [PubMed] [Google Scholar]
- 5.Janes J, Hu F, Lewin A, Turro E: A comparative study of RNA-seq analysis strategies. Brief Bioinform 2015, 16(6):932–940. [DOI] [PMC free article] [PubMed] [Google Scholar]
- 6.Marioni JC, Mason CE, Mane SM, Stephens M, Gilad Y: RNA-seq: An assessment of technical reproducibility and comparison with gene expression arrays. Genome Research 2008, 18(9):1509–1517. [DOI] [PMC free article] [PubMed] [Google Scholar]
- 7.Sîrbu A, Kerr G, Crane M, Ruskin HJ: RNA-Seq vs dual-and single-channel microarray data: sensitivity analysis for differential expression and clustering. PloS one 2012, 7(12):e50986. [DOI] [PMC free article] [PubMed] [Google Scholar]
- 8.Shivram H, Iyer VR: Identification and removal of sequencing artifacts produced by mispriming during reverse transcription in multiple RNA-seq technologies. RNA 2018, 24(9):1266–1274. [DOI] [PMC free article] [PubMed] [Google Scholar]
- 9.van Gurp TP, McIntyre LM, Verhoeven KJF: Consistent Errors in First Strand cDNA Due to Random Hexamer Mispriming. PLOS ONE 2014, 8(12):e85583. [DOI] [PMC free article] [PubMed] [Google Scholar]
- 10.Sayols S, Scherzinger D, Klein H: dupRadar: a Bioconductor package for the assessment of PCR artifacts in RNA-Seq data. BMC bioinformatics 2016, 17(1):428. [DOI] [PMC free article] [PubMed] [Google Scholar]
- 11.Parekh S, Ziegenhain C, Vieth B, Enard W, Hellmann I: The impact of amplification on differential expression analyses by RNA-seq. Scientific reports 2016, 6:25533. [DOI] [PMC free article] [PubMed] [Google Scholar]
- 12.Escalona M, Rocha S, Posada D: A comparison of tools for the simulation of genomic next-generation sequencing data. Nat Rev Genet 2016, 17(8):459–469. [DOI] [PMC free article] [PubMed] [Google Scholar]
- 13.Haas BJ, Chin M, Nusbaum C, Birren BW, Livny J: How deep is deep enough for RNA-Seq profiling of bacterial transcriptomes? Bmc Genomics 2012, 13. [DOI] [PMC free article] [PubMed] [Google Scholar]
- 14.Sims D, Sudbery I, Ilott NE, Heger A, Ponting CP: Sequencing depth and coverage: key considerations in genomic analyses. Nat Rev Genet 2014, 15(2):121–132. [DOI] [PubMed] [Google Scholar]
- 15.Tarazona S, Garcia-Alcalde F, Dopazo J, Ferrer A, Conesa A: Differential expression in RNA-seq: a matter of depth. Genome Res 2011, 21(12):22132223. [DOI] [PMC free article] [PubMed] [Google Scholar]
- 16.Li P, Piao Y, Shon HS, Ryu KH: Comparing the normalization methods for the differential analysis of Illumina high-throughput RNA-Seq data. BMC Bioinformatics 2015, 16:347. [DOI] [PMC free article] [PubMed] [Google Scholar]
- 17.Zyprych-Walczak J, Szabelska A, Handschuh L, Gorczak K, Klamecka K, Figlerowicz M, Siatkowski I: The Impact of Normalization Methods on RNASeq Data Analysis. Biomed Res Int 2015, 2015:621690. [DOI] [PMC free article] [PubMed] [Google Scholar]
- 18.de Sa PH, Veras AA, Carneiro AR, Pinheiro KC, Pinto AC, Soares SC, Schneider MP, Azevedo V, Silva A, Ramos RT: The impact of quality filter for RNA-Seq. Gene 2015, 563(2):165–171. [DOI] [PubMed] [Google Scholar]
- 19.Williams CR, Baccarella A, Parrish JZ, Kim CC: Trimming of sequence reads alters RNA-Seq gene expression estimates. BMC Bioinformatics 2016, 17:103. [DOI] [PMC free article] [PubMed] [Google Scholar]
- 20.Peixoto L, Risso D, Poplawski SG, Wimmer ME, Speed TP, Wood MA, Abel T: How data analysis affects power, reproducibility and biological insight of RNA-seq studies in complex datasets. Nucleic Acids Res 2015, 43(16):76647674. [DOI] [PMC free article] [PubMed] [Google Scholar]
- 21.Frankish A, Uszczynska B, Ritchie GR, Gonzalez JM, Pervouchine D, Petryszak R, Mudge JM, Fonseca N, Brazma A, Guigo R et al. : Comparison of GENCODE and RefSeq gene annotation and the impact of reference geneset on variant effect prediction. BMC Genomics 2015, 16 Suppl 8:S2. [DOI] [PMC free article] [PubMed] [Google Scholar]
- 22.Zhao S, Zhang B: A comprehensive evaluation of ensembl, RefSeq, and UCSC annotations in the context of RNA-seq read mapping and gene quantification. BMC Genomics 2015, 16:97. [DOI] [PMC free article] [PubMed] [Google Scholar]
- 23.Kanitz A, Gypas F, Gruber AJ, Gruber AR, Martin G, Zavolan M: Comparative assessment of methods for the computational inference of transcript isoform abundance from RNA-seq data. Genome Biol 2015, 16:150. [DOI] [PMC free article] [PubMed] [Google Scholar]
- 24.Anders S, McCarthy DJ, Chen Y, Okoniewski M, Smyth GK, Huber W, Robinson MD: Count-based differential expression analysis of RNA sequencing data using R and Bioconductor. Nature protocols 2013, 8(9):1765–1786. [DOI] [PubMed] [Google Scholar]
- 25.Schuierer S, Carbone W, Knehr J, Petitjean V, Fernandez A, Sultan M, Roma G: A comprehensive assessment of RNA-seq protocols for degraded and lowquantity samples. BMC genomics 2017, 18(1):442. [DOI] [PMC free article] [PubMed] [Google Scholar]
- 26.Wimmer I, Tröscher AR, Brunner F, Rubino SJ, Bien CG, Weiner HL, Lassmann H, Bauer J: Systematic evaluation of RNA quality, microarray data reliability and pathway analysis in fresh, fresh frozen and formalin-fixed paraffinembedded tissue samples. Scientific reports 2018, 8(1):6351. [DOI] [PMC free article] [PubMed] [Google Scholar]
- 27.Felts SJ, Van Keulen VP, Scheid AD, Allen KS, Bradshaw RK, Jen J, Peikert T, Middha S, Zhang Y, Block MS et al. : Gene expression patterns in CD4+ peripheral blood cells in healthy subjects and stage IV melanoma patients. Cancer immunology, immunotherapy : CII 2015, 64(11):1437–1447. [DOI] [PMC free article] [PubMed] [Google Scholar]
- 28.Kim D, Langmead B, Salzberg SL: HISAT: a fast spliced aligner with low memory requirements. Nat Methods 2015, 12(4):357–360. [DOI] [PMC free article] [PubMed] [Google Scholar]
- 29.Okonechnikov K, Conesa A, Garcia-Alcalde F: Qualimap 2: advanced multisample quality control for high-throughput sequencing data. Bioinformatics 2016, 32(2):292–294. [DOI] [PMC free article] [PubMed] [Google Scholar]
- 30.Ewels P, Magnusson M, Lundin S, Kaller M: MultiQC: summarize analysis results for multiple tools and samples in a single report. Bioinformatics 2016, 32(19):3047–3048. [DOI] [PMC free article] [PubMed] [Google Scholar]
- 31.Zhu A, Ibrahim JG, Love MI: Heavy-tailed prior distributions for sequence count data: removing the noise and preserving large differences. Bioinformatics 2018. [DOI] [PMC free article] [PubMed] [Google Scholar]
- 32.Robinson MD, McCarthy DJ, Smyth GK: edgeR: a Bioconductor package for differential expression analysis of digital gene expression data. Bioinformatics 2010, 26(1):139–140. [DOI] [PMC free article] [PubMed] [Google Scholar]
- 33.Suzuki R, Shimodaira H: Pvclust: an R package for assessing the uncertainty in hierarchical clustering. Bioinformatics 2006, 22(12):1540–1542. [DOI] [PubMed] [Google Scholar]
- 34.Huang DW, Sherman BT, Lempicki RA: Systematic and integrative analysis of large gene lists using DAVID bioinformatics resources. Nature protocols 2009, 4(1):44–57. [DOI] [PubMed] [Google Scholar]
- 35.Romero IG, Pai AA, Tung J, Gilad Y: RNA-seq: impact of RNA degradation on transcript quantification. BMC biology 2014, 12(1):42. [DOI] [PMC free article] [PubMed] [Google Scholar]
- 36.Guillaumet-Adkins A, Rodríguez-Esteban G, Mereu E, Mendez-Lago M, Jaitin DA, Villanueva A, Vidal A, Martinez-Marti A, Felip E, Vivancos A: Single-cell transcriptome conservation in cryopreserved cells and tissues. Genome biology 2017, 18(1):45. [DOI] [PMC free article] [PubMed] [Google Scholar]
Associated Data
This section collects any data citations, data availability statements, or supplementary materials included in this article.
Supplementary Materials
Data Availability Statement
The sequencing data set has been deposited in the NCBI Gene Expression Omnibus (GEO) database (GEO accession number GSE110417).


