

Abstract
The lytic recombinant tissue plasminogen activator (rt-PA) is the only drug approved by the Food and Drug Administration for treating ischemic stroke. Less than 40% of patients with large vessel occlusions who are treated with rt-PA have improved blood flow. However, up to 6% of all patients receiving rt-PA develop intracerebral hemorrhage. Predicting the efficacy of rt-PA treatment a priori could help guide therapeutic decision-making, such that rt-PA is administered only to those individuals who would benefit from this treatment. Clot composition and structure affect the lytic efficacy of rt-PA and have an impact on elasticity. However, the relationship between clot elasticity and rt-PA lytic susceptibility has not been adequately investigated. The goal of this study was to quantify the relationship between clot elasticity and rt-PA susceptibility in vitro. Human and porcine highly retracted and mildly retracted clots were fabricated in glass pipettes. The rt-PA lytic susceptibility was evaluated in vitro using the percent clot mass loss. The Young’s moduli of the clots were estimated using ultrasound-based single-track-location shear wave elasticity imaging. The percent mass loss in mildly retracted porcine and human clots (28.9 ± 6.1% and 45.2 ± 7.1%, respectively) were significantly higher (p < 0.05) than those in highly retracted porcine and human clots (10.9 ± 2.1% and 25.5 ± 10.0%, respectively). Furthermore, the Young’s moduli of highly retracted porcine and human clots (5.33 ± 0.92 kPa and 3.21 ± 1.97 kPa, respectively) were significantly higher (p < 0.05) than those of mildly retracted porcine and human clots (2.66 ± 0.55 kPa and 0.79 ± 0.21 kPa, respectively). The results revealed an inverse relationship between the percent clot mass loss and Young’s modulus. These findings motivate continued investigation of ultrasound-based methods to assess clot stiffness in order to predict rt-PA thrombolytic efficacy.
Keywords: Shear wave imaging, ultrasound elastography, rt-PA, clot stiffness, clot composition, lytic efficacy
Introduction
Despite significant treatment advances, stroke remains a leading cause of long-term disability in the world and is the fifth leading cause of death in the United States (Benjamin et al. 2018). The majority of strokes are ischemic and caused by thromboembolic occlusion of arterial blood flow in the brain (Benjamin et al. 2018). One of the primary objectives of acute ischemic stroke (AIS) treatment is to recanalize the occluded vessel and restore blood flow (Powers et al. 2015). In the current guidelines for treating AIS, eligible patients should begin receiving intravenous recombinant tissue plasminogen activator (IV rt-PA) within 3 to 4.5 hr of symptom onset (Powers et al. 2015). Patients treated with rt-PA display variable outcomes, depending on the size and location of the affected vessel, thrombus size, composition, and etiology. Larger and fibrin-rich thrombi are more resistant to thrombolytic treatment (Kim et al. 2006; Saqqur et al. 2007). Mechanical thrombectomy is another approach in which thrombi are mechanically removed from blocked arteries (Ciccone et al. 2013; Jovin et al. 2015; Saver et al. 2015). During mechanical thrombectomy, rt-PA may also be used as a therapeutic adjunct in eligible patients to prevent embolization from thrombus fragments and to recanalize smaller arteries (Davalos et al. 2012; Desilles et al. 2015; Saver et al. 2015). Among individuals treated intravenously with rt-PA, approximately 6% develop intracerebral hemorrhage (Graham 2003; The NINDS t-PA Stroke Study Group 1997), a condition resulting in mortality rates of up to 75% for these patients Goldstein et al. 2010). Furthermore, less than 40% of patients with large vessel occlusions who are treated with rt-PA attain partial or complete recanalization of the occluded cerebral arteries (Mokin et al. 2012). If it were possible to identify patients that do not respond to rt-PA treatment a priori, the time to recanalization could potentially be reduced using a direct mechanical thrombectomy approach without attempting a futile rt-PA treatment with associated risks. Therefore, it is critical to develop new diagnostic procedures to tailor treatment selection for each acute ischemic stroke patient.
Imaging-based assessment of thrombi has been investigated to help guide the clinical pathway of stroke therapy. Computed tomography (CT) and magnetic resonance imaging (MRI) have been investigated as techniques to predict the likelihood of recanalization using rt-PA and mechanical thrombectomy (Bourcier et al. 2015; Froehler et al. 2013; Jagani et al. 2017; Kang et al. 2017; Liebeskind et al. 2011; Moftakhar et al. 2013; Mokin et al. 2015; Niesten et al. 2014; Puig et al. 2012; Yilmaz et al. 2013). Although some studies reported the ability to successfully predict recanalization in ischemic stroke patients (Bourcier et al. 2015; Froehler et al. 2013; Moftakhar et al. 2013; Mokin et al. 2015; Niesten et al. 2014; Puig et al. 2012), others did not find a correlation between imaging parameters and recanalization success (Jagani et al. 2017; Kang et al. 2017; Liebeskind et al. 2011; Yilmaz et al. 2013). These studies indicate that it is not entirely clear whether CT and MR imaging are reliable predictors of recanalization success.
Clot composition and structure have been related to the mechanical properties (Chueh et al. 2011; Sutton et al. 2013). For instance, Chueh et al. (2011) showed that human thromboemboli composed primarily of fibrin and erythrocytes were softer than calcified and cholesterol-rich thrombi. The efficacy of mechanical thrombectomy procedures was also found to depend on the composition and mechanical properties of clots (Machi et al. 2016; Maekawa et al. 2018; Yuki et al. 2012). In vivo porcine studies by Yuki and colleagues (2012) revealed that vessels occluded by fibrin-rich, stiff clots required more passes with a Merci clot retriever device to achieve recanalization than vessels occluded by erythrocyte-rich, soft clots. In a clinical study by Maekawa et al. (2018), erythrocyte-rich thrombi were associated with shorter time to recanalization and required less passes with stent retrievers. Sutton et al. (2013) reported the clot lytic efficacy of rt-PA with the adjuvant use of ultrasound and the echocontrast agent Definity. Their findings showed that retracted porcine clots were less porous and had higher fibrin content than unretracted clots (Sutton et al. 2013). Furthermore, ultrasound did not enhance rt-PA lysis of retracted porcine clots in the presence of Definity (Sutton et al. 2013). On the other hand, unretracted, soft clots exhibited rt-PA thrombolytic enhancement when exposed to ultrasound and Definity® (Sutton et al. 2013). These studies showed that clot structure and composition influenced rt-PA lysis (Sutton et al. 2013) and the effectiveness of mechanical thrombectomy procedures (Machi et al. 2016; Maekawa et al. 2018; Yuki et al. 2012). Furthermore, thrombus composition affected stiffness (Chueh et al. 2011). However, the direct relationship between clot stiffness and rt-PA thrombolytic efficacy has not been adequately investigated.
The use of ultrasound elastography for assessing thrombi has been reported previously for staging thrombi in deep vein thrombosis in preclinical studies (Emelianov et al. 2002; Xie et al. 2004; Xie et al. 2005). The primary goal of these studies was to relate the age of the thrombi to stiffness. Ultrasound elastography has also been used to characterize clots during their formation (Bernal et al. 2013; Gennisson et al. 2006; Mfoumou et al. 2014; Schmitt et al. 2011).
The goal of the present study was to quantify the relationship between clot stiffness measured with ultrasound elastography and rt-PA thrombolytic efficacy. Two distinct types of human and porcine whole blood clots were investigated. Histological evaluation was performed to characterize clot composition and structure, and compare these results to those of retrieved thrombi observed clinically (Hashimoto et al. 2016; Liebeskind et al. 2011; Marder et al. 2006). Next, an established in vitro rt-PA treatment protocol was used to assess the lytic susceptibility of the different clot types (Datta et al. 2008; Holland et al. 2008). Finally, an ultrasound elastography technique based on single-track-location shear wave elasticity imaging (STLSWEI) (McAleavey et al. 2009) was used to estimate the shear wave speed and Young’s moduli of the clots embedded in a brain-mimicking phantom.
Materials and Methods
Preparation of whole blood clots
Porcine blood clots were investigated in this study because pigs have been commonly used in preclinical investigations of acute ischemic stroke pathophysiology and treatment (Bacigaluppi et al. 2010; Gralla et al. 2006). Porcine whole blood clots were fabricated using a published protocol (Sutton et al. 2013). Briefly, porcine venous blood derived aseptically from donor hogs in compliance with an institutional animal care and use committee protocol was purchased from Lampire Biological Laboratories, Inc. (Pipersville, PA, USA). The porcine venous blood was anti-coagulated with a citrate–phosphate–dextrose solution, and shipped on ice overnight to the University of Cincinnati. Upon receipt, the porcine blood was placed on a laboratory stirrer for 15 min and incubated at 37 °C for 20 min while exposed to room air to equilibrate the dissolved gas content in the blood. To induce coagulation, the blood was recalcified with CaCl2 to a final concentration of 16.1 mM. During thrombus formation, calcium ions bind to negatively charged phospholipids produced by activated platelets to form complexes containing various coagulation factors (Kumar et al. 2015). Clotting of recalcified citrated blood mimics this aspect of thrombus formation. A prior study by Bowbrick et al. (2000) reported that thromboelastography measurements of recalcified citrated blood during coagulation were similar to that of fresh blood without an anticoagulant. Recalcified blood (2 mL) was pipetted into either borosilicate glass Pasteur pipettes (146 mm long, 5.8 mm inner diameter, catalog no. 13-678-20B, Fisher Scientific, Pittsburgh, PA, USA) or soda lime glass Pasteur pipettes (146 mm long, 5.8 mm inner diameter, catalog no. 7095B5X, Corning, Inc., Corning, New York, USA) that had sealed tapered ends. These two different glass types produced cylindrical clots with different degrees of retraction and structure (i.e., borosilicate glass pipettes produced highly retracted clots and soda lime glass pipettes produced mildly retracted clots (Sutton et al. 2013)). Note that Sutton et al. reported the use of flint glass Pasteur pipettes to create mildly retracted or unretracted clots. However, the manufacturer relabeled these “flint” glass pipettes as “soda lime”. The pipettes were placed vertically in a 37 °C water bath with the sealed tapered end of the pipette at the bottom. The clots were incubated for 3 h during coagulation.
Human whole blood clots were fabricated using blood from four healthy human volunteers by sterile venipuncture. Informed consent was obtained prior to obtaining blood as per the requirements of the Institutional Review Board (IRB) at the University of Cincinnati. The human blood was immediately pipetted into either the borosilicate or the soda lime glass Pasteur pipettes in 2 mL aliquots, and incubated at 37 °C for 3 h. Thereafter, the porcine and human clots were placed in a laboratory refrigerator at 4 °C for 3 d to allow for continued clot retraction (Holland et al. 2008; Shaw et al. 2006). After 3 d of retraction, the clots mimicked thrombi that were more difficult to lyse using rt-PA (Francis and Totterman 1995; Loren et al. 1989). Experimental treatments were performed between 3 to 14 d after initial clot formation. Previous studies reported by our group have shown that the lytic susceptibility of clots in response to rt-PA remained the same between 3 to 14 d (Holland et al. 2008; Shaw et al. 2006).
For subsequent experiments, each clot was removed from the glass pipette by opening the tapered end of the pipette using a glass cutter. The highly retracted clots were not attached to the wall of the borosilicate glass pipette and slid readily onto a Petri dish. The mildly retracted clots were partially attached to the wall of the soda lime glass pipette. To detach the clot from the pipette wall, a 6 in long, 22 G needle was used to score the clot perimeter gently. A 15 mm cylindrical section was cut along the length of each clot. Cutting the clots helped ensure that the volume of the cylindrical clots was consistent. Histology, rt-PA treatment, and ultrasound elasticity imaging measurements were performed on different clot samples (i.e., one measurement was performed for each clot).
Histology of blood clots and image analysis
Twelve cylindrical clots (three mildly retracted porcine clots, three highly retracted porcine clots, three mildly retracted human clots, and three highly retracted human clots) were prepared for histopathological characterization. The clots were fixed in 10% neutral buffered formalin, embedded in paraffin, and stained with hematoxylin and eosin (H&E) or Masson’s trichrome. Stained sections were visualized under bright-field microscopy and evaluated by a blinded pathologist. Histological sections were photographed at 4× and 20× magnification with n Olympus BX51 microscope, equipped with a color digital camera (Olympus DP70, 12.5-megapixel resolution; Olympus, Center Valley, PA, USA). The color in each image was adjusted by balancing the white in a region of interest on the exterior of each clot.
The digital histological images (obtained at 4× magnification) were analyzed using ImageJ (National Institutes of Health, Bethesda, MD, USA) to evaluate clot porosity, fibrin content, and erythrocyte content. To determine clot porosity, each image was stained with either H&E or Masson’s trichrome and subjected to grayscale binary thresholding using the Otsu’s method plug-in for ImageJ (Otsu 1979). Clot porosity was quantified by determining the percentage of white pixels in each histological image (Sutton et al. 2013). For the clot sections stained with Masson’s trichrome, each histological image was decomposed into Methyl Blue and Ponceau-Fuchsin-specific images (Supplemental Figure 1) (Ruifrok and Johnston 2001; Schindelin et al. 2012). Methyl Blue stains fibrin and Ponceau-Fuschin stains erythrocytes. The decomposed images were converted to binary images using Otsu’s thresholding method (Supplemental Figure 2), and the percent of pixels stained for fibrin and erythrocytes were determined. Image regions with artifacts, caused either by tissue folding or by improper paraffin embedding, were excluded manually from the analysis.
In vitro rt-PA lysis of clots
The rt-PA lytic susceptibility of whole blood clots was measured using a previously established in vitro experimental set-up (Datta et al. 2008). The experiments were conducted in a bath filled with distilled water maintained at 37 °C. The clot sample holder consisted of a latex condom (Trustex non-lubricated, non-powdered, Condom Depot Wholesale, Columbus, OH, USA) wrapped over a plastic frame. The condom was filled with 10 mL thawed, fresh frozen plasma and warmed to 37 °C in the temperature-controlled water bath for at least 20 min before use. Porcine plasma, anti-coagulated with sodium citrate, was procured from Lampire Biological Laboratories for the treatment of porcine clots. Fresh frozen human plasma, anti-coagulated citrate phosphate double dextrose, was acquired from the Hoxworth Blood Center (Cincinnati, OH, USA) for the treatment of human clots. The sample holder was mounted on a three-axis translation stage (Newport 423, Irvine, CA, USA) to allow the condom to be partially submerged in the water tank, such that the plasma level inside the condom was approximately 3 to 5 mm below the water level outside the condom. The lower portion of the sample holder formed a hemispherical region that was approximately 14 mm in diameter. Each clot was blotted and weighed prior to treatment. The clot was positioned at the condom tip and treated for 30 min with either 1) plasma alone (10 mL) or 2) plasma with rt-PA at a concentration of 3.15 μg/mL, which was within the therapeutic range measured in blood samples of patients who received intravenous administration of rt-PA (Anderson et al. 2016; Seifred et al. 1989; Tanswell et al. 1991). After the 30 min treatment, the clot was removed from the condom, blotted, and the mass of the clot was measured. The percent clot mass loss was computed as a metric of lytic efficacy (Datta et al. 2006).
Phantom characterization
The physical and acoustical properties (i.e., density, longitudinal sound speed, and acoustic attenuation) of the phantoms used in this study were determined. To measure the agar and cryogel phantom densities, the volume of each phantom was measured using a water displacement method (Nahirnyak et al. 2006), and the mass of each phantom was obtained using a scale (EK6015, Etekcity Corp., Anaheim, CA). The longitudinal sound speed of each phantom was measured using a through-transmission substitution technique (Selfridge 1985; Zell et al. 2007). The frequency-dependent attenuation spectra of the agar and cryogel phantoms were measured using a broadband through-transmission technique (Raymond et al. 2014). Three samples of each phantom type were characterized. All measurements were obtained at room temperature because subsequent ultrasound elasticity imaging of these phantoms were performed at this temperature. Note that modulus estimates of homogeneous tissues using ultrasound elastography do not vary significantly between room temperature at 25 °C and physiological temperature of 37 °C (Sapin-de Brosses et al. 2010).
Embedding blood clots in agar block phantoms
Whole blood clots (4.5 ± 1.0 mm in diameter) were embedded in agar block phantoms (Bader et al. 2016) to provide uniform means of holding the clots for ultrasound elasticity imaging and minimize surface waves at the clot boundaries, which can cause inadequate estimation of the shear wave speed (Mercado et al. 2015). Agar powder (0.5% w/v, A9539, Sigma-Aldrich, St. Louis, MO, USA) was dissolved in deionized water (46% v/v, 0.2 μm filtered, NANOPure, Barnstead International, Dubuque, IA, USA) and n-propanol (4% v/v, BP1130-500, Fisher Scientific) by heating in 30 s increments in a standard microwave oven. The agar and n-propanol solution was degassed in a heated (50 °C) ultrasonic cleaning bath (08895-02, Cole-Parmer, Vernon Hill, IL, USA) for 30 min. Evaporated milk (50% v/v, Kroger, Cincinnati, OH, USA) was filtered (pore size 100 μm), gently stirred on a hot plate, and warmed to 55 °C. Cornstarch (1% w/v, Kroger) was added to the evaporated milk as a source of acoustic scattering. The evaporated milk and agar solution were combined, mixed to produce a homogenous solution, and poured into a mold (50 mm × 50 mm × 50 mm) until the solution filled half of the mold volume, and allowed to solidify at 5 °C for 20 min. A blood clot was placed on the solidified agar bottom layer. The remaining agar solution was cooled to 39 °C, poured over the clot until the mold was filled, and allowed to solidify at 5 °C for 20 min. Each blood clot was embedded in an agar block, and ultrasound elasticity imaging was performed (n = 5 samples per clot type). This block phantom configuration with a cylindrical inclusion was similar to that reported previously (Henni et al., 2008; Bhatt et al., 2018).
Ultrasound elasticity imaging
A Verasonics Vantage 256 scanner (Verasonics, Kirkland, WA, USA), equipped with an L7-4 linear array transducer (5.2 MHz center frequency, Philips, Bothel, WA, USA), was programmed to implement single-track-location shear wave elasticity imaging (STL-SWEI) (McAleavey et al. 2009). Measurements obtained using the STL-SWEI algorithm were validated using a two-step approach. First, a calibrated Zerdine phantom (Model 049A, CIRS, Norfolk, VA, USA) with a nominal background Young’s modulus of 27 kPa was imaged. The measured moduli of Zerdine phantoms using ultrasound elastography have been reported to differ from the nominal values provided by the manufacturer (Hollender et al. 2015). Therefore, measurements of the shear wave speed of the phantom background, taken with the Verasonics scanner, were also compared with measurements obtained using two commercial ultrasound systems, a Siemens Acuson S3000 scanner equipped with a 9L4 linear array (Siemens Healthcare Point of Care Diagnostics, Norwood, MA, USA) and a Canon Aplio 500 scanner equipped with a 6C1 array (Canon Medical Systems USA, Inc., Tustin, CA, USA) (n = 3 measurements for each imaging system).
A second validation experiment was performed to determine whether measurement of the clot shear wave speed could be influenced by the presence of a Stoneley wave. Such interface waves are generated as a result of diffraction at the boundary between tissues of different stiffness (Langdon et al. 2016). To assess the influence of a Stoneley wave, elasticity imaging was performed with a tissue-mimicking cryogel phantom with similar dimensions as the clots. This phantom was composed of 8% (w/v) polyvinyl alcohol (PVA, Elvanol™ 71-30, Kuraray America, Inc., Fort Mill, SC, USA), 2% (w/v) silicon carbide (SiC, fine, 320 Grit, Alfa Aeser, Haverhill, MA, USA), 20% (v/v) ethylene glycol-based coolant (Radnor®, Airgas, Cincinnati, OH, USA), and distilled water (Hansen et al. 2014; Huntzicker et al. 2014). The phantom underwent one 24 h freeze-thaw cycle. The phantom was embedded in an agar block in the same manner as the clots. To obtain the shear wave speed in the phantom without the confounding effects due to the geometry of the phantom, a larger cryogel block phantom (50 mm × 50 mm × 50 mm) was created using the same phantom fabrication protocol and imaged using STL-SWEI (n = 3 measurements per phantom). The shear wave speed in the larger block phantom was considered the “ground truth” for the smaller cylindrical phantom.
In preparation for STL-SWEI, each agar block, containing a cryogel phantom or a clot, was submerged in a degassed water tank at room temperature (Fig. 1(A)). Acoustic absorbers (Aptflex F28, Precision Acoustics, Dorchester, UK) were placed below the agar block to minimize acoustic reflections from the tank wall. The linear array transducer was mounted on a 3-axis translational stage (Newport 423) and placed in contact with the top surface of the agar block. The transducer was placed such that the cryogel phantom or the clot was situated at a focal depth of 15 mm and the imaging plane was located along the cross-section and longitudinal axis of the cryogel phantom or the clot.
Figure 1.
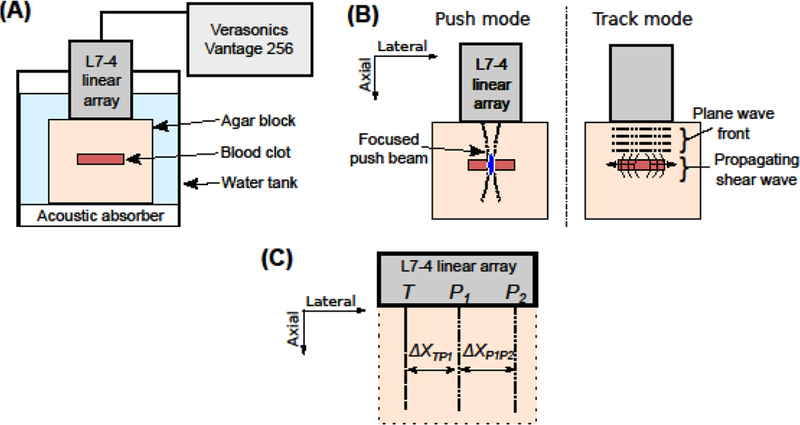
(A) Schematic of the experimental set-up for ultrasound elasticity imaging. The clot-embedded agar block was submerged in a tank filled with degassed water. The Verasonics system, equipped with an L7-4 linear array, was used to conduct ultrasound elasticity imaging of the clot. (B) Schematic of the imaging sequence. During the push mode, a focused ultrasound beam was used to generate an acoustic radiation force. During the track mode, the resulting shear waves were monitored using ultrafast plane wave imaging. This imaging sequence was repeated for multiple push locations in the agar block, which were separated 0.3 mm apart. (C) Schematic of the track location, T, relative to the push locations, P1 and P2, in the STL-SWEI algorithm. ΔXTP1 was the lateral distance between T and P1. ΔXP1P2 was the lateral distance between P1 and P2.
The STL-SWEI sequence consisted of a single excitation push pulse (1000 cycles, 5.2 MHz), focused at the depth of the cryogel inclusion or the clot. The push pulse was used to generate shear waves that propagated in the lateral direction (Fig. 1(B)). The −6 dB depth of field of the push beam was 5.8 mm (Palmeri et al. 2008), which was more than the largest diameter of the phantoms or clots (i.e., approximately 3.5 mm and 5 mm, respectively). Therefore, applying a push pulse at a single focal depth was appropriate to satisfy the assumption of uniform shear wave generation within the depth of field (Palmeri et al. 2008). Shear wave propagation was tracked using ultrafast plane wave imaging (Fig. 1(B)) (Sandrin et al. 1999). Angular compounding was performed to improve the resolution of plane wave imaging (Montaldo et al. 2009) by transmitting the plane waves at three different angles of insonation (−4°, 0°, and 4°) at a frame rate of 14.4 kHz. The image data corresponding to the three plane wave angles were summed into a single image, resulting in an effective frame rate of 4.8 kHz. The in-phase/quadrature (IQ) data corresponding to each frame was reconstructed by the Verasonics system. Shear wave propagation was monitored for 6.3 ms using 30 frames. This imaging sequence was performed for 40 push locations at the same focal depth and separated by a lateral distance of 0.3 mm (1 wavelength). The entire image data acquisition took approximately 60 s for each image data set. The IQ data was exported from the Verasonics system and processed using a custom-written MATLAB R2016a program (Mathworks, Inc., Natick, MA, USA) on an iMac (Apple Inc., Cupertino, CA, USA) with a 3.3 GHz Quad-core Intel Core i7 processor, 16 GB memory, and a 512 GB solid state drive.
The axial particle displacement as a function of the tracking time (“slow time”) was estimated using a 2D Loupas autocorrelation algorithm (Loupas et al. 1995; Maksuti et al. 2016; Pinton et al. 2006). A 2D spatial median filter with a 0.6 mm × 0.6 mm kernel was applied on the displacement data to reduce image noise (Hollender et al. 2015). Cubic spline interpolation of the displacement versus slow time data was performed to increase the sampling frequency to 48 kHz (McAleavey et al. 2009; Palmeri et al. 2008; Pinton et al. 2006). The particle velocity was computed from the upsampled displacement data using a finite-difference method (McAleavey et al. 2009). The velocity data corresponding to one track location, T, and two push locations, P1 and P2, depicted in Fig. 1(C), were selected. This combination of track and push locations corresponded to one ensemble (McAleavey et al. 2009). Multiple ensembles were swept across the imaging plane, encompassing a lateral distance of 12 mm. The lateral distances between the two push locations, ΔXP1P2, and between the track location and the neighboring push location, ΔXTP1, were adjusted based on the time taken for the peak of the shear wave to traverse across the track location (McAleavey et al. 2009), to ensure that the entire shear wave would be observed. In the current experiments, the lateral distance, ΔXP1P2, was chosen as 0.3 mm for the mildly retracted human clots and 0.6 mm for the highly retracted human clots, and highly and mildly retracted porcine clots. The lateral distance, ΔXTP1, ranged from 1 mm and 2.3 mm. For each ensemble, the difference in arrival times, ΔT, of the peaks of the shear waves (originating from each push location) at the track location was then computed. Furthermore, to suppress jitter noise, the difference in the arrival times of the shear waves at three neighboring tracking locations, separated by 0.15 mm (1/2 wavelength), were averaged for each ensemble (Hollender et al. 2015). The shear wave speed, cs, was computed as ΔXP1P2/ΔT (McAleavey et al. 2009).
The Young’s modulus was estimated under the assumptions that the shear waves propagated in a homogeneous, linearly elastic, incompressible, and isotropic medium (Maksuti et al. 2016). The Young’s modulus, E, was computed as E=3×ρ×c2s, where ρ was the density of the material (Wells and Liang 2011). The densities of the agar and cryogel phantoms are provided in Table 1. The densities of human and porcine clots were obtained from Nahirnyak et al. (2006) − 1,080 ± 20 kg/m3 and 1,060 ± 10 kg/m3, respectively. Note that the difference in densities of the two types of clots was small relative to the uncertainty of the density measurements.
Table 1:
Measured physical and acoustical properties of the phantoms used in this study. The mean andstandard deviation are reported for three samples of each phantom.
| Phantom material |
Density (kg/m3) |
Longitudinal sound speed (m/s) |
Acoustic attenuation at 5.2 MHz (dB/cm) |
|---|---|---|---|
| Agar | 1,111 ± 82 | 1536 ± 4 | 8.5 ± 0.7 |
| Cryogel | 1,064 ± 6 | 1535 ± 1 | 0.1 ± 0.1 |
Images of shear wave speed and Young’s modulus were generated for each sample. All clots were imaged between 3 to 14 d after initial clot formation, and pairs of highly retracted and mildly retracted clots were imaged on the same day. A semi-automated algorithm was implemented using MATLAB, which allowed a user to select a region of interest (ROI) in the B-mode image of each sample. Clot edges were avoided during ROI selection to avoid boundary artifacts (e.g., Stoneley waves) (Deffieux et al. 2011; Langdon 2016). The mean and standard deviation of the measured shear wave speeds for all pixels in the ROI were computed. Subsequently, the mean Young’s modulus was computed, and error propagation was implemented to compute the standard deviation in Young’s modulus estimates for all samples (Ku 1966). To assess the heterogeneity in measurements within each clot, the coefficient of variation (CV) of shear wave speeds and Young’s moduli was calculated.
Statistical Analyses
The mean and standard deviation of percent clot mass loss measurements, shear wave speed measurements, and Young’s modulus estimates for five samples for each experimental arm were computed. The normality of all replicate measurements for each experimental arm was verified using the Shapiro-Wilk test. One-way analysis of variance (ANOVA) was used to compare mass loss measurements across the different treatment arms (i.e., plasma alone and plasma with rt-PA) and degree of clot retraction (i.e., highly retracted and mildly retracted). Pairwise comparison of clot mass loss measurements was performed using the Bonferroni post hoc test. An unpaired t-test was conducted to determine whether the differences in the percentage of white, blue, and red pixels in the digital histological images, shear wave speed measurements, and Young’s modulus estimates between highly retracted and mildly retracted clots for each species were significant. Nonlinear regression analysis was performed to quantify the relationship between the average clot mass loss measurements and the average estimates of the shear wave speed for all clot types. An extra sum-of-squares F test was performed to determine the best fit to the data (linear vs. higher order polynomial). Thereafter, a p-value was calculated for the linear regression. Because shear wave speed was assumed to be proportional to the square root of the Young’s modulus, this relationship was used to fit the average clot mass loss measurements as a function of the average Young’s modulus estimates. R2 values were calculated to determine the goodness of fit to the data. Average shear wave speed and modulus values were used because the clot could not be extracted from the agar phantom after ultrasound elasticity imaging to perform a paired clot mass loss experiment. Statistical tests were performed using GraphPad Prism 7 (GraphPad Software Inc., La Jolla, CA, USA). A p-value of less than 0.05 was considered statistically significant.
Results
Histology
Bright-field microscopy analyses of the whole blood clots revealed striking differences in the porosity between mildly retracted and highly retracted clots (Figure 2). Porcine and human highly retracted clots appeared to have very densely packed erythrocytes (Fig. 2(A, C, E, G) and Supplemental Fig. 1(E, G)) with accumulations of fibrin in certain regions of the clots and along the outer rim of the clots (Fig. 2(E, G) and Supplemental Fig. 1(A, C)). Porcine and human mildly retracted clots appeared more porous (Fig. 2(B, D, F, H)). Furthermore, highly retracted human clots had interior regions that were more porous than the interior regions of highly retracted porcine clots (Fig. 2(A, C, E, G)).
Figure 2.
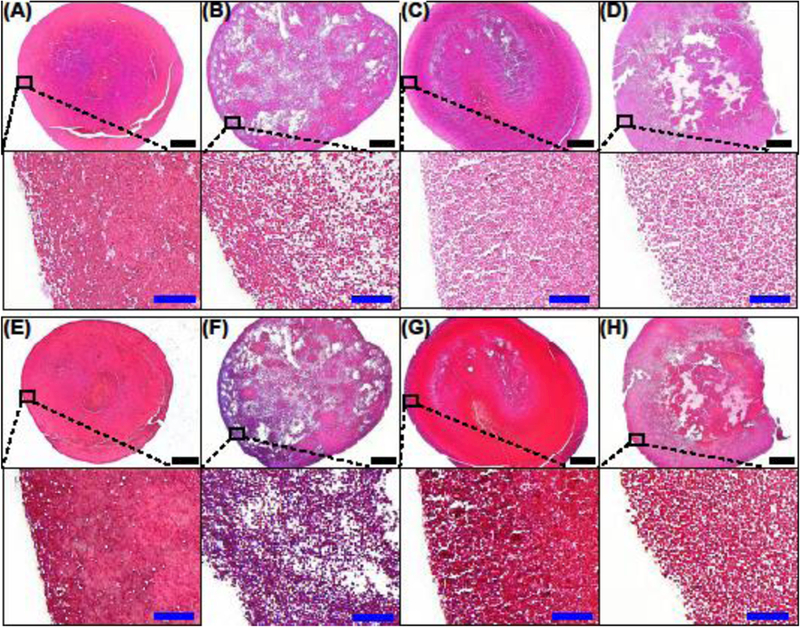
Representative images of (A, E) a highly retracted porcine clot, (B, F) a mildly retracted porcine clot, (C, G) a highly retracted human clot, and (D, H) a mildly retracted human clot stained with hematoxylin & eosin (H&E) (A-D) and Masson’s trichrome (E-H), in which Methyl Blue precipitate (fibrin) appears blue and Ponceau-Fuchsin precipitate (erythrocytes) appear red. The images in the top and bottom rows of each subfigure were obtained at 4× and 20× magnification, respectively. Black scale bar = 500 μm. Blue inset scale bar = 50 μm.
The percentage of white, red, and blue pixels in the images of clot sections was computed to evaluate clot porosity, erythrocyte content, and fibrin content, respectively (Table 2). For all clot types, the percentage of white pixels was not significantly different (p > 0.05) between H&E and Masson’s trichrome-stained sections. For porcine clots, the percentage of white pixels in images of mildly retracted clots was significantly higher than those of highly retracted clots (p < 0.001). For human clots, the difference in the percentage of white pixels between highly and mildly retracted clots was not significant for H&E-stained sections (p = 0.07), but was statistically different for those stained with Masson’s trichrome (p < 0.05).
Table 2:
Percentage of white, blue, and red pixels in digital histological images (4× magnification) for evaluating clot porosity, fibrin content, and erythrocyte content, respectively. The mean and standard deviation are reported for three images of each clot type.
| Clot type | Images stained with H&E |
Images stained with Masson’s trichrome | ||
|---|---|---|---|---|
| Percentage of white pixels |
Percentage of white pixels |
Percentage of blue pixels |
Percentage of red pixels |
|
|
Porcine, highly retracted |
2.9 ± 1.9% | 2.5 ± 1.8% | 86.2 ± 6.6% | 97.9 ± 0.9% |
| Porcine, | ||||
| mildly | 27.2 ± 3.1% | 25.8 ± 4.2% | 67.0 ± 6.5% | 68.1 ± 2.4% |
| retracted | ||||
|
Human, highly retracted |
9.6 ± 1.2% | 5.2 ± 2.9% | 67.3 ± 17.4% | 94.5 ± 3.9% |
| Human, | ||||
| mildly | 19.3 ± 6.8% | 16.0 ± 3.6% | 64.6 ± 8.0% | 82.8 ± 3.4% |
| retracted | ||||
For the porcine clots, the percentages of blue and red pixels were significantly higher for the highly retracted clots than the mildly retracted clots (p < 0.05). For the human clots, there was no significant difference in the percentage of blue pixels between the highly and mildly retracted clots (p = 0.82). On the other hand, the percentage of red pixels was significantly higher for the highly retracted clots than the mildly retracted clots (p < 0.05).
In vitro rt-PA lysis of clots
Percent clot mass loss measured for porcine and human blood clots are shown in Figure 3. For both porcine and human clots treated with plasma alone, the mass loss measurements of mildly retracted clots were significantly higher than those of highly retracted clots (p < 0.05). Highly retracted porcine clots that were subjected to the 30 min treatment with porcine plasma alone lost 4.1 ± 2.7% mass. Furthermore, these highly retracted porcine clots exhibited a significantly higher mass loss in response to treatment with rt-PA (10.9 ± 2.1%) relative to plasma alone (p < 0.05). Mildly retracted porcine clots treated with rt-PA also exhibited significantly higher clot mass loss (p < 0.01) compared to treatment with plasma alone (28.9 ± 6.1% vs. 18.8 ± 3.2%). Furthermore, mildly retracted porcine clots lysed significantly more than highly retracted porcine clots in response to rt-PA treatment (p < 0.01). Both highly and mildly retracted human clots had increased lysis after rt-PA treatment relative to human plasma alone. The clot mass loss of highly retracted human clots subjected to plasma alone and plasma with rt-PA were 7.7 ± 4.5% and 25.5 ± 10.0%, respectively. The clot mass loss of mildly retracted human clots exposed to plasma alone and rt-PA were 21.1 ± 5.3% and 45.2 ± 7.1%, respectively. Furthermore, the clot mass loss of mildly retracted human clots was significantly more than highly retracted human clots when exposed to plasma with rt-PA (p < 0.01).
Figure 3.
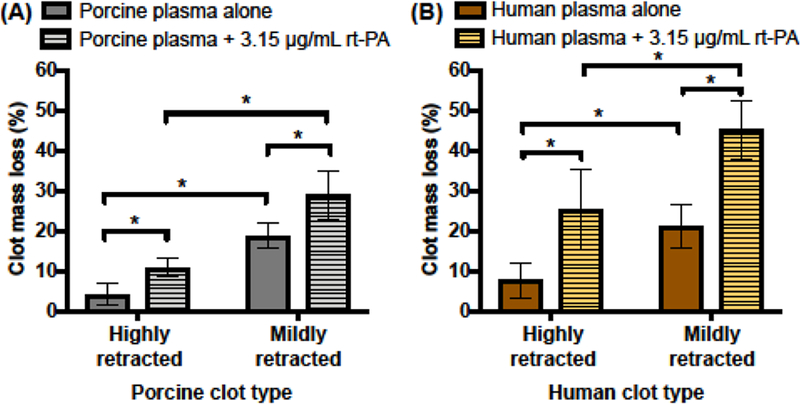
Measured clot mass loss for (A) porcine and (B) human whole blood clots. Highly retracted and mildly retracted clots were subjected to plasma alone or plasma with 3.15 μg/mL of rt-PA for 30 min. The mean and standard deviation of clot mass loss measurements are shown for five clots exposed to each treatment. Statistically significant differences in clot mass loss (p < 0.05) across clot types and treatments are denoted by (*).
Validation of ultrasound elastography algorithm
Measurements obtained by the STL-SWEI algorithm implemented on the Verasonics Vantage 256 scanner were first validated using a calibrated phantom (CIRS, Norfolk, VA, USA). According to the manufacturer’s specifications, the Young’s modulus of the phantom determined by quasi-static compression testing was 27 ± 1.4 kPa (5% error). Assuming a linearly elastic and isotropic phantom (Maksuti et al. 2016; Wells and Liang 2011) and using the phantom density of 1020 kg/m3 (provided by the manufacturer), the estimated shear wave speed was 2.97 ± 0.68 m/s. When the calibrated phantom was imaged using STL-SWEI implemented on the Verasonics system, the shear wave speed and Young’s modulus estimates were 2.56 ± 0.00 m/s and 20.06 ± 0.01 kPa, respectively. These results were consistent with subsequent measurements made using the commercial elastography software on a Siemens Acuson S3000 (shear wave speed of 2.56 ± 0.03 m/s; Young’s modulus of 20.0 ± 0.4 kPa) and Canon Aplio 500 systems (shear wave speed of 2.56 ± 0.05 m/s; Young’s modulus of 20.1 ± 0.9 kPa). Prior investigators have also reported lower modulus measurements using ultrasound elastography compared with quasi-static compression testing (Hollender et al. 2015; Oudry et al. 2014). These discrepancies are currently under investigation through the Radiological Society of North America Quantitative Imaging Biomarker Alliance (Hall et al. 2013).
To determine whether boundary interference effects (due to the relatively small size of the clots) confounded the shear wave speed estimates using the STL-SWEI algorithm, cylindrical cryogel phantoms embedded in agar blocks were imaged. Representative particle velocity images of shear wave propagation through the radial cross section and longitudinal axis of a cylindrical cryogel phantom (3.5 mm in diameter) are shown in Figures 4(A) and 4(B), respectively. Shear wave propagation through the radial cross section was not discernable due to the low particle velocity signal associated with the shear wave front (Fig. 4(A), Supplemental Video 1), which confounded measurements of the shear wave speed. Furthermore, multiple shear wave reflections along the curved interface of the cryogel phantom were observed, which made the reconstruction of shear wave speed image of the phantom challenging. In contrast, the velocity image of shear wave propagation through the longitudinal axis of the phantom showed a fully developed shear wave that could be tracked along the larger spatial dimension of the clot (Fig. 4(B), Supplemental Video 2). However, Stoneley waves were observed along the boundary between the cryogel phantom and the surrounding agar due to the difference in shear wave speeds (Langdon 2016). These Stoneley waves traveled at an intermediate speed between the shear waves propagating in the cryogel and agar. To avoid errors in shear wave speed estimates as a result of this boundary effect (Langdon 2016), a region in the B-mode image that was approximately 0.8 mm away from the phantom boundary was selected to assess the shear wave speed and Young’s modulus of the phantom (Figs. 4(C) and 4(D)). Additionally, reflections were observed in the particle velocity images as separate wavefronts that appeared following the shear waves (Supplemental Videos 2 and 3). However, these shear wave reflections were not analyzed.
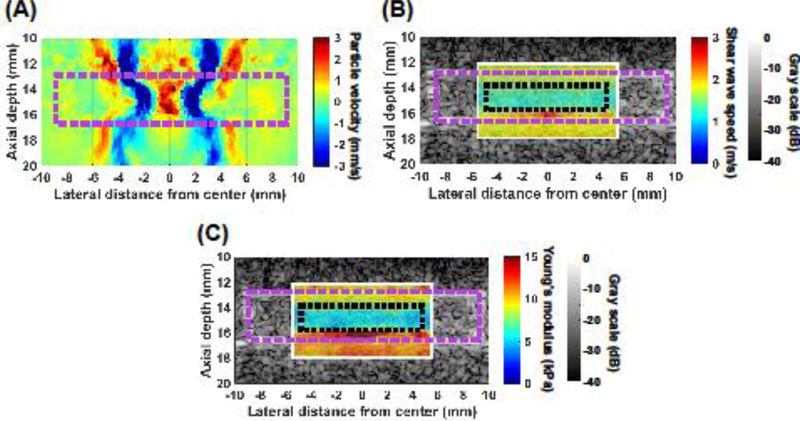
Figure 4.
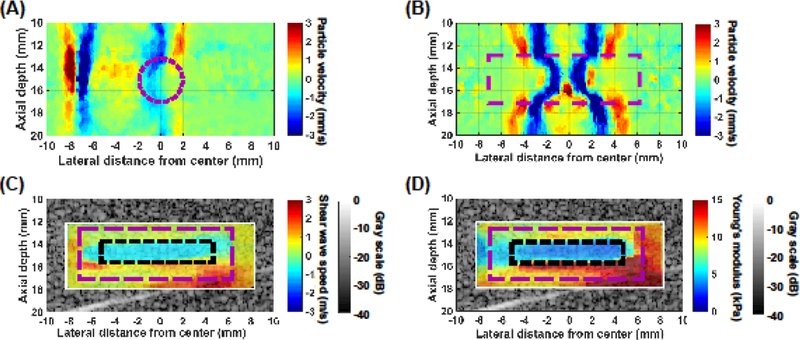
Representative particle velocity images of shear wave propagation through (A) the radial cross section and (B) the longitudinal axis of a cylindrical cryogel phantom (3.5 mm in diameter, 15 mm in length) embedded in an agar block. The magenta dashed circle in (A) and the magenta dashed rectangle in (B) represent the location of the cryogel phantom in the image. (C) Representative shear wave speed and (D) Young’s modulus images of the cryogel phantom overlaid onto a corresponding B-mode image. Imaging was performed along the longitudinal axis of the cryogel phantom. The magenta dashed rectangle and black dotted rectangle in (C, D) represent the location of the cryogel phantom and the region of interest within which the shear wave speed and Young’s modulus were estimated, respectively.
The estimated shear wave speed and Young’s modulus of the agar block without an inclusion were 2.08 ± 0.09 m/s and 14.4 ± 1.2 kPa, respectively. Note that the estimated Young’s modulus, density, longitudinal sound speed, and acoustic attenuation of the agar phantom at 5.2 MHz (Table 1) were within range of those reported for excised brain tissue (Azhari 2010; Mukherjee et al. 2006). Representative shear wave speed and Young’s modulus images along the longitudinal imaging configuration of the cylindrical cryogel phantom embedded in agar are shown in Figures 4(C) and 4(D). The mean shear wave speed and Young’s modulus of a selected ROI in the images of the small phantom were 1.05 ± 0.05 m/s and 3.53 ± 0.37 kPa, respectively, which were not statistically different from those of a larger block cryogel phantom (1.06 ± 0.01 m/s and 3.62 ± 0.07 kPa, respectively), indicating that this phantom imaging configuration provided reliable shear wave speed and Young’s modulus estimates.
Elasticity measurement of whole blood clots using STL-SWEI
A representative particle velocity image of shear wave propagation through the longitudinal axis of a highly retracted porcine blood clot is shown in Figure 5(A) and Supplemental Video 3. Shear wave propagation along the longitudinal axis of each clot appeared similar to that of the cryogel phantom (Fig. 4(B), Supplemental Video 2). For both porcine and human clots, shear wave propagation in the mildly retracted clots was slower compared to propagation in highly retracted clots. Representative images of the shear wave speed and Young’s modulus overlaid onto B-mode images of a highly retracted porcine blood clot are shown in Figures 5(B) and 5(C), respectively.
Figure 5.
(A) Representative particle velocity image of shear wave propagation through the longitudinal axis of a highly retracted porcine clot embedded in an agar block. The magenta dashed rectangle in (A) represents the location of the clot in the image. (B) Representative shear wave speed and (C) Young’s modulus images of the clot overlaid onto a corresponding B-mode image. The magenta dashed rectangle and black dotted rectangle in (B, C) represent the location of the clot and the region of interest within which the shear wave speed and Young’s modulus were estimated, respectively.
The shear wave speed and Young’s modulus estimates of the ROIs (Figs. 5(B), 5(C)) of the clots are shown in Figure 6. The measured shear wave speeds in highly retracted and mildly retracted porcine clots were 1.28 ± 0.13 m/s and 0.88 ± 0.08 m/s, respectively. The estimated Young’s moduli of highly retracted and mildly retracted porcine clots were 5.33 ± 0.92 kPa and 2.66 ± 0.55 kPa, respectively. The measured shear wave speeds in highly retracted and mildly retracted human clots were 0.93 ± 0.32 m/s and 0.48 ± 0.06 m/s, respectively. The estimated Young’s moduli of highly retracted and mildly retracted human clots were 3.21 ± 1.97 kPa and 0.79 ± 0.21 kPa, respectively. For both porcine and human clots, the highly retracted clots were significantly stiffer than the mildly retracted clots (p < 0.05). The porcine highly retracted clots were not significantly stiffer than the human highly retracted clots. However, the porcine mildly retracted clots were significantly stiffer than the human mildly retracted clots (p < 0.05). The coefficients of variation (CVs) of the estimated shear wave speed within the ROIs for mildly retracted and highly retracted porcine clots were 23.7 ± 7.7% and 11.2 ± 3.6%, respectively, which were significantly different (p < 0.05). Correspondingly, the CV in Young’s modulus estimates were 44.7 ± 12.2% and 22.2 ± 7.0%, respectively, indicating that mildly retracted porcine clots had more heterogeneous modulus estimates within the ROI (p < 0.05). For the human clots, the CVs in shear wave speed measurements for mildly retracted and highly retracted clots were 18.9 ± 5.9% and 19.9 ± 8.8%, respectively, which were not significantly different (p = 0.83). The CV in modulus estimates between mildly retracted human clots (36.8 ± 10.6%) and highly retracted human clots (37.9 ± 14.8%) were also not significantly different (p = 0.89).
Figure 6.

(A) Estimated shear wave speeds and (B) Young’s moduli of highly retracted and mildly retracted porcine clots. (C) Estimated shear wave speeds and (D) Young’s moduli of highly retracted and mildly retracted human clots. The mean and standard deviation of the shear wave speed and Young’s modulus estimates are depicted for five clots of each type. Statistically significant differences in shear wave speeds and Young’s moduli (p < 0.05) between clot types are denoted by (*).
Effect of clot stiffness on rt-PA lytic susceptibility
The percent clot mass loss after a 30 min treatment with rt-PA was plotted as a function of the estimated Young’s moduli for both porcine and human clots (Fig. 7). Clot mass loss decreased linearly with increasing shear wave speed (R2 = 0.99, p = 0.0007), irrespective of clot type (human vs. porcine) (Fig. 7A). A decreasing square root relationship (R2 = 0.99) in the clot mass loss was observed as a function of the Young’s modulus (Fig. 7B).
Figure 7.

Measured clot mass loss, CML (%), as a function of the (A) measured shear wave speeds, cs (m/s), and (B) Young’s moduli, E (kPa), of mildly retracted and highly retracted porcine and human clots. Clots underwent a 30 min treatment with 3.15 μg/mL of rt-PA. The error bars represent the standard deviation of clot mass loss measurements, shear wave speed measurements, and Young’s modulus estimates for five clots of each type. The blue dashed line in (A) is represented by the equation: CML (%) = −43.0 (%/(m/s)) × cs (m/s) + 66.0 (%), where the goodness of fit, R2, is 0.99, and p = 0.0007 for the linear regression. The green dashed line in (B) is represented by the equation: CML (%) = −43.0 (%/(m/s)) × √(E(Pa)/(3 × ρ)) + 66.0(%), where ρ is the average density of porcine and human clots (i.e., 1,070 kg/m3) and the goodness of fit, R2, is 0.99.
Discussion
The structural porosity, plasminogen content, and fibrin density and spatial distribution in clots are known to contribute to clot stiffness and rt-PA thrombolytic efficacy. In the present study, histological image analysis revealed that mildly retracted clots were more porous than highly retracted clots (Figs. 2 and 3, Table 2), which were less susceptible to rt-PA lysis (Fig. 4). These findings are in agreement with previous work reported by Sutton and colleagues (2013) for porcine clots. In a clinical study reported by Santos et al. (2016), more porous and permeable patient thrombi were found to be associated with improved responses to intra-arterial treatment, and thus, higher recanalization rates and better functional outcomes. Highly retracted porcine clots had significantly more fibrin than the mildly retracted clots (Table 2). On the other hand, there were no significant differences in the amount of fibrin between the highly and mildly retracted human clots (Table 2). The spatial distribution of fibrin in highly and mildly retracted clots varied (Fig. 2 and Supplemental Fig. 1), which could potentially affect the diffusion of rt-PA into the clots. The fibrin network shrinks during clot retraction, which increases fibrin density and reduces porosity, permeability, and plasminogen concentration in the clot interior (Blinc et al. 1994; Carr and Hardin 1987; Kirchhof et al. 2003). Mildly retracted clots were reported to lyse more effectively than highly retracted clots, regardless of the treatment approach (Blinc et al. 1991; Francis et al. 1992). The results presented in this study (Figs. 2 and 3) were consistent with these earlier findings. Porcine clots have been reported to be less susceptible to rt-PA lysis due to their lower activation of porcine plasminogen by rt-PA, along with the denser fibrin network and thinner fibrin fibers in porcine clots than those in human clots (Flight et al. 2006; Landskroner et al. 2005; Huang et al. 2017). In addition, clots with denser fibrin network and thinner fibers were found to be stiffer than those with more porous network and thicker fibrin fibers (Li et al. 2016; Wufsus et al. 2015).
The in vitro clots were formed without flow, which mimicked venous thrombus formation more closely than arterial thrombus formation. However, the composition and structure of these clots were consistent with thrombi retrieved from intracranial arteries (Hashimoto et al. 2016; Liebeskind et al. 2011; Marder et al. 2006). The amount of erythrocytes and fibrin in our clots (Table 2) was within the clinically observed range (Kim et al. 2015; Maekawa et al. 2018; Sporns et al. 2017). Some retrieved thrombi were porous and predominantly erythrocytotic, whereas other thrombi had accumulations of fibrin in certain regions within the clot and along the periphery of the clot (Hashimoto et al. 2016; Liebeskind et al. 2011; Marder et al. 2006). Thromboemboli responsible for ischemic stroke can originate from vascular sources (e.g., atherosclerotic plaques and arterial thrombosis) and cardiac sources (e.g., mural thrombosis, atrial fibrillation, patent foramen ovale, and bacterial endocarditis) (Bartels et al. 2016; Nouh et al. 2016). Prior clinical studies have focused primarily on thrombus composition rather than age (Hashimoto et al. 2016; Liebeskind et al. 2011; Marder et al. 2006), because age is difficult to gauge in vivo (Bartels et al. 2016; Nouh et al. 2016).
In clinical studies, an abundance of erythrocytes was reported to be indicative of fresh thrombi, and has been associated with high rates of recanalization in patients after IV rt-PA treatment and mechanical thrombectomy (Maekawa et al. 2018; Niesten et al. 2014; Puig et al. 2012). On the contrary, in the present study, highly retracted human and porcine clots contained a higher density of erythrocytes compared to mildly retracted clots (Table 2, Supplemental Fig. 1) and were more resistant to rt-PA lysis (Fig. 3). This paradox could be explained by the differences in clot formation mechanisms in vitro and in vivo. In the present study, highly retracted and mildly retracted clots were fabricated in vitro using blood drawn from the same donors, and thus, the same number of erythrocytes per unit volume across clot types can be assumed. The in vitro clots were also formed in stasis rather than flow. After the 3-day clot formation period, highly retracted clots contracted to a smaller volume, leading to a higher density of erythrocytes than in mildly retracted clots.
An established in vitro system was used to determine the rt-PA lytic susceptibility of the different clot types (Datta et al. 2006; Datta et al. 2008). For both clot species treated with plasma alone, the differences in the percent clot mass loss between the mildly and highly retracted clots were likely due to the differences in clot composition and structure. Furthermore, plasma was found to contain endogenous t-PA, which was likely responsible for the observed lysis (Jern et al. 1997). However, the amount of plasminogen was reported to be substantially lower in porcine clots and porcine plasma compared to human clots and human plasma, which resulted in lower porcine clot mass loss measurements (Flight et al. 2006; Huang et al. 2017, Lewis 1996). The clot mass loss of mildly retracted and highly retracted porcine clots after treatment with rt-PA was significantly higher than that obtained in the plasma alone arm (Fig. 3(A)). This result was consistent with those observed by Sutton et al. (2013). In addition, the magnitude of the porcine clot mass loss reported by Sutton et al. was approximately 2-fold higher than those determined in the present study. These differences were likely, in part, due to the presence of flow in the thrombolysis experiments performed by Sutton et al. The experiments in the current study were conducted without flow, which mimicked a fully-occluded cerebral artery (Datta et al. 2006; Datta et al. 2008).
The clot mass loss measurements of highly retracted human clots treated with rt-PA in the present study (Fig. 3(B)) were approximately 2-fold higher than those reported by Datta et al. (2008). Additionally, the shape of the clot in the present study was different from that in Datta et al. (2008). Different clot shapes would have different surface to volume ratios, which could affect the rate of rt-PA diffusion into the clot and may explain the differences in the extent of thrombolysis (Shaw et al. 2007). Although the same in vitro system was used, the highly retracted clots investigated by Datta et al. were larger than the cylindrical clots examined in the present study, and had less surface area for the rt-PA lytic front to diffuse into the clot (Shaw et al. 2007).
Boundary conditions affect stiffness measurements of relatively small imaging targets using ultrasound elasticity imaging (Xie et al. 2005). In the particle velocity images of shear wave propagation (Fig. 4(B) and 5(A)), Stoneley waves were observed at the boundary between the agar block and either the phantom or the clot due to differences in the shear wave speeds. These waves could confound modulus estimates near the interface of the two media (Langdon 2016). We circumvented the influence of this confounding boundary effect by selecting ROIs that were 0.8 mm away from the boundary between the clot and agar phantom (Fig. 4(C), 4(D), 5(B), and 5(C)). Additionally, the shear wave speed and Young’s modulus estimates within the ROI, using an imaging configuration in which the shear wave propagated along the longitudinal axis of the cylindrical cryogel phantom (Fig. 4), resulted in similar estimates to those computed for a homogeneous block phantom. Selecting regions away from the clot boundary could have excluded stiffness estimation of the outer rim of highly retracted clots that had a dense fibrin network and were likely stiffer than the clot interior (Fig. 2, Supplemental Fig. 1(A, C)) Nonetheless, the stiffness of a majority of the clot volume was estimated using ultrasound elasticity imaging.
We observed coefficients of variation (a metric of heterogeneity in clot stiffness measurements) of up to 23.7 ± 7.7% in the measured shear wave speeds and up to 44.7 12.2% in the estimated Young’s moduli within the ROI. The shear wavelength was on the same order of magnitude as the dimensions of the clot, which could limit the ability of this technique to assess heterogeneity adequately based on porosity and composition. The measured heterogeneity in shear wave speeds and Young’s moduli was likely affected by the uncertainty in the time-delay estimation algorithm used for ultrasound elasticity imaging (Walker and Trahey 1995).
Previous studies either reported the stiffness of clots based on qualitative observations (Sutton et al. 2013) or quantified stiffness using mechanical testing techniques that depended highly on the geometry of the clot (Chueh et al. 2011; Haworth et al. 2014; Machi et al. 2016). In vitro clots and retrieved thromboemboli analyzed in these prior studies were irregular in shape and needed to be trimmed to the appropriate shapes and dimensions for mechanical testing (Chueh et al. 2011; Machi et al. 2016). Furthermore, the dimensions of the clots used in these prior studies were considerably smaller than the size of tissue samples suited for standard mechanical testing systems (Xie et al. 2005). To overcome this limitation, Xie et al. (2005) developed a specialized device (MicroElastometer) to accommodate the cylindrical shape and size (4 mm in diameter, 15–20 mm in length) of rat thrombi, which were measured to have a Young’s modulus of 8.5 ± 2.7 kPa at 3 d old. In addition, Zhang et al. (2016) used the same device to measure the Young’s moduli of unretracted and retracted bovine clots, which were 2.3 ± 2.1 kPa and 11.1 ± 1.4 kPa, respectively. Furthermore, the stiffer, retracted clots were more challenging to lyse mechanically by histotripsy than the unretracted clots (Zhang et al. 2016).
Other studies have used ultrasound-based elasticity imaging techniques to measure thrombus stiffness (Liu et al. 2017; Mfoumou et al. 2014; Rubin et al. 2003). Rubin et al. (2003) used compression ultrasound elasticity imaging to measure the strain of patient venous thrombi and reported that thrombi became stiffer as they aged. Mfoumou et al. (2014) used supersonic shear wave imaging with the commercial Aixplorer ultrasound scanner (Supersonic Imagine, Aix-en-Provence, France) to image thrombi in a rabbit model of deep vein thrombosis (DVT). They reported Young’s moduli ranging from 1.0 ± 0.6 kPa for fresh thrombi to 5.3 ± 1.6 kPa for 2-hour-old thrombi to as high as 25 kPa for 2-week-old thrombi. Liu et al. (2017) also used the Aixplorer scanner to image thrombi in a rabbit model of DVT, and found an increasing trend in the Young’s moduli ranging from 1.8 to 15.9 kPa in a span of 2 weeks. Of note, thrombi in vivo continue to increase in stiffness with age due to a rise in calcium salt deposition and the replacement of platelets, fibrin, and neutrophilis in acute thrombi by collagen and mononuclear cells (Bergmeier and Hynes 2012; Henke et al. 2001; Liu et al. 2017; Rubin et al. 2003; Wakefield et al. 1999). In the present study, the estimated Young’s moduli of the mildly retracted and highly retracted porcine and human clots ranged from 0.7 to 5.9 kPa. Despite differences in clot species, age, fabrication protocols, and elasticity measurement techniques, the estimated Young’s moduli of clots investigated in the present study fell in the same order of magnitude as those reported in the aforementioned studies. Additionally, clot mass loss exhibited an inverse linear trend with shear wave speed within the range of measured data (Fig. 7A). Outside of the measured range, the linear relationship would become invalid. For example, the linear relationship would predict either a negative clot mass loss for shear wave speeds above 1.5 m/s or a negative shear wave speed for clot mass loss greater than 66%.
Study Limitations
The findings of this study should be interpreted with regard to its limitations. The clots investigated were prepared using blood from healthy human and porcine donors, which might not completely model the stiffness of thrombi that cause ischemic stroke (Shaw et al. 2006). Therefore, it is important to investigate the correlation between the stiffness and lytic susceptibility of clots in preclinical and clinical studies. The effect of recalcification during porcine blood clot formation on the rt-PA lytic susceptibility is unknown and a potential limitation of the current work. Additionally, different individual clots were used for histology, rt-PA treatment, and ultrasound elasticity imaging measurements. Performing these measurements on the same clot would be impossible because the measurement protocols involved mechanical manipulation and disruption. Clots were fixed and sectioned for histology, blotted and weighed for mass loss measurements, or embedded in a gel phantom for elasticity imaging. However, clots for each measurement were fabricated using blood derived from the same donors for these assays. Another limitation was that the findings of this study were obtained in an in vitro system that did not model physiological conditions adequately. Nonetheless, these in vitro experiments allowed elucidation of the relationship between clot stiffness and rt-PA lytic efficacy under controlled conditions.
The Young’s modulus values were computed assuming that the medium was homogeneous, linearly elastic, and isotropic. The in vitro clot model and geometry likely violated these assumptions. An improvement to the Young’s modulus estimate would be achieved by inclusion of boundary effects (e.g., Stoneley wave propagation), anisotropy, inhomogeneities, viscosity, and wave dispersion. Other investigators have explored the impact of viscoelastic models and the effect of geometry on tissue elasticity estimates. Bhatt et al. (2018) calculated the viscoelastic parameters of coagulating human blood in vitro by monitoring the mechanical resonance over a range of frequencies and fitting the response to an analytical model of constructive interference of shear wave reflections from the boundaries. The viscoelastic parameters were defined as the storage shear modulus (elasticity) and loss modulus (viscosity). In another study, Schmitt et al. (2011) estimated the viscoelasticity of porcine blood clots by generating harmonic plane shear waves over a range of frequencies and fitting the experimental data to theoretical moduli based on various rheological models. Furthermore, Huang et al. (2013) estimated the shear modulus and viscosity of porcine blood clots by monitoring the phase change of monochromatic shear waves at different tracking locations and fitting the measured shear wave speed to that based on the Voigt model. Additionally, Langdon et al. (2015) used an inverse reconstruction algorithm to fit shear wave measurements at a single tracking location to simulated shear wave profiles based on the Kelvin-Voigt model. In future studies, the storage and loss moduli of highly retracted and mildly retracted clots will be measured using viscoelastic models, such as those used in prior literature (Bhatt et al. 2018; Gennisson et al. 2006; Huang et al. 2013; Langdon et al. 2015; Maksuti et al. 2016; Schmitt et al. 2011).
To evaluate the use of elasticity imaging for assessing thrombi in ischemic stroke, ultrasound elasticity imaging would have to be performed with the thrombus inside blood vessels, such as the middle cerebral artery. If thrombi do not occlude the vessel completely, artifacts may appear in ultrasound elasticity images (Emelianov et al. 2002). Therefore, techniques to compensate for artifacts due to the presence of blood must be developed. Additionally, assessing the thrombolytic efficacy of rt-PA in stroke patients will require the use of frequencies lower than 2 MHz to enable penetration through the skull (Ammi et al. 2008). Future work will focus on developing a transcranial ultrasound elasticity imaging technique based on either passive or active methods to induce thrombus motion and measure stiffness through the skull. In a passive approach, intrinsic physiologic motion in the artery could be used to estimate clot elasticity (Zorgani et al. 2015). Alternatively, an active elastography approach using a focused push pulse with aberration correction (Aubry et al. 2003; Clement and Hynynen 2002; Marsac et al. 2012) could be employed.
Conclusions
The results of this study demonstrate a strong inverse relationship between the clot lytic susceptibility to rt-PA and the Young’s moduli of clots measured using ultrasound elasticity imaging. Mildly retracted human and porcine clots were found to have up to 20% and 18% higher mass loss than highly retracted human and porcine clots, respectively, after rt-PA treatment. Furthermore, highly retracted human and porcine clots were up to 4-fold and 2-fold stiffer than mildly retracted human and porcine clots, respectively. The findings of this study represent the first step towards the development of clot elasticity as a surrogate metric for the prediction of rt-PA lytic susceptibility of thromboemboli responsible for ischemic stroke
Supplementary Material
Acknowledgements
This research was funded in part by the National Institute of Neurological Disorders and Stroke through Grant R01 NS047603 and Diversity Supplement, and the University of Cincinnati Heart, Lung, and Vascular Institute Near Horizons Collaborative Grant. We thank Betsy A. DiPasquale and Kelley Stanley from Cincinnati Children’s Hospital Medical Center Anatomical Pathology Core for help with histological analysis. We thank Jonathan Dillman, MD from Cincinnati Children’s Hospital Medical Center Department of Radiology for assistance in measuring the elasticity of our phantom with a Siemens Acuson S3000 scanner equipped with a 9L4 linear array and a Canon Aplio 500 equipped with a 6C1 array. The authors acknowledge Prof. Antonius F. W. van der Steen, Prof. Nico de Jong, and Prof. Mark Palmeri for useful discussions. Shenwen Huang, Maegan S. Lee, and Ashley T. Lengel are acknowledged for their assistance in the initial stages of the project.
Footnotes
Publisher's Disclaimer: This is a PDF file of an unedited manuscript that has been accepted for publication. As a service to our customers we are providing this early version of the manuscript. The manuscript will undergo copyediting, typesetting, and review of the resulting proof before it is published in its final citable form. Please note that during the production process errors may be discovered which could affect the content, and all legal disclaimers that apply to the journal pertain.
References
- Ammi AY, Mast TD, Huang IH, Abruzzo TA, Coussios CC, Shaw GJ, Holland CK. Characterization of ultrasound propagation through ex-vivo human temporal bone. Ultrasound Med Biol 2008;34:1578–1589. [DOI] [PMC free article] [PubMed] [Google Scholar]
- Anderson CS, Robinson T, Lindley RI, Arima H, Lavados PM, Lee T-H, Broderick JP, Chen X, Chen G, Sharma VK, Kim JS, Thang NH, Cao Y, Parsons MW, Levi C, Huang Y, Olavarria VV, Demchuck AM, Bath PM, Donnan GA, Martins S, Pontes-Neto OM, Silva F, Ricci S, Roffe C, Pandian J, Billot L, Woodward M, Li Q, Wang X, Wang J, Chalmers J. Low-dose versus standard-dose intravenous alteplase in acute ischemic stroke. N Engl J Med 2016;374:2313–2323. [DOI] [PubMed] [Google Scholar]
- Aubry JF, Tanter M, Pernot M, Thomas JL, Fink M. Experimental demonstration of noninvasive transskull adaptive focusing based on prior computed tomography scans. J Acoust Soc Am 2003;113:84–93. [DOI] [PubMed] [Google Scholar]
- Azhari H Appendix A: Typical Acoustic Properties of Tissues Basics Biomed Ultrasound Eng John Wiley & Sons, Ltd, 2010. pp. 313–314. [Google Scholar]
- Bader KB, Crowe MJ, Raymond JL, Holland CK. Effect of frequency-dependent attenuation on predicted histotripsy waveforms in tissue-mimicking phantoms. Ultrasound Med Biol 2016;42:1701–1705. [DOI] [PMC free article] [PubMed] [Google Scholar]
- Bacigaluppi M, Comi G, Hermann DM. Animal Models of Ischemic Stroke. Part Two: Modeling Cerebral Ischemia. Open Neurol J 2010;4:34–38. [DOI] [PMC free article] [PubMed] [Google Scholar]
- Bartels M, Duffy C, Edgar Beland H. Pathophysiology, medical management, and acute rehabilitation of stroke survivors In: Gillen G, ed. Stroke rehabilitation: a function-based approach. St. Louis, MO: Mosby, Inc., 2016. pp. 2–45. [Google Scholar]
- Benjamin EJ, Virani SS, Callaway CW, Chang AR, Cheng S, Chiuve SE, Cushman M, Delling FN, Deo R, de Ferranti SD, Ferguson JF, Fornage M, Gillespie C, Isasi CR, Jiménez MC, Jordan LC, Judd SE, Lackland D, Lichtman JH, Lisabeth L, Liu S, Longenecker CT, Lutsey PL, Matchar DB, Matsushita K, Mussolino ME, Nasir K, O’Flaherty M, Palaniappan LP, Pandey DK, Reeves MJ, Ritchey M, Rodriguez CJ, Roth GA, Rosamond WD, Sampson UKA, Satou GM, Shah SH, Spartano NL, Tsao CW, Voeks JH, Willey JZ, Wilkins JT, Wu JH, Alger HM, Wong SS, Muntner P. Heart Disease and Stroke Statistics–2018 Update: A Report From the American Heart Association. Circulation 2018;137:e1–e442. [DOI] [PubMed] [Google Scholar]
- Bergmeier W, Hynes RO. Extracellular matrix proteins in hemostasis and thrombosis. Cold Spring Harb Perspect Biol 2012;4:a005132. [DOI] [PMC free article] [PubMed] [Google Scholar]
- Bernal M, Gennisson JL, Flaud P, Tanter M. Correlation between classical rheometry and supersonic shear wave imaging in blood clots. Ultrasound Med Biol, 2013;39:2123–2136. [DOI] [PubMed] [Google Scholar]
- Bhatt M, Montagnon E, Destrempes F, Chayer B, Kazemirad S, Cloutier G. Acoustic radiation force induced resonance elastography of coagulating blood: theoretical viscoelasticity modeling and ex-vivo experimentation. Phys Med Biol 2018. March 6. doi: 10.1088/1361-6560/aab46a. [Epub ahead of print] [DOI] [PubMed] [Google Scholar]
- Blinc A, Kennedy SD, Bryant RG, Marder VJ, Francis CW. Flow through clots determines the rate and pattern of fibrinolysis. Thromb Haemost 1994;71:230–235. [PubMed] [Google Scholar]
- Blinc A, Planinsic G, Keber D, Jarh O, Lahajnar G, Zidansĕk A, Demsar F. Dependence of blood clot lysis on the mode of transport of urokinase into the clot- a magnetic resonance imaging study in vitro. Thromb Haemost 1991;65:549–552. [PubMed] [Google Scholar]
- Bourcier R, Volpi S, Guyomarch B, Daumas-Duport B, Lintia-Gaultier A, Papagiannaki C, Serfaty JM, Desal H. Susceptibility Vessel Sign on MRI Predicts Favorable Clinical Outcome in Patients with Anterior Circulation Acute Stroke Treated with Mechanical Thrombectomy. AJNR Am J Neuroradiol 2015;36:2346–2353. [DOI] [PMC free article] [PubMed] [Google Scholar]
- Bowbrick VA, Mikhailidis DP, Stansby G. The Use of Citrated Whole Blood in Thromboelastography. Anesth Analg 2000;90:1086–1088. [DOI] [PubMed] [Google Scholar]
- Carr ME, Hardin CL. Fibrin has larger pores when formed in the presence of erythrocytes. Am J Physiol American Physiological Society 1987;253:H1069#x2013;H1073. [DOI] [PubMed] [Google Scholar]
- Clement GT and Hynynen K. A non-invasive method for focusing ultrasound through the human skull. Phys Med Biol 2002;47:1219–1236. [DOI] [PubMed] [Google Scholar]
- Chueh JY, Wakhloo AK, Hendricks GH, Silva CF, Weaver JP, Gounis MJ. Mechanical characterization of thromboemboli in acute ischemic stroke and laboratory embolus analogs. AJNR Am J Neuroradiol 2011;32:1237–1244. [DOI] [PMC free article] [PubMed] [Google Scholar]
- Ciccone A, Valvassori L, Nichelatti M, Sgoifo A, Ponzio M, Sterzi R, Boccardi E. Endovascular Treatment for Acute Ischemic Stroke. N Engl J Med 2013;368:904–913. [DOI] [PMC free article] [PubMed] [Google Scholar]
- Datta S, Coussios C, Ammi AY, Mast TD, de Courten-Myers GM, Holland CK. Ultrasound-enhanced thrombolysis using Definity® as a cavitation nucleation agent. Ultrasound Med Biol 2008;34:1421–1433. [DOI] [PMC free article] [PubMed] [Google Scholar]
- Datta S, Coussios C, McAdory LE, Tan J. Correlation of cavitation with ultrasound enhancement of thrombolysis. Ultrasound Med Biol 2006;32:1257–1267. [DOI] [PMC free article] [PubMed] [Google Scholar]
- Davalos A, Pereira VM, Chapot R, Bonafe A, Andersson T, Gralla J, Solitaire Group. Retrospective multicenter study of Solitaire FR for revascularization in the treatment of acute ischemic stroke. Stroke 2012;43:2699–2705. [DOI] [PubMed] [Google Scholar]
- Deffieux T, Gennisson J-L, Bercoff J, Tanter M. On the effects of reflected waves in transient shear wave elastography. IEEE Trans Ultrason Ferroelectr Freq Control. 2011;58:2032–2035. [DOI] [PubMed] [Google Scholar]
- Desilles JP, Loyau S, Syvannarath V, Gonzalez-Valcarcel J, Cantier M, Louedec L, Lapergue B, Amarenco P, Ajzenberg N, Jandrot-Perrus M, Michel JB, Ho-Tin-Noe B, Mazighi M. Alteplase Reduces Downstream Microvascular Thrombosis and Improves the Benefit of Large Artery Recanalization in Stroke. Stroke 2015;46:3241–3248. [DOI] [PubMed] [Google Scholar]
- Emelianov S, Chen X, O’Donnell M, Knipp B, Myers D, Wakefield TW, Rubin JM. Triplex ultrasound: Elasticity imaging to age deep venous thrombosis. Ultrasound Med Biol 2002;28:757–767. [DOI] [PubMed] [Google Scholar]
- Flight SM, Masci PP, Lavin MF, Gaffney PJ. Resistance of porcine blood clots to lysis relates to poor activation of porcine plasminogen by tissue plasminogen activator. Blood Coagul Fibrinolysis 2006;17:417–420. [DOI] [PubMed] [Google Scholar]
- Francis CW, Onundarson PT, Carstensen EL, Blinc A, Meltzer RS, Schwarz K, Marder VJ. Enhancement of fibrinolysis in vitro by ultrasound. J Clin Invest 1992;90:2063–2068. [DOI] [PMC free article] [PubMed] [Google Scholar]
- Francis CW, Totterman S. Magnetic resonance imaging of deep vein thombi correlates with response to thrombolytic therapy. Thromb Haemost 1995;73(3):386–391. [PubMed] [Google Scholar]
- Froehler MT, Tateshima S, Duckwiler G, Jahan R, Gonzalez N, Vinuela F, Liebeskind D, Saver JL, Villablanca JP, UCLA Stroke Investigators. The hyperdense vessel sign on CT predicts successful recanalization with the Merci device in acute ischemic stroke. J Neurointerv Surg 2013;5:289–293. [DOI] [PMC free article] [PubMed] [Google Scholar]
- Fry FJ, Barger JE. Acoustical properties of the human skull. J Acoust Soc Am 1978;63:1576–1590. [DOI] [PubMed] [Google Scholar]
- Gennisson JL, Lerouge S, Cloutier G. Assessment by transient elastography of the viscoelastic properties of blood during clotting. Ultrasound Med Biol 2006;32:1529–1537. [DOI] [PubMed] [Google Scholar]
- Goldstein JN, Marrero M, Masrur S, Pervez M, Barrocas AM, Abdullah A, Oleinik A, Rosand J, Smith EE, Dzik WH, Schwamm LH. Management of thrombolysis-associated symptomatic intracerebral hemorrhage. Arch Neurol 2010;67:965–969. [DOI] [PMC free article] [PubMed] [Google Scholar]
- Graham GD. Tissue plasminogen activator for acute ischemic stroke in clinical practice: A meta-analysis of safety data. Stroke 2003;34:2847–2850. [DOI] [PubMed] [Google Scholar]
- Gralla J, Schroth G, Remonda L, Fleischmann A, Fandino J, Slotboom J, Brekenfeld C. A dedicated animal model for mechanical thrombectomy in acute stroke. AJNR Am J Neuroradiol 2006;27:1357–1361. [PMC free article] [PubMed] [Google Scholar]
- Hansen HHG, Saris AECM, Vaka NR, Nillesen MM, de Korte CL. Ultrafast vascular strain compounding using plane wave transmission. J Biomech, 2014;47:815–823. [DOI] [PubMed] [Google Scholar]
- Hashimoto T, Hayakawa M, Funatsu N, Yamagami H, Satow T, Takahashi JC, Nagatsuka K, Ishibashi-Ueda H, Kira JI, Toyoda K. Histopathologic Analysis of Retrieved Thrombi Associated with Successful Reperfusion after Acute Stroke Thrombectomy. Stroke 2016;47:3035–3037. [DOI] [PubMed] [Google Scholar]
- Haworth KJ, Weidner CR, Abruzzo TA, Shearn JT, Holland CK. Mechanical properties and fibrin characteristics of endovascular coil-clot complexes: relevance to endovascular cerebral aneurysm repair paradigms. J Neurointerv Surg 2014;1–6. [DOI] [PMC free article] [PubMed] [Google Scholar]
- Henke PK, Wakefield TW, Kadell AM, Linn MJ, Varma MR, Sarkar M, Hawley A, Fowlkes JB, Strieter RM. Interleukin-8 administration enhances venous thrombosis resolution in a rat model. J Surg Res 2001;99:84–91. [DOI] [PubMed] [Google Scholar]
- Henni AH, Schmitt C, Cluotier G. Three-dimensional transient and harmonic shear-wave scattering by a soft cylinder for dynamic vascular elastography. J Acoust Soc Am, 2008;124: 2394–2405. [DOI] [PubMed] [Google Scholar]
- Holland CK, Vaidya SS, Datta S, Coussios C, Shaw GJ. Ultrasound-enhanced tissue plasminogen activator thrombolysis in an in vitro porcine clot model. Thromb Res 2008;121:663–673. [DOI] [PMC free article] [PubMed] [Google Scholar]
- Hollender PJ, Rosenzweig SJ, Nightingale KR, Trahey GE. Single- and Multiple-Track-Location Shear Wave and Acoustic Radiation Force Impulse Imaging: Matched comparison of contrast, contrast-to-noise ratio and resolution. Ultrasound Med Biol 2015;41:1043–1057. [DOI] [PMC free article] [PubMed] [Google Scholar]
- Huang C-C, Chen P-Y, Shih C-C. Estimating the viscoelastic modulus of a thrombus using an ultrasonic shear-wave approach. Med Phys 2013;40:42901–2781. [DOI] [PubMed] [Google Scholar]
- Huang S, Shekhar H, Holland CK. Comparative lytic efficacy of rt-PA and ultrasound in porcine versus human clots. PLoS One 2017;12:1–20. [DOI] [PMC free article] [PubMed] [Google Scholar]
- Huntzicker S, Nayak R, Doyley MM. Quantitative sparse array vascular elastography: the impact of tissue attenuation and modulus contrast on performance. J Med Imaging International Society for Optics and Photonics, 2014;1:027001. [DOI] [PMC free article] [PubMed] [Google Scholar]
- Jagani M, Kallmes DF, Brinjikji W. Correlation between clot density and recanalization success or stroke etiology in acute ischemic stroke patients. Interv Neuroradiol. 2017;23:274–278. [DOI] [PMC free article] [PubMed] [Google Scholar]
- Jern C, Seeman-Lodding H, Biber B, Winso O, Jern S. An experimental multiple-organ model for the study of regional net release/uptake rates of tissue-type plasminogen activator in the intact pig. Thromb Haemost 1997;78:1150–1156. [PubMed] [Google Scholar]
- Jovin TG, Chamorro A, Cobo E, de Miquel MA, Molina CA, Rovira A, San Román L, Serena J, Abilleira S, Ribó M, Millán M, Urra X, Cardona P, López-Cancio E, Tomasello A, Castaño C, Blasco J, Aja L, Dorado L, Quesada H, Rubiera M, Hernandez-Pérez M, Goyal M, Demchuk AM, von Kummer R, Gallofré M, Dávalos A. Thrombectomy within 8 Hours after Symptom Onset in Ischemic Stroke. N Engl J Med 2015;372:2296–2306. [DOI] [PubMed] [Google Scholar]
- Kang DW, Jeong HG, Kim DY, Yang W, Lee SH. Prediction of Stroke Subtype and Recanalization Using Susceptibility Vessel Sign on Susceptibility-Weighted Magnetic Resonance Imaging. Stroke 2017;48:1554–1559. [DOI] [PMC free article] [PubMed] [Google Scholar]
- Kim EY, Heo JH, Lee S-K, Kim DJ, Suh S-H, Kim J, Kim DI. Prediction of thrombolytic efficacy in acute ischemic stroke using thin-section noncontrast CT. Neurology 2006;67:1846–1848. [DOI] [PubMed] [Google Scholar]
- Kim SK, Yoon W, Kim TS, Heo TW, Park MS. Histologic analysis of retrieved clots in acute ischemic stroke: Correlation with stroke etiology and gradient-echo MRI. AJNR Am J Neuroradiol 2015;36:1756–1762. [DOI] [PMC free article] [PubMed] [Google Scholar]
- Kirchhof K, Welzel T, Mecke C, Zoubaa S, Sartor K. Differentiation of White, Mixed, and Red Thrombi: Value of CT in Estimation of the Prognosis of Thrombolysis-Phantom Study 1. Radiology 2003;228:126–130. [DOI] [PubMed] [Google Scholar]
- Ku H Notes on the use of propagation of error formulas. J Res Natl Bur Stand Sec C 1966; 70C:263–273. [Google Scholar]
- Kumar V, Abbas AK, Fausto N, Aster JC. Robbins and Cotran Pathologic Basis of Disease. Ninth edition Philadelphia, PA: Elsevier/Saunders, 2015. [Google Scholar]
- Landskroner K, Olson N, Jesmok G. Cross-species pharmacologic evaluation of plasmin as a direct-acting thrombolytic agent: Ex vivo evaluation for large animal model development. J Vasc Interv Radiol 2005;16:369–377. [DOI] [PubMed] [Google Scholar]
- Langdon JH. Development of single track location shear wave viscoelasticity imaging for real-time characterization of biological tissues PhD dissertation. University of Rochester, 2016. [Google Scholar]
- Langdon JH, Elegbe E, McAleavey SA. Single tracking location acoustic radiation force impulse viscoelasticity estimation (STL-VE): a method for measuring tissue viscoelastic parameters. IEEE Trans Ultrason Ferroelectr Freq Control 2015;62:1225–1244. [DOI] [PMC free article] [PubMed] [Google Scholar]
- Lewis JH. Comparative Hemostasis in Vertebrates. New York, NY: Plenum Press, 1996. [Google Scholar]
- Li W, Sigley J, Pieters M, Helms CC, Nagaswami C, Weisel JW, Guthold M. Fibrin fiber stiffness is strongly affected by fiber diameter, but not by fibrinogen glycation. Biophys J 2016;110:1400–1410. [DOI] [PMC free article] [PubMed] [Google Scholar]
- Liebeskind DS, Sanossian N, Yong WH, Starkman S, Tsang MP, Moya AL, Zheng DD, Abolian AM, Kim D, Ali LK, Shah SH, Towfighi A, Ovbiagele B, Kidwell CS, Tateshima S, Jahan R, Duckwiler GR, Viñuela F, Salamon N, Villablanca JP, Vinters HV, Marder VJ, Saver JL. CT and MRI early vessel signs reflect clot composition in acute stroke. Stroke 2011;42:1237–43. [DOI] [PMC free article] [PubMed] [Google Scholar]
- Liu X, Li N, Wen C. Effect of pathological heterogeneity on shear wave elasticity imaging in the staging of deep vein thrombosis. PLOS One 2017;12:e0179103. [DOI] [PMC free article] [PubMed] [Google Scholar]
- Loren M, Garcia Frade LJ, Toorado MC, Navarro JL. Thrombus age and tissue plasminogen activator mediated thrombolysis in rats. Thromb Res 1989;56:67–76. [DOI] [PubMed] [Google Scholar]
- Loupas T, Powers JT, Gill RW. An Axial Velocity Estimator for Ultrasound Blood-Flow Imaging, Based on a Full Evaluation of the Doppler Equation by Means of a 2-Dimensional Autocorrelation Approach. IEEE Trans Ultrason Ferroelectr Freq Control 1995;42:672–688. [Google Scholar]
- Machi P, Jourdan F, Ambard D, Reynaud C, Lobotesis K, Sanchez M, Bonafé A, Costalat V. Experimental evaluation of stent retrievers’ mechanical properties and effectiveness. J Neurointerv Surg 2016;1–7. [DOI] [PMC free article] [PubMed] [Google Scholar]
- Maekawa K, Shibata M, Nakajima H, Mizutani A, Kitano Y, Seguchi M, Yamasaki M, Kobayashi K, Sano T, Mori G, Yabana T, Naito Y, Shimizu S, Miya F. Erythrocyte-Rich Thrombus Is Associated with Reduced Number of Maneuvers and Procedure Time in Patients with Acute Ischemic Stroke Undergoing Mechanical Thrombectomy. Cerebrovasc Dis Extra 2018;8:39–49. [DOI] [PMC free article] [PubMed] [Google Scholar]
- Maksuti E, Widman E, Larsson D, Urban MW, Larsson M, Bjällmark A. Arterial Stiffness Estimation by Shear Wave Elastography: Validation in Phantoms with Mechanical Testing. Ultrasound Med Biol 2016;42:308–321. [DOI] [PubMed] [Google Scholar]
- Marder VJ, Chute DJ, Starkman S, Abolian AM, Kidwell C, Liebeskind D, Ovbiagele B, Vinuela F, Duckwiler G, Jahan R, Vespa PM, Selco S, Rajajee V, Kim D, Sanossian N, Saver JL. Analysis of Thrombi Retrieved From Cerebral Arteries of Patients With Acute Ischemic Stroke. Stroke 2006; 37:2086–2093. [DOI] [PubMed] [Google Scholar]
- Marsac L, Chauvet D, Larrat B, Pernot M, Robert B, Fink M, Boch AL, Aubry JF, Tanter M. MR-guided adaptive focusing of therapeutic ultrasound beams in the human head. Med Phys 2012;39:1141–1149. [DOI] [PMC free article] [PubMed] [Google Scholar]
- McAleavey SA, Menon M, Elegbe E. Shear modulus imaging with spatially-modulated ultrasound radiation force. Ultrason Imaging 2009;31:217–234. [DOI] [PMC free article] [PubMed] [Google Scholar]
- Mercado KP, Langdon J, Helguera M, Mcaleavey SA, Hocking DC, Dalecki D. Scholte wave generation during single tracking location shear wave elasticity imaging of engineered tissues. J Acoust Soc Am 2015;138:EL138–EL144. [DOI] [PMC free article] [PubMed] [Google Scholar]
- Mfoumou E, Tripette J, Blostein M, Cloutier G. Time-dependent hardening of blood clots quantitatively measured in vivo with shear-wave ultrasound imaging in a rabbit model of venous thrombosis. Thromb Res 2014;133:265–271. [DOI] [PubMed] [Google Scholar]
- Mokin M, Kass-Hout T, Kass-Hout O, Dumont TM, Kan P, Snyder K V., Hopkins LN, Siddiqui AH, Levy EI. Intravenous thrombolysis and endovascular therapy for acute ischemic stroke with internal carotid artery occlusion: A systematic review of clinical outcomes. Stroke 2012;43:2362–2368. [DOI] [PubMed] [Google Scholar]
- Mokin M, Morr S, Natarajan SK, Lin N, Snyder KV, Hopkins LN, Siddiqui AH, Levy EI. Thrombus density predicts successful recanalization with Solitaire stent retriever thrombectomy in acute ischemic stroke. J Neurointerv Surg 2015;7:104–107. [DOI] [PubMed] [Google Scholar]
- Moftakhar P, English JD, Cooke DL, Kim WT, Stout C, Smith WS, Dowd CF, Higashida RT, Halbach VV, Hetts SW. Density of thrombus on admission CT predicts revascularization efficacy in large vessel occlusion acute ischemic stroke. Stroke 2013;44:243–245. [DOI] [PubMed] [Google Scholar]
- Montaldo G, Tanter M, Bercoff J, Benech N, Fink M. Coherent Plane Wave Compounding for Very High Frame Rate Ultrasonography and Transient Elastography. IEEE Trans Ultrason Ferroelectr Freq Control 2009;56:489–506. [DOI] [PubMed] [Google Scholar]
- Mukherjee S, Chawla A, Karthikeyan B. A review of the mechanical properties of human body soft tissues in the head, neck and spine. Inst Eng J 2006;87:10–24. [Google Scholar]
- Nahirnyak VM, Yoon SW, Holland CK. Acousto-mechanical and thermal properties of clotted blood. J Acoust Soc Am 2006;119:3766–72. [DOI] [PMC free article] [PubMed] [Google Scholar]
- Niesten JM, van der Schaaf IC, van der Graaf Y, Kappelle LJ, Biessels GJ, Horsch AD, Dankbaar JW, Luitse MJ, van Seeters T, Smit EJ, Mali WP, Velthuis BK. Predictive value of thrombus attenuation on thin-slice non-contrast CT for persistent occlusion after intravenous thrombolysis. Cerebrovasc Dis 2014;37:116–122. [DOI] [PubMed] [Google Scholar]
- Nouh A, Hussain M, Mehta T, and Yaghi S. Embolic strokes of unknown source and cryptogenic stroke: Implications in clinical practice. Front Neurol 2016; 7:1–16. [DOI] [PMC free article] [PubMed] [Google Scholar]
- Otsu N A threshold selection method from gray-level histograms. IEEE Trans Syst Man Cybern B Cybern 1979;9:62–66. [Google Scholar]
- Palmeri ML, Wang MH, Dahl JJ, Frinkley KD, Nightingale KR. Quantifying Hepatic Shear Modulus In Vivo Using Acoustic Radiation Force. Ultrasound Med Biol 2008;34:546–558. [DOI] [PMC free article] [PubMed] [Google Scholar]
- Pinton GF, Dahl JJ, Trahey GE. Rapid Tracking of Small Displacements with Ultrasound. 2006;53:1103–1117. [DOI] [PubMed] [Google Scholar]
- Powers WJ, Derdeyn CP, Biller J, Coffey CS, Hoh BL, Jauch EC, Johnston KC, Johnston SC, Khalessi AA, Kidwell CS, Meschia JF, Ovbiagele B, Yavagal DR. 2015 American Heart Association/American Stroke Association focused update of the 2013 guidelines for the early management of patients with acute ischemic stroke regarding endovascular treatment. Stroke 2015;46:3020–3035. [DOI] [PubMed] [Google Scholar]
- Puig J, Pedraza S, Demchuk A, Daunis-I-Estadella J, Termes H, Blasco G, Soria G, Boada I, Remollo S, Baños J, Serena J, Castellanos M. Quantification of thrombus hounsfield units on noncontrast CT predicts stroke subtype and early recanalization after intravenous recombinant tissue plasminogen activator. AJNR Am J Neuroradiol 2012;33:90–96. [DOI] [PMC free article] [PubMed] [Google Scholar]
- Raymond JL, Haworth KJ, Bader KB, Radhakrishnan K, Griffin JK, Huang SL, McPherson DD, Holland CK. Broadband attenuation measurements of phospholipid-shelled ultrasound contrast agents. Ultrasound Med Biol 2014;40:1–44. [DOI] [PMC free article] [PubMed] [Google Scholar]
- Rubin JM, Aglyamov SR, Wakefield TW, O’Donnell M, Emelianov SY. Clinical application of sonographic elasticity imaging for aging of deep venous thrombosis: preliminary findings. J Ultrasound Med. 2003;22:443–448. [DOI] [PubMed] [Google Scholar]
- Ruifrok AC, Johnston DA. Quantification of histochemical staining by color deconvolution. Anal Quant Cytol Histol 2001;23:291–299. [PubMed] [Google Scholar]
- Sandrin L, Catheline S, Tanter M, Hennequin X, Fink M. Time-Resolved Pulsed Elastography with Ultrafast Ultrasonic Imaging. Ultrason Imaging 1999;21:259–272. [DOI] [PubMed] [Google Scholar]
- Santos EM, Marquering HA, den Blanken MD, Berkhemer OA, Boers AM, Yoo AJ, Beenen LF, Treurniet KM, Wismans C, van Noort K, Lingsma HF, Dippel DW, van der Lugt A, van Zwam WH, Roos YB, van Oostenbrugge RJ, Niessen WJ, Majoie CB, MR CLEAN Investigators. Thrombus permeability is associated with improved functional outcome and recanalization in patients with ischemic stroke. Stroke 2016;47:732–741. [DOI] [PubMed] [Google Scholar]
- Sapin-de Brosses E, Gennisson J, Pernot M, Fink M, Tanter M. Temperature dependence of the shear modulus of soft tissues assessed by ultrasound. Phys Med Biol 2010;55:1701–1718. [DOI] [PubMed] [Google Scholar]
- Saqqur M, Uchino K, Demchuk AM, Molina CA, Garami Z, Calleja S, Akhtar N, Orouk FO, Salam A, Shuaib A, Alexandrov A V. Site of Arterial Occlusion Identified by Transcranial Doppler Predicts the Response to Intravenous Thrombolysis for Stroke. Stroke 2007;38:948–954. [DOI] [PubMed] [Google Scholar]
- Saver JL, Goyal M, Bonafe A, Diener H-C, Levy EI, Pereira VM, Albers GW, Cognard C, Cohen DJ, Hacke W, Jansen O, Jovin TG, Mattle HP, Nogueira RG, Siddiqui AH, Yavagal DR, Baxter BW, Devlin TG, Lopes DK, Reddy VK, du Mesnil de Rochemont R, Singer OC, Jahan R. Stent-Retriever Thrombectomy after Intravenous t-PA vs. t-PA Alone in Stroke. N Engl J Med 2015;372:2285–2295. [DOI] [PubMed] [Google Scholar]
- Schindelin J, Arganda-Carreras I, Frise E, Kaynig V, Longair M, Pietzsch T, Preibisch S, Rueden C, Saalfeld S, Schmid B, Tinevez JY, White DJ, Hartenstein V, Eliceiri K, Tomancak P, Cardona A. Fiji: an open-source platform for biological-image analysis. Nat Methods. 2012;9:676–82. [DOI] [PMC free article] [PubMed] [Google Scholar]
- Schmitt C, Hadj Henni A, Cloutier G. Characterization of blood clot viscoelasticity by dynamic ultrasound elastography and modeling of the rheological behavior. J Biomech 2011;44:622–629. [DOI] [PubMed] [Google Scholar]
- Seifred E, Tanswell P, Ellbruck D, Haerer W, Schmidt A. Pharmacokinetics and haemostatic status during consecutive infusions of recombinant tissue-type plasminogen activator in patients with acute myocardial infarction. Thromb Haemost 1989;61:497–501. [PubMed] [Google Scholar]
- Selfridge AR. Approximate material properties in isotropic materials. IEEE Trans Ultrason Ferroelectr Freq Control 1985; 32:381–394. [Google Scholar]
- Shaw GJ, Bavani N, Dhamija A, Lindsell CJ. Effect of mild hypothermia on the thrombolytic efficacy of 120 kHz ultrasound enhanced thrombolysis in an in-vitro human clot model. Thromb Res 2006;117:603–608. [DOI] [PubMed] [Google Scholar]
- Shaw GJ, Dhamija A, Bavani N, Wagner KR, Holland CK. Arrhenius temperature dependence of in vitro tissue plasminogen activator thrombolysis. Phys Med Biol 2007;52:2953–2967. [DOI] [PMC free article] [PubMed] [Google Scholar]
- Sporns PB, Hanning U, Schwindt W, Velasco A, Minnerup J, Zoubi T, Heindel W, Jeibmann A, Niederstadt TU. Ischemic Stroke: What Does the Histological Composition Tell Us about the Origin of the Thrombus? Stroke 2017;48:2206–2210. [DOI] [PubMed] [Google Scholar]
- Sutton JT, Ivancevich NM, Perrin SR, Vela DC, Holland CK, Perrin SR Jr, Vela DC, Holland CK. Clot retraction affects the extent of ultrasound-enhanced thrombolysis in an ex vivo porcine thrombosis model. Ultrasound Med Biol 2013;39:813–824. [DOI] [PMC free article] [PubMed] [Google Scholar]
- Tanswell P, Seifried E, Stang E, Krause J. Pharmacokinetics and hepatic catabolism of tissue-type plasminogen activator. Arzneimittelforschung 1991;41:1310–1319. [PubMed] [Google Scholar]
- The NINDS t-PA Stroke Study Group. Intracerebral hemorrhage after intravenous t-PA therapy for ischemic stroke. The NINDS t-PA Stroke Study Group. Stroke 1997;28:2109–18. [DOI] [PubMed] [Google Scholar]
- Walker W, Trahey G. A fundamental limit on delay estimation using partially correlated speckle signals. IEEE Trans Ultrason Ferroelectr Freq Control 1995;42:301–308. [Google Scholar]
- Wakefield TW, Linn MJ, Henke PK, Kadell AM, Wilke CA, Wrobleski SK, Sarkar M, Burdick MD, Myers DD, Strieter RM. Neovascularization during venous thrombosis organization: a preliminary study. J Vasc Surg 1999;30:885–892. [DOI] [PubMed] [Google Scholar]
- Wells PNT, Liang HD. Medical ultrasound: imaging of soft tissue strain and elasticity. J R Soc Interface 2011;8:1521–1549. [DOI] [PMC free article] [PubMed] [Google Scholar]
- Wufsus AR, Rana K, Brown A, Dorgan JR, Liberatore MW, Neeves KB. Elastic behavior and platelet retraction in low- and high-density fibrin gels. Biophys J 2015;108:173–183. [DOI] [PMC free article] [PubMed] [Google Scholar]
- Xie H, Kim K, Aglyamov SR, Emelianov SY, Chen X, O’Donnell M, Weitzel WF, Wrobleski SK, Myers DD, Wakefield TW, Rubin JM. Staging deep venous thrombosis using ultrasound elasticity imaging: animal model. Ultrasound Med Biol Elsevier, 2004;30:1385–1396. [DOI] [PubMed] [Google Scholar]
- Xie H, Kim K, Aglyamov SR, Emelianov SY, O’Donnell M, Weitzel WF, Wrobleski SK, Myers DD, Wakefield TW, Rubin JM. Correspondence of ultrasound elasticity imaging to direct mechanical measurement in aging DVT in rats. Ultrasound Med Biol 2005;31:1351–1359. [DOI] [PMC free article] [PubMed] [Google Scholar]
- Yilmaz U, Roth C, Reith W, Papanagiotou P. Thrombus attenuation does not predict angiographic results of mechanical thrombectomy with stent retrievers. AJNR Am J Neuroradiol 2013;34:2184–2186. [DOI] [PMC free article] [PubMed] [Google Scholar]
- Yuki I, Kan I, Vinters H V., Kim RH, Golshan A, Vinuela FA, Sayre JW, Murayama Y, Vinuela FA. The impact of thromboemboli histology on the performance of a mechanical thrombectomy device. Am J Neuroradiol 2012;33:643–648. [DOI] [PMC free article] [PubMed] [Google Scholar]
- Zell K, Sperl JI, Vogel MW, Niessner R, Haisch C. Acoustical properties of selected tissue phantom materials for ultrasound imaging. Phys Med Biol 2007;52:N475–N484. [DOI] [PubMed] [Google Scholar]
- Zhang X, Owens GE, Cain CA, Gurm HS, Macoskey J, Xu Z. Histotripsy Thrombolysis on Retracted Clots. Ultrasound Med Biol 2016;42:1903–1918. [DOI] [PMC free article] [PubMed] [Google Scholar]
- Zorgani A, Souchon R, Dinh AH, Chapelon JH, Ménager JM, Lounis S, Rouvière O, Catheline S. Brain palpation from physiological vibrations using MRI. Proc Natl Acad Sci 2015; 112:12917–12921. [DOI] [PMC free article] [PubMed] [Google Scholar]
Associated Data
This section collects any data citations, data availability statements, or supplementary materials included in this article.