

Abstract

Real-time PCR is a highly sensitive and powerful technology for the quantification of DNA and has become the method of choice in microbiology, bioengineering, and molecular biology. Currently, the analysis of real-time PCR data is hampered by only considering a single feature of the amplification profile to generate a standard curve. The current “gold standard” is the cycle-threshold (Ct) method which is known to provide poor quantification under inconsistent reaction efficiencies. Multiple single-feature methods have been developed to overcome the limitations of the Ct method; however, there is an unexplored area of combining multiple features in order to benefit from their joint information. Here, we propose a novel framework that combines existing standard curve methods into a multidimensional standard curve. This is achieved by considering multiple features together such that each amplification curve is viewed as a point in a multidimensional space. Contrary to only considering a single-feature, in the multidimensional space, data points do not fall exactly on the standard curve, which enables a similarity measure between amplification curves based on distances between data points. We show that this framework expands the capabilities of standard curves in order to optimize quantification performance, provide a measure of how suitable an amplification curve is for a standard, and thus automatically detect outliers and increase the reliability of quantification. Our aim is to provide an affordable solution to enhance existing diagnostic settings through maximizing the amount of information extracted from conventional instruments.
The real-time polymerase chain reaction (qPCR) has become a routine technique in microbiology, bioengineering, and molecular biology for detecting and quantifying nucleic acids.1−3 This is predominantly due to its large dynamic range (7–8 magnitudes), desirable sensitivity (5–10 molecules per reaction), and reproducible quantification results.4−6 New methods to improve the analysis of qPCR data are invaluable to a number of application fields, including environmental monitoring and clinical diagnostics.7−10
The current “gold standard” for absolute quantification of DNA (or RNA if preceded by a reverse transcription step) using standard curves is the cycle-threshold (Ct) method.11−13 The Ct value is a feature of the amplification curve defined as the cycle number in the exponential region from which there is a detectable increase in fluorescence. However, this method is known to provide inaccurate quantification under inconsistent reaction efficiencies.14
Since the Ct method was proposed, several alternative methods have been developed to improve absolute quantification in terms of accuracy, precision, and robustness. The focus of current research is based on the computation of single features, for example, Cy0 or −log10(F0), that are linearly related to initial concentration, as in Ct.15,16 The Cy0 approach, proposed by Guescini et al., fits a sigmoid to the amplification curve and takes Cy0 as the intersection between the abscissa axis and the tangent of the inflection point.15 On the other hand, F0, proposed by Rutledge,16 fits the sigmoid up to a “cut-off cycle” and takes F0 as the fluorescence at cycle 0.16 Note that, −log10(F0) is used instead of F0 since it is linearly related to initial template concentration.
The three aforementioned features correspond to an underlying assumption, for example, the Ct approach assumes the PCR efficiency to be constant between reactions and cycles.11 The Cy0 approach allows for different efficiency between reactions but assumes a constant efficiency between cycles.15 The third feature, −log10(F0), allows for different efficiency between reactions but additionally assumes that it decreases from cycle to cycle.16 These single-feature methods provide a simple approach for absolute quantification; however, the degrees of freedom to implement more complex data analysis techniques is limited, and the use of multiple features together has been unexplored.
Inspired by the field of Machine Learning, this paper takes a multidimensional view, combining multiple features in order to take advantage of the information and principles behind all of the current standard curve methods developed. Here, we provide a novel framework that combines existing standard curve methods into a multidimensional standard curve (MSC). This is achieved by considering multiple features together such that each amplification curve is viewed as a point in a multidimensional space. Therefore, the standard curve in the multidimensional space should theoretically form a 1D line. Contrary to only considering a single-feature, in the multidimensional space, data points do not fall exactly on the standard curve and thus enables a similarity measure between amplification curves based on distances between data points.
We show that this framework expands the capabilities of standard curves in order to optimize quantification performance, provide a measure of how suitable an amplification curve is for a standard, and thus automatically detect outliers and increase the reliability of quantification. Here, outlier refers to abnormal amplification data, due to nonspecific target amplification or inconsistencies in amplification efficiency and reaction conditions (e.g., annealing temperature).
This has been demonstrated through constructing an MSC for phage lambda DNA and evaluating the quantification performance using a figure of merit combining accuracy, precision, and overall predictive power. Following this, we evaluated the framework for outlier detection using nonspecific DNA targets where we explored the notion of distance in the multidimensional space to understand if it can be used as a similarity measure between amplification curves. Finally, we used annealing temperature variation as a proxy for amplification efficiency in order to investigate whether the MSC can be used to disregard specific outliers and enhance quantification.
In Rodriguez-Manzano et al., it was shown that, using the MSC methodology described in the present manuscript, it is possible to simultaneously perform single-channel quantification and multiplexing of the four most prominent carbapenem-resistant genes.17 We hope that by sharing this framework, others will be able to adapt and build upon this work to meet their objectives and explore new capabilities enabled by MSCs.
Experimental Section
Proposed Framework
In order to understand the proposed framework, it is useful to have an overall picture of how standard curves are used for quantification. Here, two terms, namely training and testing are borrowed from Machine Learning to describe the construction of a standard curve and quantify unknown samples, respectively. Within the conventional single-feature approach, training is typically achieved through four stages: preprocessing, curve fitting, feature extraction, and line fitting (linear regression). This is illustrated in Figure 1 (top branch and solid line). Testing is accomplished by extracting the same feature as when training and using the generated standard curve to quantify the concentration in unknown samples.
Figure 1.

Block diagram showing the conventional method (top branch and solid line) compared to the proposed framework (bottom branch and dotted line) for target quantification. In both cases, raw amplification data for several known concentrations of the target are typically preprocessed and fitted with an appropriate curve. In the conventional case, a single feature such as the cycle threshold, Ct, is extracted from each curve. Subsequently, the extracted features are graphed as a function of concentration and a line is fit to the data in order to generate a standard curve and quantify unknown samples. In the proposed framework, multiple features are extracted and thus a 1D line in high dimensional space (called the feature space) is fitted in order to construct a multidimensional standard curve. Through dimensionality reduction, enhanced quantification can be achieved and performing multidimensional analysis in the feature space allows for outlier detection. The quantification can be further assisted by disregarding outliers.
The proposed framework extends the conventional approach by increasing the dimensionality of the standard curve in order to explore and take advantage of using multiple features together. This new framework is presented in Figure 1 (bottom branch and dotted line). For training, there are six stages: preprocessing, curve fitting, multifeature extraction, high dimensional line fitting, multidimensional analysis, and dimensionality reduction. Within this framework, testing can be achieved through dimensionality reduction, and multidimensional analysis using the MSC can be used to detect outliers and support quantification.
In contrast with conventional training, instead of extracting a single linear feature, multiple features are extracted from the processed amplification curves, for example, denoted using the dummy labels X, Y, and Z. Therefore, each amplification curve has been reduced to 3 values (e.g., X1, Y1, and Z1) and, consequently, can be viewed as a point in three-dimensional (3D) space. It is important to stress that any number of features could be used as long as they are linearly related to the initial target concentration. Therefore, the training data should theoretically form a one-dimensional (1D) line in 3D space. This line is approximated using high-dimensional line fitting and generates what is called the multidimensional standard curve. Although, the training data forms a line, it is important to understand that data points do not lie exactly on the line. Consequently, there is considerable room for exploring this multidimensional space, referred to as the feature space, which will be also reported in this paper.
For quantification purposes, the MSC needs to be mapped
into a
single dimension, denoted as M0, linearly
related to the initial concentration of the target. In order to distinguish
this curve from conventional standard curves, it is referred to here
as the quantification curve. This can be achieved using dimensionality
reduction techniques (DRT).18 Mathematically,
this means that DRTs are multivariate functions of the form: M0 = ϕ(X,Y,Z) where  .
In fact, given that scaling features do
not affect linearity, M0 can be mathematically
expressed as M0 = ϕ(α1X,α2Y,α3Z) where αi for i ∈ {1,2,3} are scalar constants. These
weights provide a simple method for choosing the contribution of each
individual feature in order to improve quantification. Furthermore,
regardless of the weightings, all features will be considered for
the multidimensional analysis.
.
In fact, given that scaling features do
not affect linearity, M0 can be mathematically
expressed as M0 = ϕ(α1X,α2Y,α3Z) where αi for i ∈ {1,2,3} are scalar constants. These
weights provide a simple method for choosing the contribution of each
individual feature in order to improve quantification. Furthermore,
regardless of the weightings, all features will be considered for
the multidimensional analysis.
Multidimensional Standard Curves
In this section, we provide the specific instance of framework used to construct the MSC in this study. The code is available from the authors upon request. (i) Preprocessing: the first step in data analysis is to perform background subtraction. This is accomplished by subtracting the average of the fluorescent readings in the first five cycles from every amplification curve. More advanced methods could be considered to improve performance such as the taking-difference linear regression method.19 (ii) Curve Fitting: in this study, the model used to fit the amplification curves is the 5-parameter sigmoid (Richards Curve) given by
| 1 |
where x is the cycle number, F(x) is the fluorescence at cycle x, Fb is the background fluorescence, Fmax is the maximum fluorescence, c is the fractional cycle of the inflection point, b is related to the slope of the curve, and d allows for an asymmetric shape (Richard’s coefficient). The optimization algorithm used to fit the five parameters of this model to the data is the trust-region method and is based on the interior-reflective Newton method.20,21 Here, the trust-region method is chosen over the Levenberg–Marquardt algorithm since bounds for the 5 parameters can be chosen in order to encourage a unique and realistic solution.22,23 The lower and upper bounds for the 5 parameters, [Fb, Fmax, c, b, d], are given as [−0.5, −0.5, 0, 0, 0.7] and [0.5, 0.5, 50, 100, 10], respectively. (iii) Feature Extraction: three features were used to construct the multidimensional standard curve in this study: Ct, Cy0, and −log10(F0). Therefore, each amplification curve can be represented as a point in 3D space, i.e. p = [Ct,Cy0,–log10(F0)]T where [·]T denotes the transpose operator. Note that by convention, for the formulas in this paper, vectors are denoted using bold lowercase letters.
The cycle-threshold, Ct, is computed by fitting the amplification curve with the 5-parameter sigmoid in eq 1, normalizing the fitted function F(x) with respect to Fmax, and then taking Ct as the time where F(x) exceeds 0.2 (i.e., 20% of its maximum fluorescence). The Cy0 approach also uses the 5-parameter sigmoidal curve-fitting and takes Cy0 as the intersection between the abscissa axis and the tangent of the inflection point in the fitted F(x). The third feature, −log10(F0) fits the sigmoid up to a “cut-off cycle” and takes F0 as the fluorescence at cycle 0. (iv) Line Fitting: in this work, to fit a 1D line to the training data in multidimensional space, i.e. construct the MSC, the method of least-squares is used. Or, equivalently, by using the first principal direction in principal component analysis (PCA).24,25 If sufficient data exists, other methods such as random sample consensus (RANSAC) which are robust to outliers could be used.26 (v) Similarity Measure: there are two similarity measures used in this study: Euclidean and Mahalanobis distance. The Euclidean distance between a point, p, and the MSC can be calculated by orthogonally projecting the point onto the MSC and then using simple geometry to calculate the Euclidean distance, e, given by
| 2 |
| 3 |
where Φ computes the projection of the
point  onto the multidimensional
standard curve,
the points
onto the multidimensional
standard curve,
the points  are any two distinct points that lie on
the standard curve, and |·| denotes the absolute value operator.
are any two distinct points that lie on
the standard curve, and |·| denotes the absolute value operator.
The Mahalanobis distance is defined as the distance between a point, p, and a distribution,  , in
multidimensional space.27 Similar to the
Euclidean distance, the point
is first projected onto the MSC and the following formula is applied
to compute the Mahalanobis distance, d,
, in
multidimensional space.27 Similar to the
Euclidean distance, the point
is first projected onto the MSC and the following formula is applied
to compute the Mahalanobis distance, d,
| 4 |
where p, P, q1, and q2 are given in eq 2 and Σ is the
covariance matrix of the training data used to approximate the distribution  .
.
It can be shown that if the data is approximately normally distributed then the Mahalanobis distance squared, d2, follows a χ2-distribution.28 Therefore, a χ2-distribution table can be used to translate a specific p-value into a distance threshold. For instance, for a χ2-distribution with 2 degrees of freedom, a p-value of 0.001 corresponds to a Mahalanobis distance of 3.72.
(vi) Feature Weights: as mentioned previously, in order to maximize quantification performance, different weights, α, can be assigned to each feature. This can be accomplished by minimizing an error measure on the training data, where quantities of template are known, using an optimization algorithm. The specific error measure used in this study is described in the following subsection. The optimization algorithm is the Nelder–Mead simplex algorithm with weights initialized to unity, i.e. beginning with no assumption on the quantification performance of individual features.29,30 This is a standard algorithm and only 20 iterations are used to find the weights so that there is little computational overhead. (vii) Dimensionality Reduction: in this study, every point of the MSC is mapped into an estimated concentration using principal component regression, i.e. M0 = P from eq 2. This is compared with projecting the MSC onto all three dimensions, i.e. Ct, Cy0, and −log10(F0).
Evaluating Standard Curves
In consistency with the current literature on evaluating standard curves, relative error (RE) and coefficient of variation (CV) are used to measure accuracy and precision, respectively. The CV for each concentration is calculated after normalizing the standard curves such that a fair comparison across standard curves is achieved. The formula for RE is given by
| 5 |
where i is the index of a given training point, xi is the true template concentration of the ith training data, and x̂i is the estimate of xi using the standard curve. The CV for a given concentration is computed as
| 6 |
where i is the index of a given training point and x̂j is a vector of estimated concentrations for all training points with the same concentration as xi. The sample standard deviation and sample mean are denoted by std(·) and mean(·), respectively. This paper also uses the leave-one-out cross validation (LOOCV) error as a measure for stability and overall predictive performance.24 Stability refers to the predictive performance when points are removed from the training process. The LOOCV is given as
| 7 |
where i is the index of a given training point, xi is the true concentration of the ith training data and ẑi is the estimate of xi using a standard curve generated without the ith training point. In this study, the LOOCV is specified as a percentage in order to compare across different template concentrations, as shown in eq 7.
In order for the optimization algorithm to compute α and simultaneously minimize the three aforementioned measures, it is convenient to introduce a figure of merit, Q, to capture all of the desired properties. For a given training point, the product between all three errors, Qi, can be used to heuristically measure the quantification performance. Therefore, Q can be defined as the average over all Qi, as shown in eq 8, and is the error measure that the optimization algorithm will minimize.
| 8 |
Statistical Analysis
The p-values used for assessing the significance between methods in absolute quantification were calculated using a paired, two-sided Wilcoxon signed rank test. Statistical significance was considered as *p-value < 0.05, **p-value < 0.01, ***p-value < 0.001, and ****p-value < 0.0001. Outliers using multidimensional standard curves were determined using a χ2-distribution with 2 degrees of freedom, and statistical significance was assumed for a p-value < 0.001. The Henze-Zirkler test is used to determine multivariate normality with a p-value significance level of 0.05.31
Fluorescence Data Sets
DNA targets used for qPCR experiments in this study are as follows. (i) Standard curves were constructed using synthetic double-stranded DNA (gblocks fragments genes) containing phage lambda DNA sequence (DNA concentration ranging from 102 to 108 copies per reaction). Reactions were performed at an annealing temperature of 62 °C. See Table S1 for primer/sequence information. (ii) Nonspecific outlier detection experiments were performed using synthetic double-stranded DNA carrying blaOXA–48, blaNDM, and blaKPC genes, in this work referred to as outliers 1, 2, and 3, respectively. Reactions were performed at annealing temperature of 68 °C. See Table S2–S4 for primer/sequence information. (iii) Specific outlier detection experiments were performed using synthetic double-stranded DNA containing lambda DNA sequence at 105 copies per reaction. Reactions were performed at annealing temperatures ranging from 54.0 to 73.6 °C. See Table S1 for primer and sequence information.
All oligonucleotides were synthesized by IDT (Integrated DNA Technologies, Germany) with no additional purification. The specific PCR primers for lambda phage were designed in-house using Primer3 (http://biotools.umassmed.edu/bioapps/primer3_www.cgi), whereas the primer pairs used for the outlier detection were taken from Monteiro et al.32 Real-time PCR amplifications were conducted using FastStart Essential DNA Green Master kit (Roche Diagnostics, Germany) according to manufacturer’s instructions. Each reaction consisted of 2.5 μL FastStart Essential DNA Green Master 2× concentrated, 1 μL of PCR grade water, 0.5 μL of 10× primer mixture at 5μM and 1 μL of DNA at variable amounts, in a 5 μL final reaction volume. Thermocycling was performed using a LightCycler 96 (Roche) initiated by a 10 min incubation at 95 °C, followed by 40 cycles: 95 °C for 20 s; 62 °C (for lambda), or 68 °C (for nonspecific outliers) for 45 s; and 72 °C for 30 s, with a single fluorescence reading taken at the end of each cycle. Each reaction combination was conducted in quintuplicates/octuplicates. All the runs were completed with a melting curve analysis performed at 95 °C for 10 s, 65 °C for 60 s, and 97 °C for 1 s (continuous reading from 65 to 97 °C) to confirm the specificity of amplification and lack of primer dimer. Appropriate positive and negative controls were included in each experiment.
Results and Discussion
In this study, a new framework is presented to construct multidimensional standard curves in order to (i) optimize the quantification performance; (ii) detect outliers; and (iii) provide a heuristic measure for the similarity between an amplification curve and the MSC.
Optimising Quantification Performance
Synthetic phage lambda DNA was used to construct an MSC and evaluate its quantification performance relative to single feature methods. The resulting MSC, constructed using the features Ct, Cy0, and −log10(F0), is visualized in Figure 2a. The computed features and curve-fitting parameters for each amplification curve grouped by concentration, ranging from 102 to 108 copies per reaction, is presented in Table S5. For comparison, Figure 2b shows the quantification curves for each single-feature method plus the multifeature method M0 which is obtained after dimensionality reduction through principal component regression.
Figure 2.

Evaluating quantification through the multidimensional standard curve and single-feature methods. (a) A multidimensional standard curve is constructed using Ct, Cy0, and −log10(F0) for lambda DNA with concentration values ranging from 102 to 108 (top right to bottom left). (b) The constructed standard curves using single-feature methods along with M0. (c) The average figure of merit combining accuracy, precision, and overall predictive power for all methods. A paired two-sided Wilcoxon signed rank test was performed between M0 and the other methods (*p-value < 0.05 and ****p-value < 0.0001).
The proposed framework enables the user to optimize quantification performance (through weighting each feature) in terms of a figure of merit, Q. The Q chosen in this work combines RE, CV, and LOOCV. After 20 iterations of the optimization algorithm, the weights α converged to [−0.0741,1.1185,1.6574] corresponding to Ct, Cy0, and −log10(F0), respectively. It is important to stress that although the optimization algorithm suggests different performance across the selected features, there is value in keeping all of them as it can assist outlier detection, as shown in the subsequent sections.
The average Q (±standard deviation) for M0 against the single-feature methods is visualized in Figure 2c, where for Ct, Cy0, −log10(F0), and M0 it is 4587 ± 12799, 3327 ± 10357, 13384 ± 19966, and 2547 ± 8058, respectively. Therefore, in terms of average Q, M0 enhances quantification by 17.44% (p < 0.05), 10.65% (p < 0.05), and 99.3% (p < 0.0001) compared to Ct, Cy0, and −log10(F0), respectively. A summary and breakdown of each calculated error for all methods grouped by concentration are provided in Tables S6–S9.
Outlier Detection
In this section, the concept of distance in the feature space is explored in order to demonstrate the capability of the framework for outlier detection. The term outlier refers to abnormal amplification curves with respect to the lambda DNA training data. This can be caused by nonspecific amplification or inconsistent amplification efficiencies and reaction conditions; both of which are investigated in this report.
First, three nonspecific DNA targets with respect to the phage lambda MSC, referred to as outliers 1, 2, and 3, were amplified. Subsequently, features were extracted from each amplification curve following the same procedure as the training data for the phage lambda MSC. Finally, the outliers were plotted in the feature space, as shown in Figure 3. It is visually clear that the outliers do not lie on the MSC, and therefore, this suggests that sufficient information is captured from the three features extracted from the amplification curves in order to distinguish the different targets from phage lambda DNA. Notice that without any secondary confirmation, e.g. from melting curves or agarose gels, the test data itself suggests it is not “similar” to the training data. Furthermore, it is important to note that single feature methods are unable to distinguish these outliers (e.g., a given Ct value will always fall on a conventional standard curve).
Figure 3.
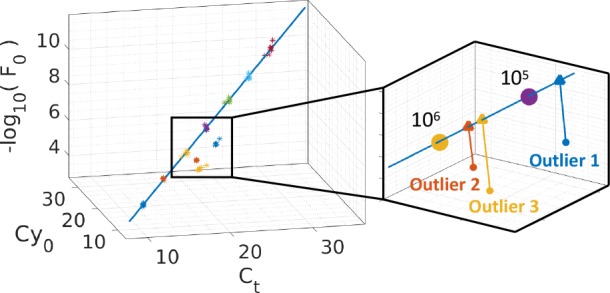
Multidimensional standard curve for lambda DNA along with three nonspecific outliers. The right panel shows a zoomed region of the feature space with the mean of the replicates and the projection of the outliers onto the standard curve. The computed features/curve-fitting parameters of the three outliers and melting curve analysis are presented in Table S10 and Figure S1–S2, respectively.
In order to fully capture the position of the outliers in the feature space, it is convenient to remove the effect of concentration and view the feature space along the axis of the multidimensional standard curve. This is achieved by projecting all the data points in the feature space onto the plane perpendicular to the standard curve as illustrated in Figure 4a. The resulting projected points are shown in Figure 4b. It is clear that all three outliers can be clustered and clearly distinguished from the training data. Furthermore, the Euclidean distance, e, from the MSC to the mean of the outliers is given by e1 = 1.44, e2 = 0.99, and e3 = 1.66. Given that the furthest training point from the MSC in terms of Euclidean distance is 0.36, the ratios between e1, e2, and e3 and the furthest training point are 4.00, 2.75, and 4.61, respectively. In other words, the mean of outlier 1 is 4 times further than the furthest training point. Therefore, this ratio can be used as a similarity measure and the three clusters could be classified as outliers using a threshold. However, this similarity measure has two limitations. (i) There is an assumption that distances in different directions are equally likely, which is intuitively untrue in the feature space because a change in one direction, e.g. Ct, does not impact the amplification curve as much as another, e.g. −log10(F0). (ii) There is no probabilistic measure that captures the distribution of the data, and therefore, the threshold for determining outliers must be chosen arbitrarily.
Figure 4.

Multidimensional analysis using the feature space for detecting nonspecific outliers. (a) MSC using Ct, Cy0, and −log10(F0) for lambda DNA along with three nonspecific outliers. An arbitrary hyperplane orthogonal to the MSC is shown in gray. (b) Euclidean space: the view of the feature space when all the data points have been projected onto the aforementioned hyperplane. The Euclidean distance between the mean of the training data and the outliers (e1, e2, and e3). (c) Mahalanobis space: a transformed space where the Euclidean distance is equivalent to the Mahalanobis distance, d, in the Euclidean space. The black circle corresponds to a p-value of 0.001 using a χ2-distribution with 2 degrees of freedom.
In order to tackle the two aforementioned limitations, the Mahalanobis distance, d, can be used. Clearly, by observing Figure 4b, the training data predominantly varies in a given direction. In order to visualize the Mahalanobis distance, the orthogonal view of the feature space (Figure 4b) can be transformed into a new space (Figure 4c) where the Euclidean distance is equivalent to the Mahalanobis distance in the original space. This is achieved by normalizing the principal components of the training data.
The Mahalanobis distance from the multidimensional standard curve to the mean of the outliers is d1 = 14.25, d2 = 13.65, and d3 = 16.93, respectively. In contrast with the Euclidean distances, it is observed that when considering the distribution of the data, the position of the outliers change. A useful property of d is that its squared value, d2, follows a χ2-distribution if the data is approximately normally distributed. The hypothesis that the data is normally distributed is confirmed using the Henze-Zirkler test with a significance level of 0.05. Therefore, the distance can be converted into a probability in order to determine if a data point is an outlier. On the basis of the χ2-distribution table with 2 degrees of freedom, any point further than 3.717 is 99.9% (p-value <0.001) likely to be an outlier. Since all the outliers have a Mahalanobis distance significantly greater than 3.717, they are confidently classified as outliers.
Aside from nonspecific DNA amplification, another cause of outliers, especially in resource-limited settings, is due to inconsistent reaction efficiency’s between the training and test data. In the following study, we use the annealing temperature as a proxy for varying the efficiency of lambda DNA amplification. Figure 5a shows the amplification curves for lambda DNA at 105 copies/reaction for temperatures ranging from 54.0 to 73.6 °C. From observing the change in Ct, it can be observed that, even though the product is specific (see Figure S3 for melting analysis), the quantification performance can be drastically affected. Current standard curve approaches have no heuristic measure to indicate whether any of these curves will be quantified poorly. However, when the data is viewed in the feature space (Figure 5b) and the Mahalanobis space (Figure 5c), it can be observed that when the amplification shape diverges from the curves belonging to the MSC (especially for low efficiencies), the Mahalanobis distance between the test data and the MSC increases. Therefore, this raises the question: can d be used to disregard specific outliers and therefore support quantification?
Figure 5.

Effect of changing annealing temperature on detecting outliers using multidimensional standard curves. (a) Fluorescent amplification curves for lambda DNA (105 copies per reaction) at temperatures ranging from 54.0–73.6 °C. (b) The MSC constructed at 62 °C using the features Ct, Cy0, and −log10(F0) along with data points obtained from the aforementioned fluorescent amplification curves. (c) The lambda standard and temperature variation data points in the Mahalanobis space. The black circle corresponds to a p-value of 0.001 using a χ2-distribution with 2 degrees of freedom.
Merging Quantification and Outlier Detection
In order to investigate the use of the MSC and Mahalanobis distance for supporting quantification, we can compare the effect of removing outliers on the estimated quantification. Figure 6a shows the average quantification as a function of the temperature for Ct, Cy0, −log10(F0), and M0 (bar plots) and visualizes the temperatures at which the amplification curves are considered as outliers (shaded in red).
Figure 6.

Merging quantification and outlier detection. (a) Average estimated quantification for lambda DNA at 105 copies per reaction for annealing temperatures ranging from 54.0–73.6 °C using Ct, Cy0, −log10(F0), and M0. The shaded region indicate outliers according to the MSC with p-value < 0.001 based on a χ2-distribution with 2 degrees of freedom. Details for the quantification and outlier detection are provided in Tables S11 and S12. (b) Average relative error for estimated quantification of lambda DNA at 105 copies/reaction across all annealing temperatures for every method. The solid bars represent the average relative error for all data points (including outliers and inliers), whereas the dashed bars only consider inliers. A paired two-sided Wilcoxon signed rank test was performed between M0 and the other methods with a confirmed significance (p-value < 0.0001).
There are two key observations that can be made: (i) the quantification performance begins to deteriorate at temperatures above 65.2 °C for all methods; (ii) amplification curves at temperatures above 65.2 °C are considered as outliers based on a χ2-distribution with p < 0.001. These two observations coincide and, therefore, support the claim that the selected features extracted from the amplification curves contain sufficient information to disregard outliers and improve quantification performance. Figure 6b shows the average relative error in estimated quantification for all the considered methods when using all data points and also disregarding outliers. It can be observed that quantification is improved by 59.9%, 53.9%, 93.9%, and 44.6% for Ct, Cy0, −log10(F0), and M0, respectively. Notice that the benefits of multidimensional analysis using all of the features extends to enhancing quantification performance of any method, including single-feature methods.
Conclusion
Absolute quantification of nucleic acids in real-time PCR using standard curves is exceedingly important in several fields of biomedicine, although research in these fields has saturated in recent years. This is partially due to the simplicity of standard curves and the movement of research toward digital PCR (dPCR) because of the advantages it holds over qPCR, such as removing the need for a standard curves. However, dPCR is currently not suitable for many applications given the cost and complexity of instruments.33−35 This paper presents a framework that shows that the benefits of standard curves extend beyond absolute quantification when observed in a multidimensional environment. Consequently, this work opens the possibility for researchers from different fields to explore mathematical methods and applications that are enabled by the proposed framework.
The focus of current researchers is on the computation of a single value, referred to here as a feature, that is linearly related to template concentration. Therefore, there has been a gap in the literature in taking advantage of multiple features together. The potential reason for a lack of research in this area is because of the nontrivial benefits of combining linear features. The only intuitive interpretation of using several features is in the reliability of quantification. For example, instead of trusting a single feature, e.g., Ct, other features such as Cy0 and −log10(F0) can be used to check if the quantification result is similar. This unidimensional way of thinking prevents several degrees of freedom and advantages that our proposed framework enables.
Three main capabilities are enabled by the framework proposed in this paper: (i) to optimize quantification performance based on a figure of merit; (ii) to detect outliers; and (iii) to measure how suitable an amplification curve is for the constructed MSC. The first capability provides a lower bound on the quantification performance of the framework to single best feature since this is a special case (e.g., M0 = Ct when when α1 = 1, α2 = 0, and α3 = 0). The second and third capabilities are an application of the MSC that was enabled through exploring the information gain captured by the elements of the feature space (e.g., Mahalanobis distance), which are typically meaningless or not considered in the unidimensional approach. In fact, applications of the MSC have already been developed. For example, in Rodriguez-Manzano et al., it was shown that multiple MSCs can be constructed in a shared feature space in order to simultaneously enhance quantification and multiplex 4 targets.17
The multidimensional approach is not completely unfamiliar in absolute quantification. The shape based outlier detection (SOD) takes a multidimensional approach in order to define a similarity measure between amplification curves.36 However, there are two fundamental differences with the work of this paper. The first is that SOD relies on using a specific model for amplification, namely the 5-parameter sigmoid, and is therefore not a general framework. The second difference is that the pattern between the features in SOD and initial target concentration is unknown, therefore the SOD cannot be naturally integrated into the quantification process and is typically used as an add-on.37 In other words, the multidimensional approach is only considered for outlier detection and quantification is still considered as unidimensional.
The contribution of this work can be accredited to the framework as a whole and the feature space which incorporates the multidimensional standard curve. Currently, the framework is limited to considering features that are linearly related to initial target concentration. This limitation is in fact a design choice given that there is a lack of other types of features available in the literature with nonlinear relationships and in order to reduce the complexity of the analysis. The second limitation is related to the feature space. The question arises as to whether sufficient information is captured between amplification curves in order to distinguish them in the feature space. For example, if two unrelated PCR reactions exhibit a perfectly symmetric sigmoidal amplification curve, their position in the feature space may potentially overlap. This limitation can be tackled from a molecular perspective by tuning the chemistry (e.g., amplicon length, primer location, GC content, etc.) in order to sufficiently change amplification curves without compromising the performance of the reaction (e.g., speed, sensitivity, specificity, etc.).
In terms of future directions, there are many research paths that can be explored. Both the theory of the framework and its applications can be investigated. The results presented in this paper raise a number of questions: Can the proposed framework be used for emerging isothermal amplification chemistries? Is there any benefit of using more than 3 features? How many MSCs can the feature space accommodate for multiplex assays? How could the framework accommodate features with a nonlinear relationship to initial template concentrations? Can the MSC approach reduce the number of required technical replicates for quantifying unknown samples given the increased confidence provided by the distance measure?
In conclusion, this paper presents a framework, multidimensional standard curve, and the feature space, which presents many opportunities for researchers to explore new techniques and ideas. This methodology will also have huge potential for emerging diagnostic technologies with high-throughput such as ISFET arrays, where each reaction can have thousands of amplification curves and detecting outliers manually is infeasible.38−40 We hope that by sharing these concepts, others will be able to adapt and enhance this work to meet their objectives and advance the field of nucleic acid research.
Acknowledgments
We would like to acknowledge Imperial Confidence in Concepts-Joint Translational Fund, Wellcome Trust ISSF (PS3111EESA to P.G. and J.R.M.), EPSRC Pathways to Impact (PSE394EESA to P.G. and J.R.M.), EPSRC Global Challenge Research Fund (EP/P510798/1 to P.G. and J.R.M.), EPSRC HiPEDS CDT (EP/L016796/1 to K.M.C.), and EPSRC DTP (EP/N509486/1 to A.M.) for supporting this work. The research was also partially funded by the National Institute for Health Research Health Protection Research Unit (NIHR HPRU) in Healthcare Associated Infection and Antimicrobial Resistance at Imperial College London in partnership with Public Health England (PHE; HPRU-2012–10047 to A.H.). The views expressed are those of the author(s) and not necessarily those of the NHS, the NIHR, the Department of Health, or Public Health England.
Supporting Information Available
The Supporting Information is available free of charge on the ACS Publications website at DOI: 10.1021/acs.analchem.9b01466.
Synthetic DNA sequences, numerical values of extracted features and sigmoidal fittings for lambda DNA standard, breakdown for Figure of Merit of Ct, Cy0, −log10(F0), and M0, numerical values of extracted features and sigmoidal fittings for nonspecific outliers, numerical values of extracted features and sigmoidal fittings for temperature variation experiment, estimated quantification for temperature variation experiment, melting curve analysis for lambda DNA standard experiment, melting curve analysis for nonspecific outlier detection experiment, and melting curve analysis for temperature variation experiment (PDF)
Author Contributions
∥ A.M. and J.R.-M. contributed equally to this work as first authors.
The authors declare no competing financial interest.
Supplementary Material
References
- Higuchi R.; Fockler C.; Dollinger G.; Watson R. Kinetic PCR analysis: real-time monitoring of DNA amplification reactions. Nat. Biotechnol. 1993, 11, 1026. 10.1038/nbt0993-1026. [DOI] [PubMed] [Google Scholar]
- Heid C. A.; Stevens J.; Livak K. J.; Williams P. M. Real time quantitative PCR. Genome Res. 1996, 6, 986–994. 10.1101/gr.6.10.986. [DOI] [PubMed] [Google Scholar]
- Gingeras T. R.; Higuchi R.; Kricka L. J.; Lo Y. D.; Wittwer C. T. Fifty years of molecular (DNA/RNA) diagnostics. Clin. Chem. 2005, 51, 661–671. 10.1373/clinchem.2004.045336. [DOI] [PubMed] [Google Scholar]
- Mackay I. M.; Arden K. E.; Nitsche A. Real-time PCR in virology. Nucleic acids research 2002, 30, 1292–1305. 10.1093/nar/30.6.1292. [DOI] [PMC free article] [PubMed] [Google Scholar]
- Bustin S. A. Absolute quantification of mRNA using real-time reverse transcription polymerase chain reaction assays. J. Mol. Endocrinol. 2000, 25, 169–193. 10.1677/jme.0.0250169. [DOI] [PubMed] [Google Scholar]
- Nolan T.; Hands R. E.; Bustin S. A. Quantification of mRNA using real-time RT-PCR. Nat. Protoc. 2006, 1, 1559. 10.1038/nprot.2006.236. [DOI] [PubMed] [Google Scholar]
- Girones R.; Ferrús M. A.; Alonso J. L.; Rodriguez-Manzano J.; Calgua B.; de Abreu Corrêa A.; Hundesa A.; Carratala A.; Bofill-Mas S. Molecular detection of pathogens in water–the pros and cons of molecular techniques. Water Res. 2010, 44, 4325–4339. 10.1016/j.watres.2010.06.030. [DOI] [PubMed] [Google Scholar]
- Caliendo A. M.; et al. Better Tests, Better Care: Improved Diagnostics for Infectious Diseases. Clin. Infect. Dis. 2013, 57, S139–S170. 10.1093/cid/cit578. [DOI] [PMC free article] [PubMed] [Google Scholar]
- Ghani A. C.; Burgess D. H.; Reynolds A.; Rousseau C. Expanding the role of diagnostic and prognostic tools for infectious diseases in resource-poor settings. Nature 2015, 528, S50–S52. 10.1038/nature16038. [DOI] [PubMed] [Google Scholar]
- Misyura M.; Sukhai M. A.; Kulasignam V.; Zhang T.; Kamel-Reid S.; Stockley T. L. Improving validation methods for molecular diagnostics: application of Bland-Altman, Deming and simple linear regression analyses in assay comparison and evaluation for next-generation sequencing. J. Clin. Pathol. 2018, 71, 117–124. 10.1136/jclinpath-2017-204520. [DOI] [PMC free article] [PubMed] [Google Scholar]
- Wittwer C. T.; Herrmann M. G.; Moss A. A.; Rasmussen R. P. Continuous fluorescence monitoring of rapid cycle DNA amplification. BioTechniques 1997, 22, 130–139. 10.2144/97221bi01. [DOI] [PubMed] [Google Scholar]
- Wittwer C.; Ririe K.; Rasmussen R.. Fluorescence monitoring of rapid cycle PCR for quantification. In Gene Quantification; Ferré F., Ed.; Advanced Biomedical Technologies; Birkhäuser Boston, 1998; pp 129–144. [Google Scholar]
- Freeman W. M.; Walker S. J.; Vrana K. E. Quantitative RT-PCR: pitfalls and potential. BioTechniques 1999, 26, 112–125. 10.2144/99261rv01. [DOI] [PubMed] [Google Scholar]
- Raeymaekers L. A commentary on the practical applications of competitive PCR. Genome Res. 1995, 5, 91–94. 10.1101/gr.5.1.91. [DOI] [PubMed] [Google Scholar]
- Guescini M.; Sisti D.; Rocchi M. B.; Stocchi L.; Stocchi V. A new real-time PCR method to overcome significant quantitative inaccuracy due to slight amplification inhibition. BMC Bioinf. 2008, 9, 326. 10.1186/1471-2105-9-326. [DOI] [PMC free article] [PubMed] [Google Scholar]
- Rutledge R. Sigmoidal curve-fitting redefines quantitative real-time PCR with the prospective of developing automated high-throughput applications. Nucleic Acids Res. 2004, 32, e178–e178. 10.1093/nar/gnh177. [DOI] [PMC free article] [PubMed] [Google Scholar]
- Rodriguez-Manzano J.; Moniri A.; Malpartida-Cardenas K.; Dronavalli J.; Davies F.; Holmes A.; Georgiou P. Simultaneous Single-Channel Multiplexing and Quantification of Carbapenem-Resistant Genes Using Multidimensional Standard Curves. Anal. Chem. 2019, 91, 2013–2020. 10.1021/acs.analchem.8b04412. [DOI] [PMC free article] [PubMed] [Google Scholar]
- Van der Maaten L.; Postma E.; Van den Herik J. Dimensionality Reduction: a Comparative Review. J. Mach Learn Res. 2009, 10, 66–71. [Google Scholar]
- Rao X.; Lai D.; Huang X. A new method for quantitative real-time polymerase chain reaction data analysis. J. Comput. Biol. 2013, 20, 703–711. 10.1089/cmb.2012.0279. [DOI] [PMC free article] [PubMed] [Google Scholar]
- Coleman T. F.; Li Y. An interior trust region approach for nonlinear minimization subject to bounds. SIAM Journal on optimization 1996, 6, 418–445. 10.1137/0806023. [DOI] [Google Scholar]
- Coleman T. F.; Li Y. On the Convergence of Reflective Newton Methods for Large-Scale Nonlinear Minimization Subject to Bounds. Mathematical Programming 1994, 67, 189–224. [Google Scholar]
- Levenberg K. A method for the solution of certain non-linear problems in least squares. Q. Appl. Math. 1944, 2, 164–168. 10.1090/qam/10666. [DOI] [Google Scholar]
- Marquardt D. W. An algorithm for least-squares estimation of nonlinear parameters. J. Soc. Ind. Appl. Math. 1963, 11, 431–441. 10.1137/0111030. [DOI] [Google Scholar]
- Friedman J.; Hastie T.; Tibshirani R.. The Elements of Statistical Learning; Springer Series in Statistics: New York, 2001; Vol. 1. [Google Scholar]
- Mandic D. P.; Kanna S.; Xia Y.; Moniri A.; Junyent-Ferre A.; Constantinides A. G. A Data Analytics Perspective of Power Grid Analysis-Part 1: The Clarke and Related Transforms [Lecture Notes]. IEEE Signal Processing Magazine 2019, 36, 110–116. 10.1109/MSP.2018.2878656. [DOI] [Google Scholar]
- Fischler M. A.; Bolles R. C. Random sample consensus: a paradigm for model fitting with applications to image analysis and automated cartography. Commun. ACM 1981, 24, 381–395. 10.1145/358669.358692. [DOI] [Google Scholar]
- De Maesschalck R.; Jouan-Rimbaud D.; Massart D. L. The mahalanobis distance. Chemom. Intell. Lab. Syst. 2000, 50, 1–18. 10.1016/S0169-7439(99)00047-7. [DOI] [Google Scholar]
- Coomans D.; Broeckaert I.; Derde M.; Tassin A.; Massart D.; Wold S. Use of a microcomputer for the definition of multivariate confidence regions in medical diagnosis based on clinical laboratory profiles. Comput. Biomed. Res. 1984, 17, 1–14. 10.1016/0010-4809(84)90002-8. [DOI] [PubMed] [Google Scholar]
- Nelder J. A.; Mead R. A simplex method for function minimization. computer journal 1965, 7, 308–313. 10.1093/comjnl/7.4.308. [DOI] [Google Scholar]
- Lagarias J. C.; Reeds J. A.; Wright M. H.; Wright P. E. Convergence properties of the Nelder–Mead simplex method in low dimensions. SIAM Journal on optimization 1998, 9, 112–147. 10.1137/S1052623496303470. [DOI] [Google Scholar]
- Thode H. C.Testing for Normality, 1st ed.; CRC Press, 2002. [Google Scholar]
- Monteiro J.; Widen R. H.; Pignatari A. C.; Kubasek C.; Silbert S. Rapid detection of carbapenemase genes by multiplex real-time PCR. J. Antimicrob. Chemother. 2012, 67, 906–909. 10.1093/jac/dkr563. [DOI] [PubMed] [Google Scholar]
- Witters D.; Sun B.; Begolo S.; Rodriguez-Manzano J.; Robles W.; Ismagilov R. F. Digital biology and chemistry. Lab Chip 2014, 14, 3225–3232. 10.1039/C4LC00248B. [DOI] [PubMed] [Google Scholar]
- Sun B.; Rodriguez-Manzano J.; Selck D. A.; Khorosheva E.; Karymov M. A.; Ismagilov R. F. Measuring Fate and Rate of Single-Molecule Competition of Amplification and Restriction Digestion, and Its Use for Rapid Genotyping Tested with Hepatitis C Viral RNA. Angew. Chem., Int. Ed. 2014, 53, 8088–8092. 10.1002/anie.201403035. [DOI] [PMC free article] [PubMed] [Google Scholar]
- Rodriguez-Manzano J.; Karymov M. A.; Begolo S.; Selck D. A.; Zhukov D. V.; Jue E.; Ismagilov R. F. Reading out single-molecule digital RNA and DNA isothermal amplification in nanoliter volumes with unmodified camera phones. ACS Nano 2016, 10, 3102–3113. 10.1021/acsnano.5b07338. [DOI] [PMC free article] [PubMed] [Google Scholar]
- Sisti D.; Guescini M.; Rocchi M. B.; Tibollo P.; D’Atri M.; Stocchi V. Shape based kinetic outlier detection in real-time PCR. BMC Bioinf. 2010, 11, 186. 10.1186/1471-2105-11-186. [DOI] [PMC free article] [PubMed] [Google Scholar]
- Guescini M.; Sisti D.; Rocchi M. B.; Panebianco R.; Tibollo P.; Stocchi V. Accurate and precise DNA quantification in the presence of different amplification efficiencies using an improved Cy0 method. PLoS One 2013, 8, e68481. 10.1371/journal.pone.0068481. [DOI] [PMC free article] [PubMed] [Google Scholar]
- Rodriguez-Manzano J.; Chia P. Y.; Yeo T. W.; Holmes A.; Georgiou P.; Yacoub S. Improving Dengue Diagnostics and Management Through Innovative Technology. Curr Infect Dis Rep 2018, 20, 25. 10.1007/s11908-018-0633-x. [DOI] [PMC free article] [PubMed] [Google Scholar]
- Miscourides N.; Yu L.-S.; Rodriguez-Manzano J.; Georgiou P. A 12.8 k current-mode velocity-saturation ISFET array for on-chip real-time DNA detection. IEEE transactions on biomedical circuits and systems 2018, 12, 1202. 10.1109/TBCAS.2018.2851448. [DOI] [PubMed] [Google Scholar]
- Moser N.; Rodriguez-Manzano J.; Lande T. S.; Georgiou P. A scalable ISFET sensing and memory array with sensor auto-calibration for on-chip real-time DNA detection. IEEE transactions on biomedical circuits and systems 2018, 12, 390–401. 10.1109/TBCAS.2017.2789161. [DOI] [PubMed] [Google Scholar]
Associated Data
This section collects any data citations, data availability statements, or supplementary materials included in this article.