

Abstract
Co-occurring sounds can facilitate perception of spatially and temporally correspondent visual events. Separate lines of research have identified two putatively distinct neural mechanisms underlying two types of crossmodal facilitations: whereas crossmodal phase-resetting is thought to underlie enhancements based on temporal correspondences, lateralized occipital evoked potentials (ERPs) are thought to reflect enhancements based on spatial correspondences. Here, we sought to clarify the relationship between these two effects to assess whether they reflect two distinct mechanisms or, rather, two facets of the same underlying process. To identify the neural generators of each effect, we examined crossmodal responses to lateralized sounds in visually-responsive cortex of 22 patients using electrocorticographic (ECoG) recordings. Auditory-driven phase-reset and ERP responses in visual cortex displayed similar topography, revealing significant activity in pericalcarine, inferior occipital-temporal, and posterior parietal cortex, with maximal activity in lateral occipito-temporal cortex (potentially V5/hMT+). Laterality effects showed similar, but less widespread topography. To test whether lateralized and non-lateralized components of crossmodal ERPs emerged from common or distinct neural generators, we compared responses throughout visual cortex. Visual electrodes responded to both contralateral and ipsilateral sounds with a contralateral bias, suggesting that previously observed laterality effects do not emerge from a distinct neural generator, but rather reflect laterality-biased responses in the same neural populations that produce phase-resetting responses. These results suggest that crossmodal phase-reset and ERP responses previously found to reflect spatial and temporal facilitation in visual cortex may reflect the same underlying mechanism. We propose a new unified model to account for these and previous results.
Introduction
Co-occurring sounds can facilitate the perception of spatially or temporally correspondent visual events. Salient lateralized sounds can enhance the detection and discrimination of co-located visual targets (Spence & Driver, 1997; McDonald, Teder-Sälejärvi, & Hillyard, 2000; Driver & Spence, 2004; Lu et al., 2009), while spatially uninformative sounds can enhance the detection, discrimination, and perceived temporal dynamics of co-occurring visual stimuli (Shipley, 1964; Shams, Kamitani, & Shimojo, 2002; Noesselt et al., 2010; Jaekl & Soto-Faraco, 2010; Chen, Huang, Yeh, & Spence, 2011; Fiebelkorn et al., 2011). However, it is currently unclear whether audiovisual interactions based on spatial and temporal correspondences are subserved by the same or distinct neural mechanisms for crossmodal enhancement.
Separate lines of research have previously identified two putatively distinct mechanisms thought to underlie crossmodal facilitations based on each type of audiovisual correspondence. On the one hand, crossmodal phase-resetting (i.e, auditory resetting of oscillations in visual cortex) is thought to facilitate visual perception for temporally correspondent stimuli by placing visual cortex in a high-excitability state before visual signals arrive (Lakatos et al., 2009; Naue et al., 2011; Romei, Gross, & Thut, 2012; Mercier et al., 2013; for review, see Thorne & Debener, 2014). Because this mechanism produces transient increases in visual cortical sensitivity that are time-locked to auditory events, it can be seen as primarily producing crossmodal enhancements based on temporal correspondences between auditory and visual stimuli.
On the other hand, interhemispheric laterality differences in occipital ERPs produced by spatialized sounds are thought to reflect hemisphere-specific crossmodal excitation (or suppression) of activity in visual cortex (McDonald, Störmer, Martinez, Feng, & Hillyard, 2013; Feng, Störmer, Martinez, McDonald, & Hillyard, 2014; Brang et al., 2015; Matusz, Retsa, & Murray, 2016; Campus, Sandini, Morrone, & Gori, 2017; for review, see Hillyard, Störmer, Feng, Martinez, & McDonald, 2016). By modulating visual activity in a hemisphere-specific manner, these effects are thought to selectively enhance the neural encoding of spatially-correspondent visual stimuli, potentially reflecting a mechanism for the crossmodal orienting of exogenous visuospatial attention (Hillyard, Störmer, Feng, Martinez, & McDonald, 2016).
Differences in the apparent timing and neural topography of the effects associated with each putative mechanism have led researchers to study and interpret them primarily as independent processes. Whereas activity associated with crossmodal phase-resetting is typically observed 20–150 ms after sound onset (Lakatos et al., 2009; Naue et al., 2011; Romei, Gross, & Thut, 2012; Mercier et al., 2013), lateralized ERP differences during this period are typically attributed to auditory neural generators, with only later (150–400 ms) laterality effects typically being localized to visual cortex (McDonald, Störmer, Martinez, Feng, & Hillyard, 2013; Feng, Störmer, Martinez, McDonald, & Hillyard, 2014; Matusz, Retsa, & Murray, 2016). Moreover, crossmodal phase-resetting is typically observed in or localized to low-level visual cortex, including primary visual cortex (Naue et al., 2011; Lakatos et al., 2009), while lateralized ERP differences are typically localized to ventral-lateral occipital regions associated with higher-order visual processing (McDonald, Störmer, Martinez, Feng, & Hillyard, 2013; Feng, Störmer, Martinez, McDonald, & Hillyard, 2014; Matusz, Retsa, & Murray, 2016).
However, additional findings call into question a strict neural dissociation between these two types of facilitation. First, whereas most scalp-recorded EEG studies tend to show the clearest laterality effects at later time points, at least one has found robust lateralized occipital responses as early as 50–100 ms after sound onset, specifically when the locations of auditory stimuli were task-relevant (Campus, Sandini, Morrone, & Gori, 2017). Early occipital laterality differences have also been observed in other studies using scalp-recorded EEG (e.g., McDonald, Störmer, Martinez, Feng, & Hillyard, 2013), but have been attributed to lateralized sources in auditory cortex on the basis of source-localization analyses. However, given the limited spatial resolution of scalp-recorded EEG, and potential weakness of EEG source-localization procedures (Bradley, Yao, Dewald, & Richter, 2016), it is possible that these early laterality differences are at least partially attributable to lateralized responses in visual cortex. Second, source localizations of late lateralized responses have not always unambiguously identified ventral-lateral occipital sources, with some source estimates including more medial sources potentially corresponding to low-level visual regions implicated in studies of phase-resetting (Feng, Störmer, Martinez, McDonald, & Hillyard, 2014; Matusz, Retsa, & Murray, 2016). Finally, we have recently observed both early (30–150 ms after sound onset) and late (300–500 ms) lateralized ERP responses to sounds in depth electrode recordings from low-level pericalcarine visual cortex (putative V1/V2) in two human epilepsy patients (Brang et al., 2015). Thus, the putative mechanisms subserving crossmodal facilitations based on spatial versus temporal correspondences may not be as clearly dissociable as the literature exploring these phenomena independently appears to suggest.
To examine the relationship between these two putative mechanisms more closely, we used subdural and stereotactic electrocorticographic (ECoG) recordings from patients with epilepsy to examine the topography and timing of crossmodal phase-resetting, bilaterally-averaged ERPs, and ERP laterality differences evoked by sounds in visual cortex. Consistent with our previous research using centrally presented sounds (Brang et al., in review), lateralized noise bursts produced widespread phase-resetting throughout visually-responsive cortex, including pericalcarine, lateral occipital, inferior occipital-temporal, and posterior parietal cortex, with maximal activity in an occipitotemporal region potentially corresponding to area V5/hMT+. Averaging across contralateral and ipsilateral sound conditions, ERP responses showed a similar topography as the phase-resetting response, suggesting that the bilaterally-averaged ERP response and crossmodal phase-resetting likely reflect the same crossmodal activity.
To evaluate the relationship between this average bilateral response and laterality differences in crossmodal responses to sounds, we compared the cortical topography, magnitude, and time-course of ERPs produced by contralaterally- and ipsilaterally-presented sounds in visual cortex. Laterality effects first emerged in pericalcarine and lateral occipito-temporal regions (50–150 ms) and spread to inferior occipito-temporal and posterior parietal regions over longer durations (150–400 ms), mirroring the topography of the phase-reset and bilaterally-averaged ERP responses. The majority of electrodes exhibiting lateralized responses produced significant responses to sounds in both hemifields, and no distinct region that consistently responded exclusively to either hemifield could be identified. Additionally, in participants with widespread coverage over visual cortex, the size of ipsilateral and contralateral responses were highly correlated across electrodes during both early and late response periods, but with a contralateral bias.
Together, these results suggest that crossmodal phase-resetting, bilateral ERPs, and ERP laterality effects observed in response to sounds are generated by the same neural populations in visual cortex and, therefore, that a common mechanism may facilitate visual perception on the basis of spatial and temporal correspondences with sounds. Response laterality does not appear to arise from a distinct neural generator that responds exclusively to contralateral sounds, but from a contralateral bias in neural populations that respond to sounds in visual cortex more generally. This result is consistent with a model of crossmodal interactions in which the properties of auditory cortical responses to sounds, including response laterality, are inherited by visual cortex, without the aid of an additional mechanism specialized for crossmodal conveyance of spatial information.
MATERIALS AND METHODS
Participants
22 patients with epilepsy participated in this study during invasive work-up for medically intractable seizures using ECoG monitoring from chronically implanted depth electrodes (5 mm center-to-center spacing, 2 mm diameter) and/or subdural electrodes (10 mm center-to-center spacing, 3 mm diameter). Participants ranged in age from 15–56 (mean = 34.2, SD = 12.6) and included 8 females. Electrodes were placed according to the clinical needs of the participants. Written consent was obtained from each participant according to the direction of the institutional review boards at the University of Michigan, University of Chicago, and Henry Ford Hospitals.
MRI and CT Acquisition and Processing
A preoperative T1-weighted MRI and a postoperative CT scan were acquired for each participant to aid in localization of electrodes. Cortical reconstruction and volumetric segmentation of each participant’s MRI was performed with the Freesurfer image analysis suite (http://surfer.nmr.mgh.harvard.edu/; Dale, Fischl, and Sereno 1999; Fischl, Sereno, and Dale, 1999). Postoperative CT scans were registered to the T1-weighted MRI through SPM and electrodes were localized along the Freesurfer cortical surface using customized open-source software developed in our laboratories (Brang et al., 2016; available for download online https://github.com/towle-lab/electrode-registration-app/). This software segments electrodes from the CT by intensity values and projects the normal tangent of each electrode to the dura surface, avoiding sulcal placements and correcting for post-implantation brain deformation present in CT images.
Lateralized Sounds Paradigm
Participants were seated in a hospital bed. Auditory stimuli were delivered via a laptop using PsychToolbox (Pelli, 1997; Brainard, 1997) through a pair of free-field speakers placed approximately 45 degrees to the right and left of participants’ midline. The laptop and speakers were placed on a mobile overbed table, producing a viewing distance of approximately 80 cm. Two variants of the task were utilized across participants. Data were combined across tasks because previous studies have demonstrated similar crossmodal responses in both tasks (McDonald, Störmer, Martinez, Feng, & Hillyard, 2013; Feng, Störmer, Martinez, McDonald, & Hillyard, 2014) and because we observed highly similar crossmodal responses in patients who completed both tasks. In Task A, participants were presented with one of three sounds on each trial: a 53 ms 1000 Hz sinewave tone presented from both speakers simultaneously and thus localized centrally (15 trials/block) or a 83 ms pink noise burst presented from either the left (30 trials/block) or right speaker (30 trials/block). Participants completed between 2 and 6 blocks. Stimuli were selected for consistency with the paradigm used by McDonald and colleagues (2013; Experiment 4). A central fixation cross was displayed on the laptop throughout the experiment. Participants were instructed to maintain central fixation and to respond via button press to the central 1000 Hz tone while making no response to the peripheral noise bursts (for which electrocorticographic responses were analyzed). The inter-stimulus interval varied randomly between 2.0 and 2.5 seconds (uniform distribution). Task B was based on the task used by Feng and colleagues (2014). The same 83 ms pink noise burst used in task A was presented from either the left (60 trials/block) or right speaker (60 trials/block), with no central tone trials. 400 ms after the presentation of a sound, a 50 ms in duration visual letter (L or T) was presented on either the left or right side of the screen, followed by a 100 ms visual masking stimulus; sounds were not statistically predictive of the location of the subsequent visual target. Participants were instructed to identify the L or T stimulus via button press. The inter-trial interval varied randomly between 1.65 and 2.25 seconds (uniform distribution). Participants completed between 2 and 4 blocks. Data from the visual portion of the trial were not examined for the purpose of this study, and analyses were restricted to the time-period prior to their onset. 6 participants completed Task A only, 11 completed Task B only, and 5 completed both.
Electrocorticographic (ECoG) Recordings and Analysis
ECoG recordings were acquired at 1024 Hz (14 participants), 4096 Hz (5 participants), or 1000 Hz (3 participants) due to differences in the clinical amplifiers used. Data recorded at 4096 Hz were down-sampled to 1024 Hz during the initial stages of processing. The onset of each trial was denoted online by a voltage-isolated TTL pulse. In order to ensure that electrodes reflected maximally local and independent activity from one another, we used bipolar referencing. Noisy channels, defined as those containing epileptic spiking (manually identified) or with an overall variance exceeding five standard deviations, were removed from analyses. Similarly, noisy trials, defined as those with an overall variance exceeding three standard deviations, were removed from analyses. These values were selected to match those used in our previous research using centrally-presented sounds (Brang et al., in review). These values are the default used by our group, and are based on the approach used by other groups as well (e.g., Jacques et al., 2016; Jiang et al., 2017), with values typically ranging from 3–5 SD for both channel and trial rejection. Across both tasks, 4.7% (SD = 3.3%) of trials were rejected on average, resulting in the analysis of between 112 and 656 trials across participants (M = 252.0 trials per participant, SD = 151.9). Following the rejection of artifactual channels and trials, data were high-pass filtered at .01 Hz to remove slow drift artifacts, and notch-filtered at 60 Hz and its harmonics to remove line-noise. Data were then segmented into 4-second in duration epochs (−2 to 2 seconds around the onset of the sound).
Specific analyses applied are described in-line throughout the Results section. In general, data were subjected to measures of the event-related potential (ERP) in which the raw voltage time-series from each trial are averaged across trials in a time-locked manner. ERP data were baselined relative to the 500 ms prior to sound onset (pre-stimulus period ranging from −500 to 0 ms). Two-tailed one-sample t-tests were used to examine whether single ERP conditions differed from zero at any time-point following sound onset. To control for statistical tests conducted at multiple time-points, multiple comparison corrections were applied at each channel using maximum statistics (Holmes, Blair, Watson, & Ford, 1996). In specific, a distribution containing 10,000 permuted values from the data (using either condition-label swapping for two-sample t-tests or sign-swapping for one-sample t-tests) were generated for each electrode and time-point. Next, a t-test (either one-sample or two-sample depending on the comparison) was then conducted at each time-point, and the maximum t-value for each electrode was taken from each permutation, resulting in a null-distribution of 10,000 t-values for each electrode. Finally, the upper and lower 2.5% of this null-distribution were taken as critical t-values; only t-values in the real data exceeding these thresholds were considered statistically significant. Critically, this test controls the family-wise error rate at p = .05, indicating that purely random data would survive this multiple comparison correction at a rate of 5%. To control for statistical tests being applied across many channels and participants, the minimum multiple-comparison corrected p-value from each electrode was then FDR-corrected (q = .05) across all electrodes and participants (Groppe, Urbach, & Kutas, 2011).
Intertrial phase clustering (ITPC) analyses reflect the consistency of intrinsic oscillatory phase angles across trials, providing a general index of phase-resetting. ITPC values were computed using nine wavelets (center frequencies ranging from 4 – 20 Hz at 2 Hz intervals, using a 750 ms gaussian temporal window at each frequency). Instantaneous phase-angles were calculated at each time-point, frequency bin, and trial from the resultant wavelet convolutions. ITPC values were calculated at each time-point and frequency as the magnitude of the complex average of the phase-angle vectors across trials between 0 and 250 ms following sound-onset; this restricted time-period was used to avoid temporal-smoothing past 400 ms -- the time at which a visual stimulus was presented in Task B. Values were then averaged over the 250 ms time-period and across all frequencies yielding a single value for each condition/electrode indexing stable phase-locking. ITPC values are bound between 0 (uniform phase angle distribution) and 1 (identical phase angles across trials). In order to identify significant ITPC values for each electrode, a null distribution (10,000 permutations) was constructed from phase-shuffling the angle of filtered data prior to the calculation of ITPC values. In specific, a random value ranging from -pi to +pi (uniformly sampled) was added to each trial prior to calculation of ITPC in each permutation iteration. Critically, on each permutation only a single random phase-offset was applied to all time-points and frequencies to maintain spectro-temporal dependencies in the data. To evaluate the statistical reliability of ECoG phase-resetting, we computed the difference in ITPC values between the real stimulus-related data and data obtained from each permutation in the null distribution, counting the number of permutations with ITPC values exceeding those of the real data; electrodes at which <5% of the permuted ITPC values exceeded the real ITPC values were considered statistically significant. As in the ERP analyses, this method controls the family-wise error rate at 5%. FDR multiple comparison corrections (q = .05) were then applied across all electrodes and participants.
Selection of Visual Electrodes
Electrodes included for analyses are displayed in Figure 1. Visual electrodes were limited to those located in occipital, parietal, or temporal areas (excluding the superior temporal gyrus) and showing a significant ERP (p<.05, multiple comparison corrected) to visual stimuli beginning at less than 200 ms using a separate visual-localizer task that presented participants with complex visual stimuli (e.g., faces, objects, scenes, etc.). All electrodes were projected onto the left hemisphere of an MNI152 brain for visualization.
Figure 1.

(a) Intracranial electrodes from 22 patients, displayed on an average brain (all electrodes projected into the left hemisphere). Each black or colored circle reflects a single electrode contact included in analyses, localized to visual areas (313 electrodes included in total). Electrodes were restricted to those located in occipital, parietal, or inferior/posterior temporal areas (excluding the superior temporal gyrus) and showing a significant event-related potential (ERP) to visual stimuli beginning at less than 200 ms. Color-coded electrodes correspond to data in panel b and Figures 4 and 5. (b) ERP responses from representative electrodes evoked during a visual task. Electrode numbers are located in the top left of each panel and correspond to the same numbers in Figures 4 and 5. Visual stimulus onset is at 0 seconds (vertical dotted line). Shaded error-bars reflect 95% confidence intervals.
RESULTS
Previous research has identified two potential mechanisms for auditory facilitation of visual cortical processing: whereas crossmodal phase-resetting is thought to underlie enhancements based on audiovisual temporal correspondences (Thorne & Debener, 2014), interhemispheric differences in occipital ERPs are thought to reflect enhancements based on audiovisual spatial correspondences (Hillyard, Störmer, Feng, Martinez, & McDonald, 2016). However, the relationship between these putatively distinct effects is unclear. To clarify whether these effects reflect related or distinct processes, we leveraged the excellent spatial resolution provided by densely sampled intracranial recordings to compare the cortical topographies and time-courses of crossmodal phase-resetting, bilaterally-averaged ERPs, and ERP laterality differences observed in response to sounds in visual cortex. Averaging across contralateral and ipsilateral sound conditions, we first tested whether bilaterally-averaged ERP responses to sounds exhibited a similar neural topography as the auditory phase-reset response in visual cortex. Then, we performed multiple tests to evaluate whether this bilaterally-averaged response and lateralized ERP differences were generated by distinct neural populations that separately encoded spatial and non-spatial stimulus information, or reflected a common laterality-biased response from the same neural generators.
Comparison of Crossmodal Phase-Reset Responses and Auditory-Evoked Visual ERPs
Because event-driven phase-resetting can generate ERPs (Sauseng et al., 2007; Klimesch, Sauseng, Hanslmayr, Gruber, & Freunberger, 2007), we first tested to see whether the overall ERP response to sounds, averaged across contralateral and ipsilateral conditions, could plausibly be attributed to crossmodal phase-resetting. To test the hypothesis that the bilaterally-averaged ERP response was produced by the same neural generators as the crossmodal phase-reset response in visual cortex, we compared the spatial distributions of visual electrodes that displayed ERPs to the spatial distribution of those that displayed significant phase clustering (ITPC) in response to lateralized sounds. Both analyses were performed by pooling ipsilateral and contralateral responses, and therefore reflected the non-lateralized component of the crossmodal response to lateralized sounds.
Consistent with our previous research using centralized sounds (Brang, et al., in review), lateralized noise bursts produced widespread phase clustering throughout visually-responsive cortex, indicating widespread crossmodal phase-resetting distributed across multiple visual regions (Figure 2a). Altogether, 153 of 313 (48.9%) visual electrodes showed significant ITPC during the 250 ms following sound-onset. Significant electrodes were observed in pericalcarine, lateral occipital, inferior occipital-temporal, and posterior parietal cortex, with maximal activity in an occipitotemporal region posterior to the middle temporal gyrus. The anatomical location of this latter area was consistent with the expected location of visual area V5/hMT+, though we could not verify the functional specificity of this area using motion-based localizers. The close correspondence between the cortical topography of this response and that previously observed to centralized sounds suggests that salient sounds produce widespread phase-resetting throughout visual cortex regardless of stimulus location.
Figure 2.

Colored electrodes reflect significant (multiple comparison corrected for time-polnts and electrodes) activity according to either (a) inter-trial phase coherence (ITPC) or (b) event-related potential (ERP) analyses. Sounds activate visual cortex broadly and in a similarly distributed manner across both analyses, suggesting ERP and ITPC measures of phase-reset reflect similar mechanisms. The second row of images in each section reflects the same data on partially transparent brains to show statistics from electrodes not visible at the surface of the brain. The third row shows data from the individual electrodes shown in Figure 1 b.
ERP responses to the same stimuli displayed a highly similar cortical topography (Figure 2b), suggesting that the average ERP response and crossmodal phase-reset response likely reflect the same neural process. 195 of 313 (62.3%) of visual electrodes showed significant ERPs within 400 ms of sound onset. As in the phase clustering analysis, widespread auditory-driven ERPs were observed throughout visually-responsive cortex, with close correspondences between the most active regions observed in each analysis. These results suggest that at least the non-lateralized aspects of crossmodal ERPs elicited by spatialized sounds likely reflect the same underlying process as the crossmodal phase-reset response typically observed in non-spatial auditory tasks. However, this does not rule out the possibility of a separate neural population that responds exclusively to sounds in one hemifield, thereby providing an independent mechanism for enhancements based on spatial correspondence. To assess the possibility of such a mechanism, we compared the time-course and topographies of bilaterally-averaged ERP responses and ERP laterality differences to assess whether they revealed two distinct regions that produced non-lateralized (i.e., spatially uninformative) and lateralized (i.e., spatially informative) responses to sounds.
Identifying the Source of Response Lateralization in Auditory-Evoked Visual ERPs
If response laterality associated with crossmodal spatial facilitation and non-lateralized responses associated with temporal facilitation through phase-resetting reflect distinct neural mechanisms, then they would be expected to arise from distinct neural generators. By contrast, if lateralized and non-lateralized components of visual cortex’s response to sounds reflect two aspects of the same spatially-biased response, they should arise from a common neural generator displaying a lateralality bias.
To test the hypothesis that these two components arise from the same underlying mechanism, we compared them in a series of tests evaluating their topographies, magnitudes, and time-courses. First, we compared the cortical topography of electrodes exhibiting bilaterally-averaged ERP responses to the topography of those exhibiting laterality differences between contralateral and ipsilateral stimulus conditions. Overall, lateralized ERP differences were less widespread than bilaterally-averaged responses, with 34 of 313 electrodes (10.9%) showing significantly different responses to contralateral compared to ipsilateral sounds (Figure 3a). This topographical difference may reflect the smaller effect sizes of the laterality differences relative to the average non-lateralized response, as observed in scalp EEG (e.g., McDonald et al., 2013), but likely also reflects decreased statistical power due to the division of trials into two conditions. Still, sites displaying significant laterality effects clustered closely around the lateral occipito-temporal, posterior parietal, and inferior occipito-temporal regions that showed the strongest non-lateralized component in our previous analysis, suggesting the possibility of a common neural generator.
Figure 3.
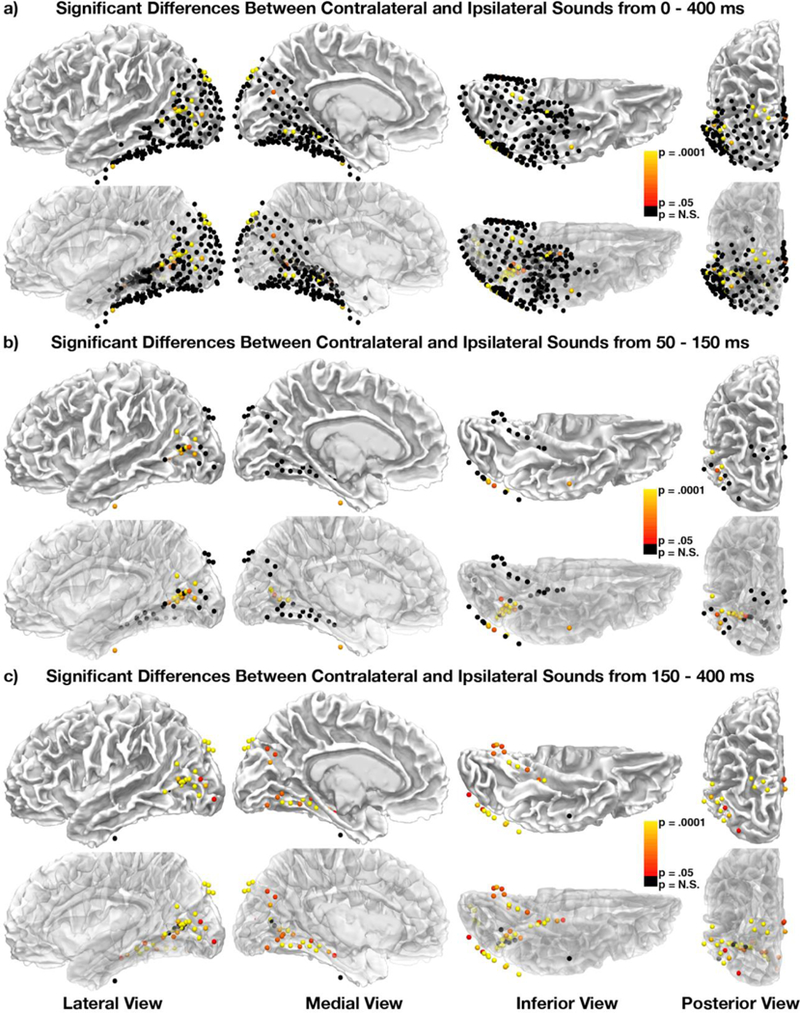
Colored electrodes reflect significant (multiple comparison corrected for time-points and electrodes) differences between contralateral and ipsilateral sounds from either (a) 0–400 ms, (b) 50–150 ms, or (c) 150–400 ms. (b-c) Black electrodes reflect non-significant differences in one of the two time-peri- ods. The second row of images in each section reflects the same data on partially transparent brains to show statistics from electrodes not visible at the surface of the brain.
Because previous studies using scalp-recorded EEG have shown temporally distinct “early” (50–150 ms) and “late” (150–400 ms) laterality effects, we also analyzed the topography of laterality differences during these two periods separately. Responses during the early period clustered around pericalcarine cortex and the lateral occipitotemporal region (potentially corresponding to area V5/hMT+) that showed the strongest effects in our analysis of the averaged bilateral response (Figure 3b), suggesting that the visual cortical response to sounds may originate from these sites. Responses during the late period included this region as well, with additional activity in dorsal (posterior parietal) and ventral (inferior occipitotemporal) sites, suggesting a pattern of spreading activation throughout visual cortex.
While these results suggest a general spatial correspondence between the neural generators of laterality differences and the average bilateral response, their relationship can be evaluated more directly by testing whether electrodes showing a laterality effect respond exclusively to sounds in one hemifield, or respond to both contralateral and ipsilateral sounds with a laterality bias. If laterality effects are produced by a distinct neural generator, then most electrodes displaying laterality effects should respond exclusively to sounds presented to one side. By contrast, if laterality effects result from laterality biases in the neural generators that produce the average bilateral response, then most electrodes showing laterality effects should respond to both contralateral and ipsilateral sounds, but with a spatial bias. Consistent with our hypothesis, the majority of electrodes displaying laterality effects (26 of 34; 76.5%) responded to both contralateral and ipsilateral sounds, but with a laterality bias (Figure 4); 6 of 34 (17.6%) only showed significant ERP responses to contralateral sounds; and 2 of 34 (5.9%) only showed significant ERP responses to ipsilateral sounds. Figure 5 shows the location of each individual electrode.
Figure 4.

ERPs at visual electrodes showing significant differences between contralateral (red) and ipsilat- eral (blue) sounds. Electrode numbers are located in the top left of each panel. Sound onset is at 0 seconds (vertical dotted line). Shaded color-bars reflect 95% confidence intervals. Black bars at bottom of plots show time-points at which the two conditions significantly differered from one another (corrected for multiple comparisons). Asterisks reflect significant one-sample t-tests (corrected for multiple comparisons) for either contralateral (red) or ipsilateral (blue) sounds.
Figure 5.

Locations of electrodes (red) corresponding to ERPs shown in Figure 4, highlighting areas at which significant differences between ipsilateral and contralateral ERPs were observed.
Whereas this analysis indicates that most electrodes displaying a lateralized response responded to both contralateral and ipsilateral sounds, it does not rule out the possibility of there being a small region in visual cortex that responds selectively to sounds presented only to a particular side. To evaluate this possibility, we visualized the locations of electrodes that displayed significant ERPs to contralateral, ipsilateral, or both types of sounds (Figure 6). Qualitatively, we could not identify any region displaying consistent selectivity for either contralateral or ipsilateral sounds. Rather, each major region identified in our previous analyses displayed mostly bilateral responses intermixed with spatially dispersed laterality-selective responses.
Figure 6.

Electrodes showing significant ERPs during contralateral sounds (blue), ipsilateral sounds (orange), or both (purple). A majority of electrodes were significant in both analyses suggesting similar neural mechanisms.
To evaluate this result in a more quantitative manner, we compared the effect sizes (Cohen’s D) of ERPs produced by contralateral and ipsilateral sounds across all electrodes present in four individual participants’ brains. These participants were selected because they each had at least 19 implanted electrodes, providing at least 80% power to detect correlations with coefficient r = 0.6, with a Type I error rate of a = 0.05. Electrode locations for each participant are shown in Figure 7a.
Figure 7.

(a) Electrodes present in the 4 participants with the greatest number of visual electrodes, with distinct colors for each patient, (b) Correlations between ERP effect sizes (Cohen’s D) for contralateral and ipsilateral sounds, evoked at visual selective electrodes. Data show strong correlations across all 4 participants suggesting similar mechanisms drive visual activity in response to contralateral and ipsilateral sounds, (c) Correlations between contralateral and ipsilateral effect sizes, calculated at each millisecond following stimulus onset. Black boxes denote significant time-points (corrected for multiple comparisons). Contralateral and ipsilateral effects were strongly correlated across both early and late time-periods.
If lateralized and non-lateralized aspects of crossmodal ERPs arise from a common neural generator with a laterality bias, then effect sizes for contralateral and ipsilateral sounds should be positively correlated across electrodes. By contrast, if there are distinct neural populations that respond selectively to sounds on a particular side, effect sizes should be negatively correlated or uncorrelated across electrodes. Notably, this analysis allows for a more fine-grained comparison of contralateral and ipsilateral responses than the previous analyses showing a similar distribution of significant electrodes, because it does not involve statistical thresholding prior to comparison.
Cohen’s D values were calculated at each time-point separately for contralateral and ipsilateral conditions by dividing the absolute value of the mean voltage at each time-point by the standard deviation (across trials) of the voltage at the same time-point. Absolute values were used because the directions of voltage deflections can vary with the position of electrodes relative to recorded activity, so effect magnitude is of primary interest. Using signed effect sizes produced larger correlation values, potentially reflecting inflated estimates produced by directional consistency within electrodes (i.e., correlations were exaggerated by consistency in the sign, rather than the magnitude, of effects across conditions).
The largest Cohen’s D value observed between 0 and 400 ms post-sound onset was extracted for each condition, yielding two values for each electrode. In all four participants, we found strong positive correlations between the effect sizes of contralateral and ipsilateral ERPs, indicating predominantly bilateral responses across electrodes (Figure 7b). For all four participants, estimated regression slopes were less than one, with 95% confidence intervals excluding one (Participant 8: Slope: 0.45, 95% CI [0.22, 0.68]; Participant 10: 0.55 [0.36, 0.74]; Participant 13: 0.45 [0.37, 0.52]; Participant 15: 0.66 [0.54, 0.79]), suggesting a significant contralateral bias across electrodes. This result remained when intercept terms were fixed at zero. No significant correlations were observed when performing the same analysis on the pre-stimulus baseline period (Participant 8: r(34) = 0.09, p = .61; Participant 10: r(27) = −0.08, p = .68; Participant 13: r(105) = 0.002, p = .98; Participant 15: r(17) = 0.13, p = .59), indicating that correlations were driven by the post-stimulus response, and not general differences in electrode sensitivity. Together, these results strongly suggest that lateralized and non-lateralized components of the visual cortical response to sounds arise from common neural generators that display a contralateral bias in their responses.
Because the timing of peak effect sizes varied considerably across electrodes and participants, including both early and late time periods identified in previous research, we examined effect size correlations in a time-resolved manner to assess the time-course of observed correlations throughout the entire analysis window (0–400 ms). For each participant, we computed correlations between contralateral and ipsilateral effect sizes for each electrode at each millisecond of the 400 ms response window (Figure 7c). Statistical significance was evaluated using FDR correction (q = .05) across all participants and time-points. For all four participants, we observed significant correlations during both early (approx. 50–150 ms) and later (approx. 150–400 ms) periods emphasized in previous research. Because 3 out of 4 participants (Participants 10, 13, and 15) exhibited temporally distinct peaks in their correlation time-courses that corresponded approximately to previously-identified “early” and “late” response periods, we examined the slopes of regression fits during these periods to test for contralaterally biased responses.
At time-points corresponding to early peaks in the correlation time-courses, (Participant 8: 99 ms; Participant 10: 117 ms; Participant 13: 130 ms; Participant 15: 59 ms), each regression yielded a slope significantly (3 of 4) or nearly significantly (1 of 4) less than 1 (Participant 8: 0.66 [0.33, 1.01]; Participant 10: 0.73 [0.58, 0.87]; Participant 13: 0.66 [0.51, 0.64]; Participant 15: 0.66 [0.40, 0.93]), suggesting the presence of contralaterally biased responses during this period. At time-points corresponding to later peaks (Participant 8: 295 ms; Participant 10: 319 ms; Participant 13: 315 ms; Participant 15: 371 ms), 3 out of 4 regression slopes were significantly less than 1 (Participant 8: 0.60 [0.33, 0.87]; Participant 10: 0.77 [0.33, 1.22]; Participant 13: 0.40 [0.24, 0.56]; Participant 15: 0.31 [0.07, 0.56]), with all slope estimates being numerically less than 1, again suggesting contralaterally biased responses during this period. These results further reinforce the conclusion that the effects observed in separate analyses of laterality effects and bilaterally-averaged responses do not reflect distinct lateralized and non-lateralized response but, rather, a single contralaterally-biased response.
DISCUSSION
Co-occurring sounds can facilitate the perception of spatially (Spence & Driver, 1997; McDonald, Teder-Sälejärvi, & Hillyard, 2000; Driver & Spence, 2004; Lu et al., 2009) or temporally (Shipley, 1964; Shams, Kamitani, & Shimojo, 2002; Noesselt et al., 2010; Jaekl & Soto-Faraco, 2010; Chen, Huang, Yeh, & Spence, 2011; Fiebelkorn et al., 2011) correspondent visual events. Separate lines of research have previously identified two putatively distinct neural mechanisms thought to underlie crossmodal facilitations based on each type of audiovisual correspondence. On the one hand, auditory-driven phase-resetting is thought to facilitate the perception of simultaneous visual stimuli by placing visual cortex in a high-excitability state before visual signals arrive (Thorne & Debener, 2014). On the other hand, lateralized ERPs elicited by spatialized sounds are thought to facilitate the perception of spatially correspondent visual stimuli through hemisphere-specific excitation (or suppression) of visual cortex (Hillyard, Störmer, Feng, Martinez, & McDonald, 2016). Here, we sought to compare the topography and time-course of these effects to examine the relationship between crossmodal enhancements associated with spatial and temporal correspondences.
Towards this end, we used densely sampled ECoG recordings from visual cortex to compare the neural generators of the auditory-driven phase-reset response to those of the lateralized and non-lateralized aspects of the auditory-driven ERP response in visual cortex. We found that the topography of the bilaterally-averaged ERP response closely matched the topography of the phase-resetting response produced by lateralized sounds in this study and centralized sounds in a previous study (Brang et al., In review), suggesting that both effects reflect the same underlying process.
To test whether this response reflected a distinct non-lateralized response that is mechanistically independent from the lateralized ERP differences produced by sounds in visual cortex, we performed three further analyses. First, we compared the cortical topographies of electrodes exhibiting bilaterally-averaged ERP responses to those exhibiting laterality differences in response to contralateral and ipsilateral sounds. While laterality differences showed a less widespread topography than bilaterally-averaged effects, areas displaying significant laterality effects corresponded closely with those that showed the strongest bilaterally-averaged response, suggesting a common neural generator.
Next, to determine whether response laterality was attributable to a distinct neural generator that responded exclusively to sounds in one hemifield, we tested whether individual electrodes displaying laterality effects responded selectively to sounds in either hemifield or responded to both sounds with a laterality bias. The majority of electrodes showed bilateral responses with a laterality bias, suggesting that laterality effects do not arise from a distinct neural generator, but actually reflect laterality biases in the same neural responses that produce the non-lateralized component of the ERP response. No distinct subregion that responded exclusively to sounds in either hemifield could be identified.
Finally, to broadly characterize the lateralization of auditory responses in neural populations throughout visual cortex, we examined the relationship between the effect sizes of ERPs produced by contralateral and ipsilateral sounds across individual visual electrodes. In four patients with widespread visual coverage, we found strong positive correlations between the effect sizes of contralateral and ipsilateral ERPs, indicating predominantly bilateral responses across electrodes. The slopes of associated linear regressions revealed a contralateral bias across electrodes, suggesting that lateralized and non-lateralized aspects of the visual cortical response to sounds arise from common neural generators that display a contralateral bias.
Taken together, these results suggest that crossmodal phase-resetting and lateralized ERP effects, typically studied as distinct responses reflecting separate mechanisms for crossmodal facilitation, may actually arise from the same neural generators and, therefore, reflect the same underlying process. This result is consistent with a model of crossmodal facilitation in which lateralized responses to sounds in visual cortex are not produced by a distinct mechanism specialized for crossmodal conveyance of spatial information, but a laterality bias inherited from auditory cortex and possibly modulated through attentive mechanisms.
On this account, the properties of visual cortical responses to sounds do not arise from multiple specialized mechanisms responsible for the independent processing of various crossmodal correspondences, but rather from the passive carryover of the properties of the auditory cortical response to sounds – including response laterality -- to visual cortex. As auditory cortex shows a contralateral bias in its response to sounds (e.g., right auditory cortex responds more strongly, but not exclusively, to left lateralized sounds; Celesia, 1976; Kaiser & Lutzenberger, 2001), and is thought to possess anatomical connections to visual cortex in the same hemisphere (right auditory cortex is connected to right visual cortex; Falchier et al., 2002; Rockland & Ojima, 2003), auditory cortex’s laterality bias may be passively carried-over to connected visual areas in the same hemisphere, resulting in a laterality bias in visual cortical responses to sounds.
One primary advantage of this explanation is that it can simultaneously account for the seemingly contradictory findings of context- or task-contingent laterality effects in visual cortical responses to sounds, which have been taken to suggest a distinct mechanism for spatial interactions across the senses, and our current results, which suggest the absence of such a mechanism. Previous studies suggest that laterality effects in occipital responses to sounds may depend on the task-relevance (Campus et al., 2017) and unpredictability (Matusz, Retsa, & Murray, 2016) of the locations of auditory stimuli. Because auditory spatial attention enhances response lateralization in auditory cortex (Alho et al., 1999; Teder-Sälejärvi, Hillyard, Röder, & Neville, 1999), the results of these attentional modulations may also be transmitted to visual cortex, producing larger lateralization effects when auditory spatial information is task relevant (drawing endogenous auditory spatial attention; e.g., Campus et al., 2017) or unpredictable (drawing exogenous auditory spatial attention; e.g., Matusz, Retsa, & Murray, 2016). Thus, on this account, previously observed modulations of crossmodal laterality effects could reflect enhanced lateralization in auditory cortex due to auditory spatial attention, rather than a distinct multisensory mechanism that specifically conveys auditory spatial information to visual cortex. Thus, we predict that manipulations of auditory spatial attention or spatial unpredictability would enhance the spatial biases observed in the current study, but would not produce purely laterality-selective responses.
While our results provide initial evidence consistent with such an account, further research is needed to verify the additional premises underlying the proposed model, which pre-supposes that visual cortex’s response to sounds is inherited from auditory cortex. However, it is also possible that auditory information is transmitted to visual cortex by subcortical or thalamic pathways that would not display response laterality or attentional modulation (Cappe, Rouiller, & Barone, 2012). Even though our previous research using amplitude-modulated sounds suggests that visual cortex’s response to sounds mirrors the temporal dynamics of auditory cortical, but not subcortical, responses (Brang et al., In review), additional evidence is needed to confidently conclude that crossmodal responses in visual cortex originate from auditory cortex. Additionally, the proposed model rests on the assumption that auditory signals are transmitted to visual cortex via lateralized intrahemispheric connections between auditory and visual cortices. While such connections have been observed in non-human primates (Falchier et al., 2002; Rockland & Ojima, 2003), it is currently unclear whether similar pathways exist in humans. Indeed, we have successfully reconstructed similar pathways using diffusion-weighted imaging (Plass, Zweig, Brang, Suzuki, & Grabowecky, 2015), though ambiguities regarding the accuracy of estimated cortical terminations in diffusion tractography currently preclude us from making conclusive claims regarding the presence or absence of this pathway in the human brain (Reveley et al., 2015). Therefore, while our results provide initial evidence for the proposed model, additional evidence is necessary to fully corroborate this account.
One specific prediction made by this model is that the lateralization of crossmodal responses to sounds in visual cortex should reflect the lateralization of auditory cortex’s responses to sounds, including variations potentially produced by spatial expectation, attention, task demands, adaptation, trial-by-trial variability, and the eccentricity-dependent resolution of auditory spatial attention (e.g., Teder-Sälejärvi, Hillyard, Röder, & Neville, 1999). While the most stringent test of these predictions would be to compare activity in auditory and visual cortices throughout a variety of auditory tasks, electrode placements dictated by clinical needs rarely result in this type of extended coverage and no participant in the current study had such coverage. We are currently exploring alternative methods to test these predictions rigorously. An additional prediction is that the spatial specificity of auditory effects on visual perception should reflect the resolution of spatial information provided by auditory cortical laterality. For example, because auditory cortical responses are only partially lateralized, auditory facilitations of visual perception should not be strictly hemifield-specific, and should occur even in cases of fairly coarse audiovisual spatial alignment. Behavioral and psychophysical studies are largely in agreement with this prediction, with auditory enhancements of visual detection and discrimination often proving to be surprisingly impervious to spatial misalignment (e.g., Fiebelkorn, Foxe, Butler, & Molholm, 2011; Spence, 2013).
One potential caveat to our interpretation is that, although we observed similar topographies across each of our analyses, it is still possible that distinct but closely co-located neural circuits or subpopulations separately generate the lateralized and non-lateralized responses observed in each area. For example, signals recorded by a single electrode may reflect the summed activity of neural populations in different cortical layers or adjacent patches of cortex. Still, given the high spatial precision provided by invasive intracranial electrodes, our results at least suggest that the generators of these responses are closely co-located, and are unlikely to occupy distinct regions of visual cortex as previous research appears to suggest.
One additional concern is that the intracranially-recorded responses analyzed here may not correspond precisely to crossmodal effects identified previously using scalp-recorded EEG (Naue et al., 2011; McDonald, Störmer, Martinez, Feng, & Hillyard, 2013; Feng, Störmer, Martinez, McDonald, & Hillyard, 2014; Matusz, Retsa, & Murray, 2016) or TMS (Romei, Gross, & Thut, 2012). While additional research comparing source-localized EEG, TMS, and ECoG responses is needed to clarify the relationship between these effects more definitively, the response topography observed in this study is largely in agreement with previous results, with dominant effects in lateral occipital cortex corresponding approximately to EEG source localizations of laterality effects (McDonald, Störmer, Martinez, Feng, & Hillyard, 2013; Feng, Störmer, Martinez, McDonald, & Hillyard, 2014; Matusz, Retsa, & Murray, 2016), and pericalcarine effects corresponding approximately to sites studied or stimulated in animal physiology (Lakatos et al., 2009), TMS (Romei, Gross, & Thut, 2012), and human EEG studies of crossmodal phase-resetting (Naue et al., 2011), and, arguably, some EEG studies of crossmodal laterality effects (Feng, Störmer, Martinez, McDonald, & Hillyard, 2014; Matusz, Retsa, & Murray, 2016; Campus, Sandini, Morrone, & Gori, 2017). Thus, the primary discrepancies between our results and (some) previous results are that we observe rapid lateralized responses in low-level visual cortex and laterality-biased responses at both “early” and “late” latencies. Because laterality effects were reliably smaller than the overall bilaterally-averaged response, these discrepancies may simply reflect differences in sensitivity between ECoG and scalp-recorded EEG, potential weaknesses of EEG source-localization (Bradley, Yao, Dewald, & Richter, 2016), and the fact that previous studies of phase-resetting have tended not to consider response laterality. Additional activity in posterior parietal or occipitoparietal cortex may correspond to previously observed alpha activity associated with audiovisual spatial attention (Banerjee, Snyder, Molholm, & Foxe, 2011; Frey et al., 2014), but further research is needed to confirm this speculation.
Another potential concern is that patients’ inadvertent eye movements could have influenced observed cortical responses. Although eye movements were not rigorously monitored using eye-tracking in this study, eye movements were monitored by the experimenter throughout the tasks and minimized through experimenter feedback. Previous studies using similar task protocols did not observe any eye deviations as measured by the electrooculogram (McDonald et al., 2013), and our experimental observations, though less rigorous, were largely consistent with this result. Importantly, eye-movements would not have been advantageous in either task because participants responded only to centralized sounds in Task A and the auditory cue location was not predictive of visual target location in task B. Moreover, the early auditory-evoked responses observed in this study are unlikely to have been contaminated by eye-movement-related activity because saccades to lateralized sounds typically take 150–300 ms to initiate (Frens & Van Opstal, 1995; Yao & Peck, 1997; Gabriel, Munoz, & Boehnke, 2010), and saccade-induced neural responses in low-level visual cortex and area MT tend to occur 40–100 ms after saccade onset (e.g., Bair & O’keefe, 1998; Kagan, Gur, & Snodderly, 2008). Thus, saccade-related activity is unlikely to have contaminated the earlier responses observed in this study. While later responses could have conceivably been contaminated by eye-movements, these responses are largely consistent with previous source-localizations of late lateralized ERPs in scalp-recorded EEG during rigorous monitoring of eye movements, and are therefore unlikely to reflect eye-movement-related activity.
Finally, additional research is necessary to better characterize the visual or other functions of the cortical sites identified in this study. While each of our analyses repeatedly pointed to a lateral occipito-temporal region, potentially corresponding to area V5/hMT+, as a critical site for audiovisual interactions, we were unable to verify the specific functional properties of this area using, for example, motion-based localizers. Further research is needed to verify whether this site indeed corresponds to motion-sensitive area V5/hMT+, or an adjacent site with distinct functional properties. Additionally, given the nature of our functional localizers, we cannot rule out the possibility that some sites identified in this study would be better characterized as multisensory association cortex than as visual cortex. More detailed characterization of the functional properties of each site is necessary to clarify this question; however, this distinction may rest more on semantic convention than on actual substance, given the widespread prevalence of multisensory interactions throughout neocortex (Ghazanfar & Schroeder, 2006). Altogether, our results suggest that auditory phase-resetting of visual activity (responsible for relaying temporal information to the visual system) and lateralized ERP effects (responsible for relaying spatial information to the visual system) can be accounted for by a single neural mechanism.
Acknowledgements
This study was supported by NIH Grant R00 DC013828.
REFERENCES
- Alho K, Medvedev SV, Pakhomov SV, Roudas MS, Tervaniemi M, Reinikainen K, … Näätänen R (1999). Selective tuning of the left and right auditory cortices during spatially directed attention. Cognitive Brain Research, 7(3), 335–341. [DOI] [PubMed] [Google Scholar]
- Bair W, & O’keefe LP (1998). The influence of fixational eye movements on the response of neurons in area MT of the macaque. Visual Neuroscience, 15(4), 779–786. [DOI] [PubMed] [Google Scholar]
- Banerjee S, Snyder AC, Molholm S, & Foxe JJ (2011). Oscillatory alpha-band mechanisms and the deployment of spatial attention to anticipated auditory and visual target locations: supramodal or sensory-specific control mechanisms? Journal of Neuroscience, 31(27), 9923–9932. 10.1523/JNEUROSCI.4660-10.2011/ [DOI] [PMC free article] [PubMed] [Google Scholar]
- Bradley A, Yao J, Dewald J, & Richter C-P (2016). Evaluation of Electroencephalography Source Localization Algorithms with Multiple Cortical Sources. PLOS ONE, 11(1), e0147266 10.1371/journal.pone.0147266 [DOI] [PMC free article] [PubMed] [Google Scholar]
- Brainard DH (1997). The Psychophysics Toolbox. Spatial Vision, 10(4), 433–436. [PubMed] [Google Scholar]
- Brang D, Dai Z, Zheng W, & Towle VL (2016). Registering imaged ECoG electrodes to human cortex: A geometry-based technique. Journal of Neuroscience Methods, 273, 64–73. [DOI] [PMC free article] [PubMed] [Google Scholar]
- Brang D, Towle VL, Suzuki S, Hillyard SA, Tusa SD, Dai Z, … Grabowecky M (2015). Peripheral sounds rapidly activate visual cortex: evidence from electrocorticography. Journal of Neurophysiology, 114(5), 3023–3028. 10.1152/jn.00728.2015 [DOI] [PMC free article] [PubMed] [Google Scholar]
- Campus C, Sandini G, Morrone MC, & Gori M (2017). Spatial localization of sound elicits early responses from occipital visual cortex in humans. Scientific Reports, 7(1), 10415 10.1038/s41598-017-09142-z [DOI] [PMC free article] [PubMed] [Google Scholar]
- Cappe C, Rouiller EM, & Barone P (2012). Cortical and Thalamic Pathways for Multisensory and Sensorimotor Interplay In The Neural Bases of Multisensory Processes. CRC Press/Taylor & Francis, Boca Raton (FL). [PubMed] [Google Scholar]
- Celesia GG (1976). Organization of auditory cortical areas in man. Brain, 99(3), 403. [DOI] [PubMed] [Google Scholar]
- Chen Y-C, Huang P-C, Yeh S-L, & Spence C (2011). Synchronous sounds enhance visual sensitivity without reducing target uncertainty. Seeing and Perceiving, 24(6), 623–638. [DOI] [PubMed] [Google Scholar]
- Dale AM, Fischl B, & Sereno MI (1999). Cortical surface-based analysis: I. Segmentation and surface reconstruction. Neuroimage, 9(2), 179–194. [DOI] [PubMed] [Google Scholar]
- Driver J, & Spence C (2004). Crossmodal spatial attention: Evidence from human performance. Crossmodal Space and Crossmodal Attention, 179–220. [Google Scholar]
- Falchier A, Clavagnier S, Barone P, & Kennedy H (2002). Anatomical Evidence of Multimodal Integration in Primate Striate Cortex. The Journal of Neuroscience, 22(13), 5749–5759. [DOI] [PMC free article] [PubMed] [Google Scholar]
- Feng W, Störmer VS, Martinez A, McDonald JJ, & Hillyard SA (2014). Sounds activate visual cortex and improve visual discrimination. Journal of Neuroscience, 34(29), 9817–9824. [DOI] [PMC free article] [PubMed] [Google Scholar]
- Fiebelkorn IC, Foxe JJ, Butler JS, Mercier MR, Snyder AC, & Molholm S (2011). Ready, Set, Reset: Stimulus-Locked Periodicity in Behavioral Performance Demonstrates the Consequences of Cross-Sensory Phase Reset. Journal of Neuroscience, 31(27), 9971–9981. 10.1523/JNEUROSCI.1338-11.2011/ [DOI] [PMC free article] [PubMed] [Google Scholar]
- Fiebelkorn IC, Foxe JJ, Butler JS, & Molholm S (2011). Auditory facilitation of visual-target detection persists regardless of retinal eccentricity and despite wide audiovisual misalignments. Experimental Brain Research, 213(2–3), 167 10.1007/s00221-011-2670-7 [DOI] [PubMed] [Google Scholar]
- Fischl B, Sereno MI, & Dale AM (1999). Cortical surface-based analysis: II: inflation, flattening, and a surface-based coordinate system. Neuroimage, 9(2), 195–207. [DOI] [PubMed] [Google Scholar]
- Frens MA, Van Opstal AJ, & Van der Willigen RF (1995). Spatial and temporal factors determine auditory-visual interactions in human saccadic eye movements. Perception & Psychophysics, 57(6), 802–816. [DOI] [PubMed] [Google Scholar]
- Frens MA, & Van Opstal AJ (1995). A quantitative study of auditory-evoked saccadic eye movements in two dimensions. Experimental Brain Research, 107(1), 103–117. [DOI] [PubMed] [Google Scholar]
- Frey JN, Mainy N, Lachaux J-P, Müller N, Bertrand O, & Weisz N (2014). Selective modulation of auditory cortical alpha activity in an audiovisual spatial attention task. Journal of Neuroscience, 34(19), 6634–6639. [DOI] [PMC free article] [PubMed] [Google Scholar]
- Gabriel DN, Munoz DP, & Boehnke SE (2010). The eccentricity effect for auditory saccadic reaction times is independent of target frequency. Hearing Research, 262(1–2), 19–25. [DOI] [PubMed] [Google Scholar]
- Ghazanfar AA, & Schroeder CE (2006). Is neocortex essentially multisensory? Trends in Cognitive Sciences, 10(6), 278–285. [DOI] [PubMed] [Google Scholar]
- Groppe DM, Urbach TP, & Kutas M (2011). Mass univariate analysis of event-related brain potentials/fields I: A critical tutorial review. Psychophysiology, 48(12), 1711–1725. [DOI] [PMC free article] [PubMed] [Google Scholar]
- Hillyard SA, Störmer VS, Feng W, Martinez A, & McDonald JJ (2016). Cross-modal orienting of visual attention. Neuropsychologia, 83, 170–178. 10.1016/j.neuropsychologia.2015.06.003 [DOI] [PubMed] [Google Scholar]
- Holmes AP, Blair RC, Watson JDG, & Ford I (1996). Nonparametric analysis of statistic images from functional mapping experiments. Journal of Cerebral Blood Flow & Metabolism, 16(1), 7–22. [DOI] [PubMed] [Google Scholar]
- Jacques C, Witthoft N, Weiner KS, Foster BL, Rangarajan V, Hermes D, … Grill-Spector K (2016). Corresponding ECoG and fMRI category-selective signals in human ventral temporal cortex. Neuropsychologia, 83, 14–28. 10.1016/j.neuropsychologia.2015.07.024 [DOI] [PMC free article] [PubMed] [Google Scholar]
- Jaekl PM, & Soto-Faraco S (2010). Audiovisual contrast enhancement is articulated primarily via the M-pathway. Brain Research, 1366, 85–92. 10.1016/j.brainres.2010.10.012 [DOI] [PubMed] [Google Scholar]
- Jiang H, Schuele S, Rosenow J, Zelano C, Parvizi J, Tao JX, … Gottfried JA (2017). Theta Oscillations Rapidly Convey Odor-Specific Content in Human Piriform Cortex. Neuron, 94(1), 207–219.e4 10.1016/j.neuron.2017.03.021 [DOI] [PMC free article] [PubMed] [Google Scholar]
- Kagan I, Gur M, & Snodderly DM (2008). Saccades and drifts differentially modulate neuronal activity in V1: Effects of retinal image motion, position, and extraretinal influences. Journal of Vision, 8(14), 19–19. 10.1167/8.14.19 [DOI] [PubMed] [Google Scholar]
- Kaiser J, & Lutzenberger W (2001). Location changes enhance hemispheric asymmetry of magnetic fields evoked by lateralized sounds in humans. Neuroscience Letters, 314(1), 17–20. 10.1016/S0304-3940(01)02248-0 [DOI] [PubMed] [Google Scholar]
- Klimesch W, Sauseng P, Hanslmayr S, Gruber W, & Freunberger R (2007). Event-related phase reorganization may explain evoked neural dynamics. Neuroscience & Biobehavioral Reviews, 31(7), 1003–1016. [DOI] [PubMed] [Google Scholar]
- Lakatos P, O’Connell MN, Barczak A, Mills A, Javitt DC, & Schroeder CE (2009). The Leading Sense: Supramodal Control of Neurophysiological Context by Attention. Neuron, 64(3), 419–430. 10.1016/j.neuron.2009.10.014 [DOI] [PMC free article] [PubMed] [Google Scholar]
- Lu Z-L, Tse HC-H, Dosher BA, Lesmes LA, Posner C, & Chu W (2009). Intra- and cross-modal cuing of spatial attention: Time courses and mechanisms. Vision Research, 49(10), 1081–1096. 10.1016/j.visres.2008.05.021 [DOI] [PMC free article] [PubMed] [Google Scholar]
- Matusz PJ, Retsa C, & Murray MM (2016). The context-contingent nature of cross-modal activations of the visual cortex. Neuroimage, 125, 996–1004. [DOI] [PubMed] [Google Scholar]
- McDonald JJ, Störmer VS, Martinez A, Feng W, & Hillyard SA (2013). Salient Sounds Activate Human Visual Cortex Automatically. Journal of Neuroscience, 33(21), 9194–9201. 10.1523/JNEUROSCI.5902-12.2013 [DOI] [PMC free article] [PubMed] [Google Scholar]
- McDonald JJ, Teder-Sälejärvi WA, & Hillyard SA (2000). Involuntary orienting to sound improves visual perception. Nature, 407(6806), 906–908. [DOI] [PubMed] [Google Scholar]
- Mercier MR, Foxe JJ, Fiebelkorn IC, Butler JS, Schwartz TH, & Molholm S (2013). Auditory-driven phase reset in visual cortex: human electrocorticography reveals mechanisms of early multisensory integration. NeuroImage, 79, 19–29. 10.1016/j.neuroimage.2013.04.060 [DOI] [PMC free article] [PubMed] [Google Scholar]
- Naue N, Rach S, Strüber D, Huster RJ, Zaehle T, Körner U, & Herrmann CS (2011). Auditory Event-Related Response in Visual Cortex Modulates Subsequent Visual Responses in Humans. Journal of Neuroscience, 31(21), 7729–7736. 10.1523/JNEUROSCI.1076-11.2011 [DOI] [PMC free article] [PubMed] [Google Scholar]
- Noesselt T, Tyll S, Boehler CN, Budinger E, Heinze H-J, & Driver J (2010). Sound-Induced Enhancement of Low-Intensity Vision: Multisensory Influences on Human Sensory-Specific Cortices and Thalamic Bodies Relate to Perceptual Enhancement of Visual Detection Sensitivity. Journal of Neuroscience, 30(41), 13609–13623. 10.1523/JNEUROSCI.4524-09.2010/ [DOI] [PMC free article] [PubMed] [Google Scholar]
- Pelli DG (1997). The VideoToolbox software for visual psychophysics: Transforming numbers into movies. Spatial Vision, 10(4), 437–442. [PubMed] [Google Scholar]
- Plass J, Zweig LJ, Brang D, Suzuki S, & Grabowecky M (2015). Connections between primary auditory and primary visual cortices: Diffusion MRI Evidence. Poster presented at the 2015 International Multisensory Research Forum. [Google Scholar]
- Reveley C, Seth AK, Pierpaoli C, Silva AC, Yu D, Saunders RC, … Ye FQ (2015). Superficial white matter fiber systems impede detection of long-range cortical connections in diffusion MR tractography. Proceedings of the National Academy of Sciences, 112(21), E2820–E2828. 10.1073/pnas.1418198112 [DOI] [PMC free article] [PubMed] [Google Scholar]
- Rockland KS, & Ojima H (2003). Multisensory convergence in calcarine visual areas in macaque monkey. International Journal of Psychophysiology, 50(1–2), 19–26. 10.1016/S0167-8760(03)00121-1 [DOI] [PubMed] [Google Scholar]
- Romei V, Gross J, & Thut G (2012). Sounds Reset Rhythms of Visual Cortex and Corresponding Human Visual Perception. Current Biology, 22(9), 807–813. 10.1016/j.cub.2012.03.025 [DOI] [PMC free article] [PubMed] [Google Scholar]
- Sauseng P, Klimesch W, Gruber WR, Hanslmayr S, Freunberger R, & Doppelmayr M (2007). Are event-related potential components generated by phase resetting of brain oscillations? A critical discussion. Neuroscience, 146(4), 1435–1444. [DOI] [PubMed] [Google Scholar]
- Shams L, Kamitani Y, & Shimojo S (2002). Visual illusion induced by sound. Cognitive Brain Research, 14(1), 147–152. 10.1016/S0926-6410(02)00069-1 [DOI] [PubMed] [Google Scholar]
- Shipley T (1964). Auditory flutter-driving of visual flicker. Science, 145(3638), 1328–1330. [DOI] [PubMed] [Google Scholar]
- Spence C, & Driver J (1997). Audiovisual links in exogenous covert spatial orienting. Perception & Psychophysics, 59(1), 1–22. [DOI] [PubMed] [Google Scholar]
- Spence C (2013). Just how important is spatial coincidence to multisensory integration? Evaluating the spatial rule. Annals of the New York Academy of Sciences, 1296(1), 31–49. 10.1111/nyas.12121 [DOI] [PubMed] [Google Scholar]
- Teder-Sälejärvi WA, Hillyard SA, Röder B, & Neville HJ (1999). Spatial attention to central and peripheral auditory stimuli as indexed by event-related potentials. Cognitive Brain Research, 8(3), 213–227. 10.1016/S0926-6410(99)00023-3 [DOI] [PubMed] [Google Scholar]
- Thorne JD, & Debener S (2014). Look now and hear what’s coming: On the functional role of cross-modal phase reset. Hearing Research, 307, 144–152. 10.1016/j.heares.2013.07.002 [DOI] [PubMed] [Google Scholar]
- Yao L, & Peck CK (1997). Saccadic eye movements to visual and auditory targets. Experimental Brain Research, 115(1), 25–34. [DOI] [PubMed] [Google Scholar]