Abstract
Background: The liver coordinates a series of metabolic adaptations to maintain the energy balance of the system and provide adequate nutrients to key organs, tissues and cells during starvation. However, the mediators and underlying molecular mechanisms that mediate these fasting-induced adaptive responses remain unclear.
Materials and methods: Male wild-type C57BL/6J littermates (8-weeks-old) were intraperitoneally injected with MCC950 or vehicle, and then randomly divided into three groups: fed, fasted, and refed. Plasma IL1β and insulin levels were detected by ELISA kits. Plasma and hepatic metabolites were determined using commercial assay kits. HepaRG cell line was applied to verify the regulation of NLRP3 on lipogenesis.
Results: NOD-like receptor protein 3 (NLRP3) and its downstream inflammatory cytokines were significantly suppressed after 24 h fasting and recovered upon 6 h refeeding in plasma and liver tissues of mice. Moreover, fasting-induced hepatic steatosis and accompanied liver injury were ameliorated when mice were intraperitoneally injected with MCC950 (a selective NLRP3 inhibitor). Further study revealed that MCC950 suppressed sterol regulatory element-binding protein-1c (SREBP-1c) expression and transcriptional activity, thus inhibited lipogenesis in the liver, which may explain its role in stabilizing lipid metabolism.
Conclusion: The NLRP3 inhibitor-MCC950 protects against fasting-induced hepatic steatosis. The novel and critical role of NLRP3 in lipogenesis may explain its importance in regulating the adaptive responses of the liver upon starvation stress and may provide therapeutic value.
Keywords: metabolic homeostasis, starvation stress, NLRP3, MCC950, SREBP-1c
Video abstract
Point your SmartPhone at the code above. If you have a QR code reader the video abstract will appear. Or use:
Introduction
The deregulation of metabolic homeostasis leads to metabolic disorders such as fatty liver disease, obesity and diabetes.1,2 The liver functions as a major metabolic regulator for maintaining metabolic homeostasis, allowing extrahepatic tissues such as adipose and muscle to function normally under overnutrition or starvation.3–5 During starvation, the liver coordinates a series of metabolic adaptations to maintain the energy balance of the system and provide adequate nutrients to key organs, tissues and cells.6,7 These regulatory mechanisms in the liver include supplying glucose to the circulation, initially from hepatic glycogen and then by gluconeogenesis produced from other non-carbohydrate materials.8 In a sustained fasting state, ketones are synthesized by the liver to provide an energy source to replace glucose for high-oxygen consuming tissues.9,10 Fatty acid oxidation is considered to be critical for providing ATP and NADP to facilitate glycogenesis and acetyl-CoA for ketogenesis.11,12 Accumulating studies have revealed that many molecules participate in regulating hepatic metabolism during fasting or other physiological states, including sterol regulatory element-binding protein-1c (SREBP-1c),13 peroxisome proliferator-activated receptor-alpha,5,14 glucocorticoid receptor , cAMP responsive element binding protein 1, and CCAAT/enhancer binding protein beta.15 It would be valuable to discover novel mediator(s) to further understand the regulation of liver function upon starvation stress.
NOD-like receptor protein 3 (NLRP3)-inflammasomes, composed of NLRP3, adapter protein ACS and pro-caspase 1, is an important regulator of the activation of caspase1 and the maturation of IL1β. It can be activated by multiple mediators, including metabolic disturbance.16,17 Previous studies mainly discussed the function of NLRP3 in macrophages where it is abundantly expressed. During the last few years, researchers indicated that NLRP3 inflammasome is closely related to the pathogenesis of most acute and chronic liver injuries,18,19 increased expression of hepatic NLRP3, ACS and caspase-1 accompanies with liver inflammation in non-alcoholic fatty liver disease and non-alcoholic steatohepatitis, which suggests a strong link between NLRP3 inflammasomes and hepatic dysfunction. Although NLRP3 inflammasome is highly expressed in liver, the regulatory mechanism of NLRP3 inflammasome on lipid synthesis, fatty acid oxidation, and transport in hepatocytes remains unknown.
In the present study, we discovered that the NLRP3 is involved in the regulation of fasting-induced hepatic steatosis and hepatic lipogenesis in hepatocytes. Its inhibitor MCC950 restrained SREBP-1c expression and transcriptional activation and reduced lipogenesis-associated gene expression, which suggests that NLRP3 is a critical regulator of metabolic homeostasis upon starvation stress.
Materials and methods
Animals and treatment
Male wild-type C57BL/6J littermates (8-weeks-old) were randomly divided into three groups: fed, fasted, and refed, as described previously.20 The fed group was fed a normal chow diet; the fasted group was fasted for 24 hrs; and the refed group was fasted for 24 hrs, followed by 6 hrs of refeeding prior to the end of the experiment. MCC950 or vehicle was administered intraperitoneally at a dose of 10 mg/kg prior to diet deprivation or refeeding. The animals were housed in standard cages at 22°C in a 12/12-hrs light/dark cycle. When the mice were sacrificed, blood samples were collected, and tissues were taken rapidly and fixed or stored in liquid nitrogen. All animal experiments were conducted in accordance with the National Institutes of Health Guide for the Care and Use of Laboratory Animals and approved by the Ethical Committee of Huazhong University of Science and Technology.
Western blot analysis
Tissue samples were lysed at 4°C with RIPA buffer containing protease and phosphatase inhibitors. Forty micrograms of protein, as measured by a standard bicinchoninic acid assay (BSA) kit, were loaded onto 10% SDS-polyacrylamide gels for electrophoresis. Then, proteins were transferred to polyvinylidene difluoride membranes and blocked with 5% dry milk for 2 hrs at room temperature. Next, the membranes were probed with primary antibodies overnight at 4°C and incubated with secondary horseradish peroxidase antibodies for 1 hrs. Subsequently, the proteins were detected with a Bio-Rad (Hercules, CA, USA) imaging system. The following antibodies were used: β-tubulin (1:1,000 dilution, ab6046, Abcam), NLRP3 (1:1,000 dilution, 15101, Cell Signaling Technology), Caspase1 (1:1,000 dilution, NBP1-45433, Novus), IL1β (1:1,000 dilution, 12242, Cell Signaling Technology), FASN (1:1,000 dilution, 3180, Cell Signaling Technology), ACC1 (1:1,000 dilution, 4190, Cell Signaling Technology), and SREBP-1c (1:1,000 dilution, ab28481, Abcam).
ELISA
The concentration of IL1β in plasma was measured by ELISA kits (MLB00C, R&D Systems, Minneapolis, MN, USA), according to the manufacturer’s instructions. Absorbance at 450 nm was measured using a microplate reader (Thermo Fisher Scientific), and the 450 nm absorbance values were corrected by subtracting the reading at 570 nm.
Measurement of plasma and hepatic metabolites
Blood glucose concentrations were determined using a glucometer. Mouse plasma insulin was measured with an ultrasensitive mouse insulin ELISA kit (Millipore, Billerica, MA, USA). Liver lipid contents were extracted as previously described;21 Plasma and liver triglyceride and cholesterol levels were detected using commercial assay kits [290–63,701 and 294–65,801 for triglyceride and cholesterol, respectively; Wako, Osaka, Japan] according to the manufacturer’s instructions.
Oil red O staining
Livers were immersed in OCT and kept at −80°C until use. After 5 mins of drying, frozen sections were incubated with oil red O, washed with 60% isopropanol, and counterstained with Mayer’s hematoxylin and saturated lithium carbonate. The images were captured on a light microscope.
Quantitative real-time qPCR
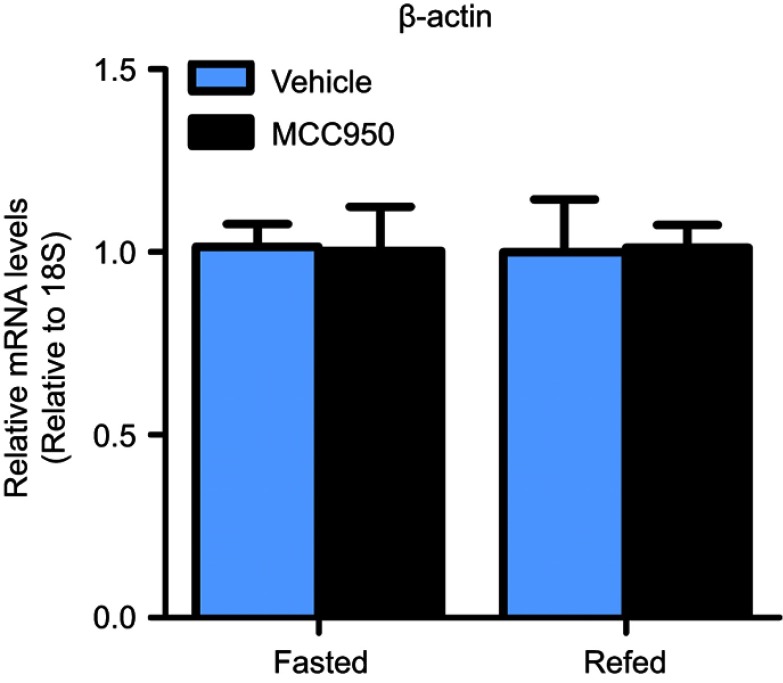
Tissue samples were homogenized with TRIzol reagent (Invitrogen, USA); total RNA was isolated and treated with RNase-free DNase to remove genomic DNA, and then reverse transcribed into cDNA by using a PrimeScript RT reagent kit (Takara, China). Real-time qPCR was performed using an ABI 7500 real-time PCR system and SYBR Green PCR Master Mix (Takara, China) in duplicate. StepOne Software v2.3 (Applied Biosystems, Waltham, MA, USA) was used to analyze the results with the 2−△△CT-method after normalization to β-actin levels (18s was used to determine that β-actin does not change between groups; Figure S1).
The primers applied to real-time qPCR were as follows:
18S-Forward: 5‘-TTGACGGAAGGGCACCACCAG-3ʹ; 18S-Reverse: 5ʹ-GCACCACCACCCACGGAATCG-3ʹ; β-actin-Forward: 5ʹ-AACAGTCCGCCTAGAAGCAC-3ʹ; β-actin-Reverse: 5ʹ-CGTTGACATCCGTAAAGACC-3ʹ; IL1β-Forward: 5ʹ-GAAATGCCACCTTTTGACAGTG-3ʹ; IL1β-Reverse: 5ʹ-TGGATGCTCTCATCAGGACAG-3ʹ; SREBP1c-Forward: 5ʹ-GCAGCCACCATCTAGCCTG-3ʹ; SREBP1c-Reverse: 5ʹ-CAGCAGTGAGTCTGCCTTGAT-3ʹ; FASN-Forward: 5ʹ-GGAGGTGGTGATAGCCGGTAT-3ʹ; FASN-Reverse: 5ʹ-TGGGTAATCCATAGAGCCCAG-3ʹ; ACC1-Forward: 5ʹ-ATGGGCGGAATGGTCTCTTTC-3ʹ; ACC1-Reverse: 5ʹ-TGGGGACCTTGTCTTCATCAT-3ʹ; ACOX-Forward: 5ʹ-TAACTTCCTCACTCGAAGCCA-3ʹ; 18S-Reverse: 5ʹ-AGTTCCATGACCCATCTCTGTC-3ʹ; CPT1a-Forward: 5ʹ-TGGCATCATCACTGGTGTGTT-3ʹ; 18S-Reverse: 5ʹ-GTCTAGGGTCCGATTGATCTTTG-3ʹ; MCAD-Forward: 5ʹ-AGGGTTTAGTTTTGAGTTGACGG-3ʹ; 18S-Reverse: 5ʹ-CCCCGCTTTTGTCATATTCCG-3ʹ; CD36-Forward: 5ʹ-ATGGGCTGTGATCGGAACTG-3ʹ; 18S-Reverse: 5ʹ-GTCTTCCCAATAAGCATGTCTCC-3ʹ; FABP1-Forward: 5ʹ-ATGAACTTCTCCGGCAAGTACC-3ʹ; 18S-Reverse: 5ʹ-CTGACACCCCCTTGATGTCC-3ʹ; DGAT1-Forward: 5ʹ-TCCGTCCAGGGTGGTAGTG-3ʹ; 18S-Reverse: 5ʹ-TGAACAAAGAATCTTGCAGACGA-3ʹ;
Cell line and culture
HepaRG cells (HepaRGC10) were purchased from Gibco (Thermo Fisher Scientific, Waltham, MA, USA) and cultured as described in the manufacturer’s instructions. Cells were cultured at 37°C with 5% CO2 in a humidified atmosphere. After 24 hrs of serum starvation, the cells were treated as described below.
Luciferase reporter assays
A human SREBP-1c promoter-driven luciferase plasmid encoding a 5ʹ-flanking fragment of the SREBP-1c (−1005/+24) promoter was described previously.22 Transfections in HepaRG cells were performed in triplicate in 24-well plates. After overnight starvation, 250 ng of SREBP-1c promoter reporter plasmids or empty vector, together with pRL-TK encoding Renilla luciferase, were co-transfected by using Lipofectamine 2000. After transfection, cells were treated with 250 µM BSA-conjugated palmitic acid (P5585, Sigma, St Louis, MO, USA) or vehicle, in the presence or absence of MCC950. Luciferase activity was measured 24 hrs later using a Dual-Luciferase Reporter Assay System (Promega, Fitchburg, WI, USA), and normalized to Renilla luciferase activity.
Chromatin immunoprecipitation (ChIP)
Chromatin immunoprecipitation (ChIP) experiments were performed exactly as described previously.23,24 Liver tissues were subjected to cross-linking with 1% formaldehyde before the preparation of nuclear extracts. Chromatin-SREBP-1c complexes were immunoprecipitated with anti-SREBP-1c or rabbit IgG (Cell Signaling Technology) by incubation at 4°C overnight on a rocking platform, and then were incubated with the beads from the ChIP kit at 4°C for 2 hrs with gentle rocking. After washing sufficiently with the washing buffer, the complexes were eluted with the elution buffer from the beads, and the extracted DNA from the final step was quantified by PCR to amplify the FASN and ACC1 promoters. The primers were as follows: mouse FASN: forward, 5′-TCACATCAGGGGACAGTTAG-3′; reverse, 5′-TAAGCAAATAGAGAACTCCC-3′; mouse ACC1: forward, 5′-GTCCCGCCTCCTCCAGT-3′; reverse, 5′-GACTTCAGAGCCCACCGAC-3′; The raw Ct values of the ChIP samples were divided by the Ct values of the relevant input samples, and the values were presented as the percentage of the input values (% input).
Statistical analysis
GraphPad Prism 5.0 software (GraphPad Software, Inc., La Jolla, CA, USA) was used for statistical analysis. Band densitometry of the Western blot images was quantified with ImageJ Software. All data are presented as the mean ± SEM. Comparisons between two groups were conducted by Student’s t test, and one-way ANOVA was used to assess the statistical significance among multiple groups. P<0.05 was considered statistically significant. All data are representative of three independent experiments.
Results
The NLRP3-inflammasome is inhibited by nutrient deprivation and triggered by refeeding
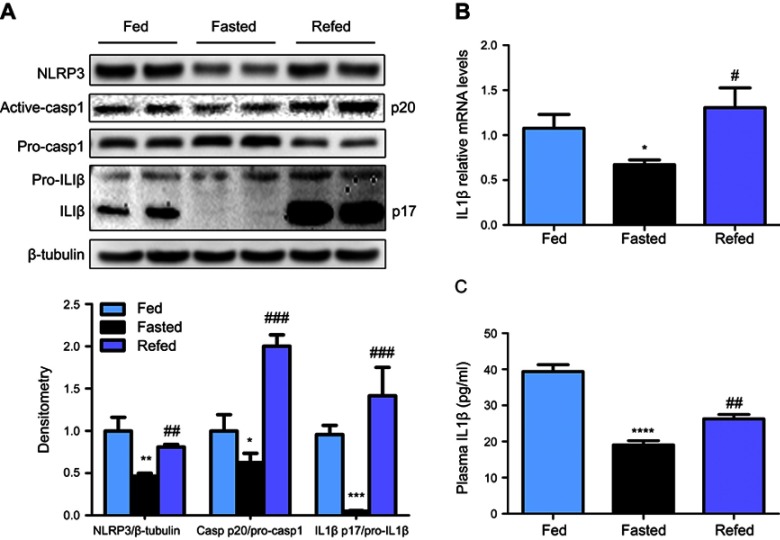
To investigate whether the NLRP3-inflammasome is involved in fasting-induced hepatic steatosis, we measured hepatic NLRP3, pro-casp1, active casp1, pro-IL1β and active IL1β expression levels. We found that NLRP3, active casp1 and IL1β were decreased after 24 hrs of fasting and recovered upon refeeding in mice (Figure 1A). Meanwhile, the mRNA and plasma levels of IL1β showed a parallel change (Figure 1B-C). These data indicate the potential role of the NLRP3-inflammasome in fasting-induced hepatic steatosis.
Figure 1.
NLRP3-inflammasome is inhibited by nutrient deprivation and triggered by refeeding. (A) Western blot and densitometric analysis for NLRP3, active-casp1 and IL1β in liver of fed, fasted, and refed mice, with n=6 per group. (B) Relative mRNA levels of IL1β in liver of fed, fasted, and refed mice, with n=8 per group. (C) ELISA assay detected plasma levels of IL1β in fasting and refeeding mice, with n=8 per group. * P˂0.05, ** P˂0.01, *** P˂0.001 and **** P˂0.0001 compared to the fed group; # P˂0.05, ## P˂0.01 and ### P˂0.001 compared to the fasted group.
MCC950 effectively inhibits IL1β secretion and ameliorates fasting-induced hepatic lipid deposition
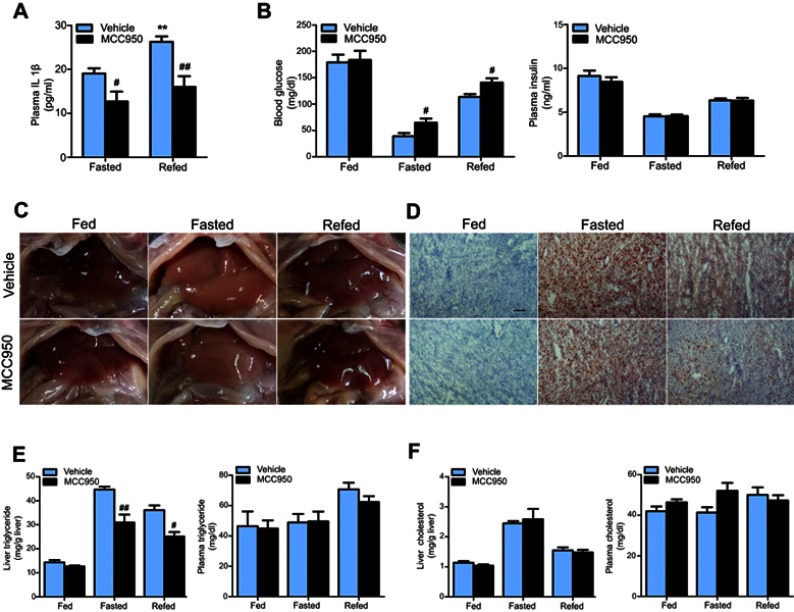
To explore whether inhibition of the NLRP3-inflammasome plays a role in fasting-induced lipid instability, we treated mice with MCC950 prior to diet deprivation or refeeding. As shown in Figure 2A, the circulating IL1β levels were increased by refeeding and were significantly decreased by MCC950 compared to that of vehicle. MCC950 administration increased blood glucose levels both in fasted mice and refed mice, while without having an impact on plasma insulin levels (Figure 2B). In the liver, fasting-induced lipid deposition was significantly ameliorated by administration of MCC950, as confirmed by the macroscopic appearance of the liver and Oil red O staining (Figure 2C and D). Further quantitative analysis revealed that MCC950 reduced the triglyceride content in liver but not in plasma compared to that of the vehicle (Figure 2E). However, there were no significant changes in cholesterol levels between the different groups (Figure 2F). The results show that the inhibition of NLRP3 largely reduced hepatic lipid deposition.
Figure 2.
MCC950 effectively inhibits IL1β secretion and ameliorates fasting-induced hepatic lipid deposition. (A) Plasma levels of IL1β were decreased by MCC950 administration. (B) Blood glucose and plasma insulin levels in vehicle or MCC950 treated mice after fasting for 24 hrs or followed by n6 h-refeeding. (C) Hepatic macroscopic appearance of different groups. (D) Representative Oil red O staining of frozen liver sections. Hepatic and plasma triglyceride, the scale bar is 100 um. (E) and cholesterol (F) levels in vehicle or MCC950 treated mice after fasting or refeeding. n=8 per group. ** P˂0.01 compared to the fasted group treated with vehicle, # P˂0.05 and ## P˂0.01 compared to the vehicle group under the same diet treatment.
MCC950 alters the expression of key genes related to lipogenesis in the liver
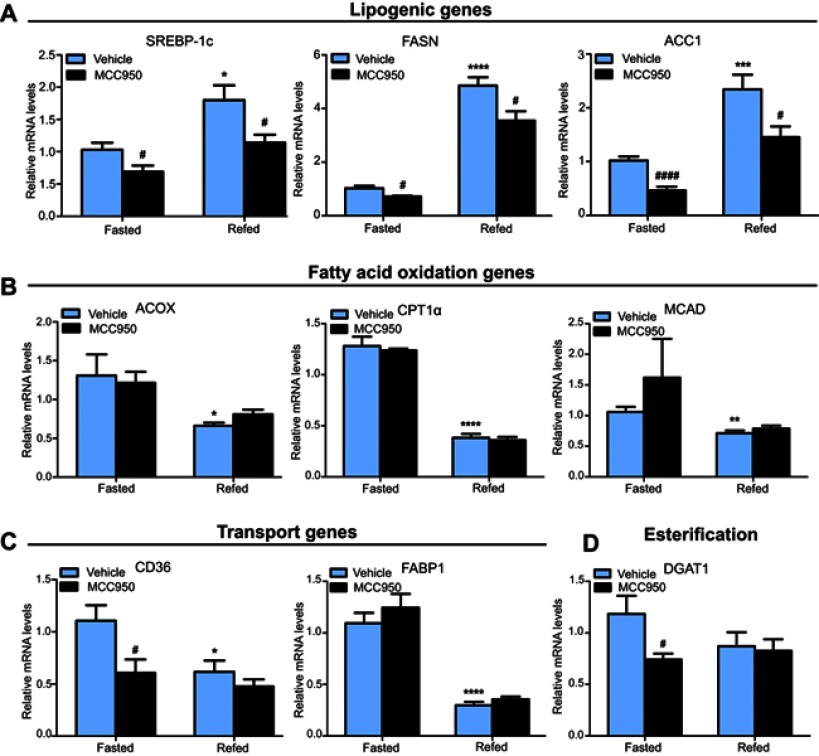
To examine the latent mechanism of MCC950 on hepatic steatosis, we examined metabolic-associated genes in the liver. Real-time qPCR revealed that lipogenesis-related genes (eg, SREBP-1c, FASN, and ACC1) were suppressed in the MCC950 group compared to those of the vehicle group both in fasted and refed mice (Figure 3A), while fatty acid utilization-related genes (eg, ACOX, CPT1a, and MCAD) were unaltered by MCC950 treatment (Figure 3B). However, genes related to fatty acid transportation (eg, CD36, and FABP1) or esterification (eg, DGAT1) showed no consistent changes either in starvation or refeeding (Figure 3C-D). Therefore, the improvement of MCC950 on fasting-induced hepatic steatosis is mainly through the amelioration of intrahepatic lipogenesis.
Figure 3.
MCC950 alters the expression of key genes related to lipogenesis in the liver. (A) Hepatic lipogenesis-related genes such as SREBP-1c, FASN, and ACC1 were acutely induced by refeeding and inhibited in MCC950 treated mice. (B-D) Effects of MCC950 treatment on fatty acid β-oxidation (ACOX, CPT1α, and MCAD), transportation (CD36, and FABP1), and esterification (DGAT1) compared to that of vehicle-treated group. n=8 per group. * P˂0.05, ** P˂0.01, *** P˂0.001, and **** P˂0.0001 compared to the fasted group treated with vehicle, # P˂0.05 and #### P˂0.0001 compared to the vehicle group under the same diet treatment.
MCC950 suppressed SREBP-1c expression and its regulatory effect on lipogenesis
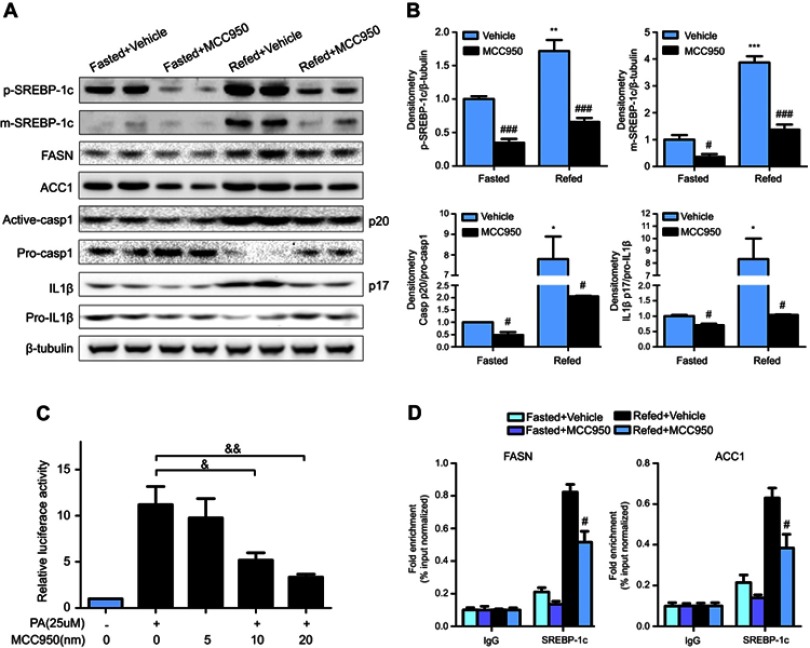
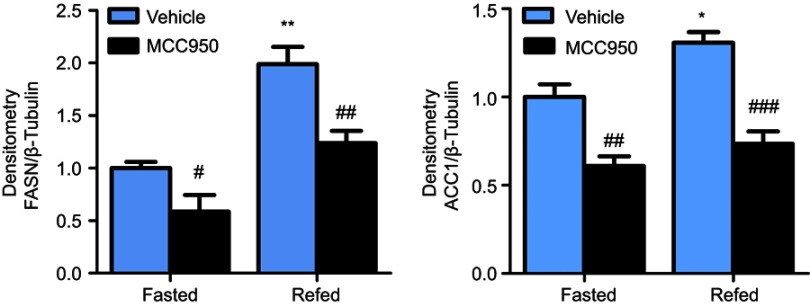
To further delineate the mechanisms responsible for the phenotype in MCC950 challenged mice, the levels of proteins involved in lipogenesis were examined. As shown in Figure 4A-B, the nuclear form and precursor of SREBP-1c were increased upon refeeding, while MCC950 treatment remarkably inhibited the expression of the nuclear form and precursor of SREBP-1c both in fasted and refed state. Accordantly, the target genes of SREBP-1c (eg, ACC1, and FASN) were also attenuated by MCC950 treatment (Figure S2). In vitro, NLRP3-inflammasome can be activated by PA and inhibited by MCC950 (Figure S3). To further confirm the role of MCC950 on SREBP-1c, we detected an effect of MCC950 on SREBP-1c transcriptional activity which was induced by PA in HepaRG cells using a luciferase reporter gene assay. As shown in Figure 4C, SREBP-1c promoter activity was inhibited by MCC950 in a dose-dependent manner. In addition, the binding of SREBP-1c to its target genes (eg, FASN and ACC1) was slightly decreased during starvation, while prominently reduced after refeeding, as analyzed by the ChIP assay in the liver tissues of mice (Figure 4D). Collectively, these results indicate that MCC950 inhibits SREBP-1c expression and transcriptional activity, suppresses lipogenesis-related genes expression, thus ameliorates nutrient instability-induced steatosis.
Figure 4.
MCC950 inhibits SREBP-1c expression and prevents its regulation on downstream target genes. (A) Metabolism-related signaling pathway was detected by Western blot in fasted and refed mice challenged with MCC950 or vehicle, with β-tubulin as a loading control. (B) Quantitative results of the protein levels of mature or precursors SREBP-1c, Casp1, IL1β. * P˂0.05, ** P˂0.01 and *** P˂0.001 compared to the fasted group treated with vehicle, # P˂0.05 and ### P˂0.001 compared to the vehicle group under the same diet treatment. (C) Normalized activities of the luciferase reporters analyzing the effect of MCC950 on SREBP-1c promoter activation which was induced by PA in HepaRG cells. & P<0.05 and && P<0.01. (D) Chromatin immunoprecipitation (ChIP) assay using chromatin isolated from livers of mice after fasting or refeeding. Nuclear extracts were immunoprecipitated with an anti-SREBP-1c antibody, and purified DNA was subjected to qPCR by specific primers located at the promoter region of mouse FASN and ACC1. # P˂0.05 compared to the refed group treated with vehicle.
Discussion
Mammals have developed multiple mechanisms for accommodating changes in the environment, such as changes in food availability.25 Liver, as the central organ in regulating metabolism,4 plays an irreplaceable role in maintaining nutrient stability during starvation and refeeding, and also is subjected to various nutrient stress,26 such as lipotoxic, inflammation.27 NLRP3 is a member of the NLR family, activation of the NLRP3-inflammasome increases caspase1 activation and IL1β production, which indicate that NLRP3 is an important regulator of the inflammatory response. Recent studies show that activation of the NLRP3-inflammasome is associated with metabolic dysfunction,28 which provides us with new insight into whether and how NLRP3 can regulate lipid metabolism.
The NLRP3-inflammasome was suppressed during starvation, but was rescued after refeeding, along with the activation of caspase1 and increased maturation of IL1β. When we intraperitoneally injected the mice with the selective NLRP3 inhibitor MCC950, we observed the amelioration of the fasting-induced liver lipid accumulation, which demonstrated a novel role of NLRP3 in the regulation of fasting-induced hepatic steatosis.
Additionally, we examined several pathways associated with lipid metabolism (lipogenesis, fatty acid oxidation, lipid transportation and esterification) and their effector molecules. MCC950 significantly inhibited genes expression related to lipogenesis, while the genes involved in fatty acid oxidation, including ACOX, CPT1α and MCAD showed no obvious changes. This finding suggested that the protective effects of MCC950 in fasting-induced hepatic steatosis and the accompanying metabolic system changes are mainly due to the inhibition of lipogenesis.
SREBP-1c is a master regulator of genes involved in lipogenesis and plays an important regulatory role in lipid metabolism. Further exploring the underlying the mechanism of MCC950 in the regulation of hepatic lipogenesis, we detected a reduction of mature form and precursors of SREBP-1c in the liver when injected with MCC950. We stimulated lipid deposition in vitro using a HepaRG cell line that was treated with palmitic acid29,30 and challenged with MCC950, which resulted in the concentration-dependent suppression of SREBP-1c promoter activity in the luciferase assay. Chromatin immunoprecipitation (ChIP) assays of liver tissue also showed that MCC950 remarkably attenuated the transcription of its downstream target genes (FASN and ACC1).
The most important finding of our work is that NLRP3-inflammasome accelerated lipogenesis in hepatocytes, for its inhibitor MCC950 suppressed the transcription activity of SREBP-1c and its target genes FASN and ACC1. Intraperitoneal injection of MCC950 not only affected the activity of NLRP3-inflammasome in hepatocytes, but also inhibited the inflammatory response of kupffer cells (KCs; macrophages in the liver), which is a limitation of our study. Although we demonstrated that MCC950 reduced SREBP-1c transcription while inhibiting NLRP3-inflammasome activation, we do not know whether KCs are involved in this regulatory relationship. The crosstalk between KCs and hepatocytes is worth exploring, and we will do further researches in this field.
In conclusion, our findings establish a new role for NLRP3 and its inhibitor MCC950 in the regulation of lipogenesis and metabolic disorders after exposure to starvation or refeeding. The inhibition of NLRP3 could ameliorate lipid accumulation, liver injury and dyslipidemia, which may prospect its importance in regulating the adaptive responses of the liver upon starvation stress, and provide therapeutic value.
Acknowledgments
This work was supported by National Natural Science Foundation of China (No: 81670351) and Graduates’ Innovation Fund, Huazhong University of Science and Technology (No: 5003530056 and 5003530057). Dr Baoqing Liu and Dr Xiaoxiang Mao contributed equally as co-first authors.
Disclosure
The authors report no conflicts of interest in this work.
Supplementary materials
References
- 1.Neuschwander-Tetri BA. Hepatic lipotoxicity and the pathogenesis of nonalcoholic steatohepatitis: the central role of nontriglyceride fatty acid metabolites. Hepatology. 2010;52(2):774–788. doi: 10.1002/hep.23719 [DOI] [PubMed] [Google Scholar]
- 2.Tilg H, Moschen AR. Evolution of inflammation in nonalcoholic fatty liver disease: the multiple parallel hits hypothesis. Hepatology. 2010;52(5):1836–1846. doi: 10.1002/hep.24001 [DOI] [PubMed] [Google Scholar]
- 3.Goedeke L, Bates J, Vatner DF, et al. Acetyl-CoA carboxylase inhibition reverses NAFLD and hepatic insulin resistance but promotes hypertriglyceridemia in rodents. Hepatology. 2018;68(6):2197–2211. doi: 10.1002/hep.30097 [DOI] [PMC free article] [PubMed] [Google Scholar]
- 4.Cahill GF Jr. Fuel metabolism in starvation. Annu Rev Nutr. 2006;26:1–22. doi: 10.1146/annurev.nutr.26.061505.111258 [DOI] [PubMed] [Google Scholar]
- 5.Hashimoto T, Cook WS, Qi C, Yeldandi AV, Reddy JK, Rao MS. Defect in peroxisome proliferator-activated receptor alpha-inducible fatty acid oxidation determines the severity of hepatic steatosis in response to fasting. J Biol Chem. 2000;275(37):28918–28928. doi: 10.1074/jbc.M910350199 [DOI] [PubMed] [Google Scholar]
- 6.Xu J, Donepudi AC, Moscovitz JE, Slitt AL, Makishima M. Keap1-knockdown decreases fasting-induced fatty liver via altered lipid metabolism and decreased fatty acid mobilization from adipose tissue. PLoS One. 2013;8(11):e79841. doi: 10.1371/journal.pone.0079841 [DOI] [PMC free article] [PubMed] [Google Scholar]
- 7.Rouvinen-Watt K, Mustonen AM, Conway R, et al. Rapid development of fasting-induced hepatic lipidosis in the American mink (neovison vison): effects of food deprivation and re-alimentation on body fat depots, tissue fatty acid profiles, hematology and endocrinology. Lipids. 2010;45(2):111–128. doi: 10.1007/s11745-009-3377-4 [DOI] [PubMed] [Google Scholar]
- 8.Liang Q, Zhong L, Zhang J, et al. FGF21 maintains glucose homeostasis by mediating the cross talk between liver and brain during prolonged fasting. Diabetes. 2014;63(12):4064–4075. doi: 10.2337/db14-0541 [DOI] [PubMed] [Google Scholar]
- 9.Veech RL, Chance B, Kashiwaya Y, Lardy HA, Cahill GF Jr. Ketone bodies, potential therapeutic uses. IUBMB Life. 2001;51(4):241–247. doi: 10.1080/152165401753311780 [DOI] [PubMed] [Google Scholar]
- 10.Bae HR, Kim DH, Park MH, et al. beta-hydroxybutyrate suppresses inflammasome formation by ameliorating endoplasmic reticulum stress via AMPK activation. Oncotarget. 2016;7(41):66444–66454. doi: 10.18632/oncotarget.12119 [DOI] [PMC free article] [PubMed] [Google Scholar]
- 11.Cotter DG, d‘Avignon DA, Wentz AE, Weber ML, Crawford PA. Obligate role for ketone body oxidation in neonatal metabolic homeostasis. J Biol Chem. 2011;286(9):6902–6910. doi: 10.1074/jbc.M110.192369 [DOI] [PMC free article] [PubMed] [Google Scholar]
- 12.Lee J, Choi J, Scafidi S, Wolfgang MJ. Hepatic fatty acid oxidation restrains systemic catabolism during starvation. Cell Rep. 2016;16(1):201–212. doi: 10.1016/j.celrep.2016.05.062 [DOI] [PMC free article] [PubMed] [Google Scholar]
- 13.Horton JD, Goldstein JL, Brown MS. SREBPs: activators of the complete program of cholesterol and fatty acid synthesis in the liver. J Clin Invest. 2002;109(9):1125–1131. doi: 10.1172/JCI15593 [DOI] [PMC free article] [PubMed] [Google Scholar]
- 14.Langhi C, Baldan A. CIDEC/FSP27 is regulated by peroxisome proliferator-activated receptor alpha and plays a critical role in fasting- and diet-induced hepatosteatosis. Hepatology. 2015;61(4):1227–1238. doi: 10.1002/hep.27607 [DOI] [PMC free article] [PubMed] [Google Scholar]
- 15.Goldstein I, Baek S, Presman DM, Paakinaho V, Swinstead EE, Hager GL. Transcription factor assisted loading and enhancer dynamics dictate the hepatic fasting response. Genome Res. 2017;27(3):427–439. doi: 10.1101/gr.212175.116 [DOI] [PMC free article] [PubMed] [Google Scholar]
- 16.Csak T, Ganz M, Pespisa J, Kodys K, Dolganiuc A, Szabo G. Fatty acid and endotoxin activate inflammasomes in mouse hepatocytes that release danger signals to stimulate immune cells. Hepatology. 2011;54(1):133–144. doi: 10.1002/hep.24341 [DOI] [PMC free article] [PubMed] [Google Scholar]
- 17.Ratsimandresy RA, Dorfleutner A, Stehlik C. An update on PYRIN domain-containing pattern recognition receptors: from immunity to pathology. Front Immunol. 2013;4:440. doi: 10.3389/fimmu.2013.00440 [DOI] [PMC free article] [PubMed] [Google Scholar]
- 18.Maher JJ, Leon P, Ryan JC. Beyond insulin resistance: innate immunity in nonalcoholic steatohepatitis. Hepatology. 2008;48(2):670–678. doi: 10.1002/hep.22399 [DOI] [PMC free article] [PubMed] [Google Scholar]
- 19.Gao B. Innate immunity and steatohepatitis: a critical role of another toll (TLR-9). Gastroenterology. 2010;139(1):27–30. doi: 10.1053/j.gastro.2010.05.018 [DOI] [PMC free article] [PubMed] [Google Scholar]
- 20.Ponugoti B, Kim DH, Xiao Z, et al. SIRT1 deacetylates and inhibits SREBP-1C activity in regulation of hepatic lipid metabolism. J Biol Chem. 2010;285(44):33959–33970. doi: 10.1074/jbc.M110.122978 [DOI] [PMC free article] [PubMed] [Google Scholar]
- 21.Huang D, Liu B, Huang K, Huang K. Enoyl coenzyme A hydratase 1 protects against high-fat-diet-induced hepatic steatosis and insulin resistance. Biochem Biophys Res Commun. 2018;499(3):403–409. doi: 10.1016/j.bbrc.2018.03.052 [DOI] [PubMed] [Google Scholar]
- 22.Gao LL, Li M, Wang Q, Liu SA, Zhang JQ, Cheng J. HCBP6 modulates triglyceride homeostasis in hepatocytes via the SREBP1c/FASN pathway. J Cell Biochem. 2015;116(10):2375–2384. doi: 10.1002/jcb.25188 [DOI] [PubMed] [Google Scholar]
- 23.Da Silva Xavier G, Rutter GA, Diraison F, Andreolas C, Leclerc I. ChREBP binding to fatty acid synthase and L-type pyruvate kinase genes is stimulated by glucose in pancreatic beta-cells. J Lipid Res. 2006;47(11):2482–2491. doi: 10.1194/jlr.M600289-JLR200 [DOI] [PubMed] [Google Scholar]
- 24.Zhang M, Sun W, Qian J, Tang Y. Fasting exacerbates hepatic growth differentiation factor 15 to promote fatty acid beta-oxidation and ketogenesis via activating XBP1 signaling in liver. Redox Biol. 2018;16:87–96. doi: 10.1016/j.redox.2018.01.013 [DOI] [PMC free article] [PubMed] [Google Scholar]
- 25.Newman JC, Verdin E. beta-hydroxybutyrate: a signaling metabolite. Annu Rev Nutr. 2017;37:51–76. doi: 10.1146/annurev-nutr-071816-064916 [DOI] [PMC free article] [PubMed] [Google Scholar]
- 26.Khambu B, Yan S, Huda N, Liu G, Yin XM. Homeostatic role of autophagy in hepatocytes. Semin Liver Dis. 2018;38(4):308–319. doi: 10.1055/s-0038-1669939 [DOI] [PubMed] [Google Scholar]
- 27.Chrysikos D, Mariolis-Sapsakos T, Triantafyllou T, Karampelias V, Mitrousias A, Theodoropoulos G. Laparoscopic abdominoperineal resection for the treatment of a mucinous adenocarcinoma associated with an anal fistula. J Surg Case Rep. 2018;2018(3):rjy036. doi: 10.1093/jscr/rjy036 [DOI] [PMC free article] [PubMed] [Google Scholar]
- 28.Traba J, Kwarteng-Siaw M, Okoli TC, et al. Fasting and refeeding differentially regulate NLRP3 inflammasome activation in human subjects. J Clin Invest. 2015;125(12):4592–4600. doi: 10.1172/JCI83260 [DOI] [PMC free article] [PubMed] [Google Scholar]
- 29.Kanebratt KP, Andersson TB. Evaluation of HepaRG cells as an in vitro model for human drug metabolism studies. Drug Metab Dispos. 2008;36(7):1444–1452. doi: 10.1124/dmd.107.020016 [DOI] [PubMed] [Google Scholar]
- 30.Brown MV, Compton SA, Milburn MV, Lawton KA, Cheatham B. Metabolomic signatures in lipid-loaded HepaRGs reveal pathways involved in steatotic progression. Obesity (Silver Spring, Md). 2013;21(12):E561–E570. doi: 10.1002/oby.20440 [DOI] [PMC free article] [PubMed] [Google Scholar]
Associated Data
This section collects any data citations, data availability statements, or supplementary materials included in this article.


