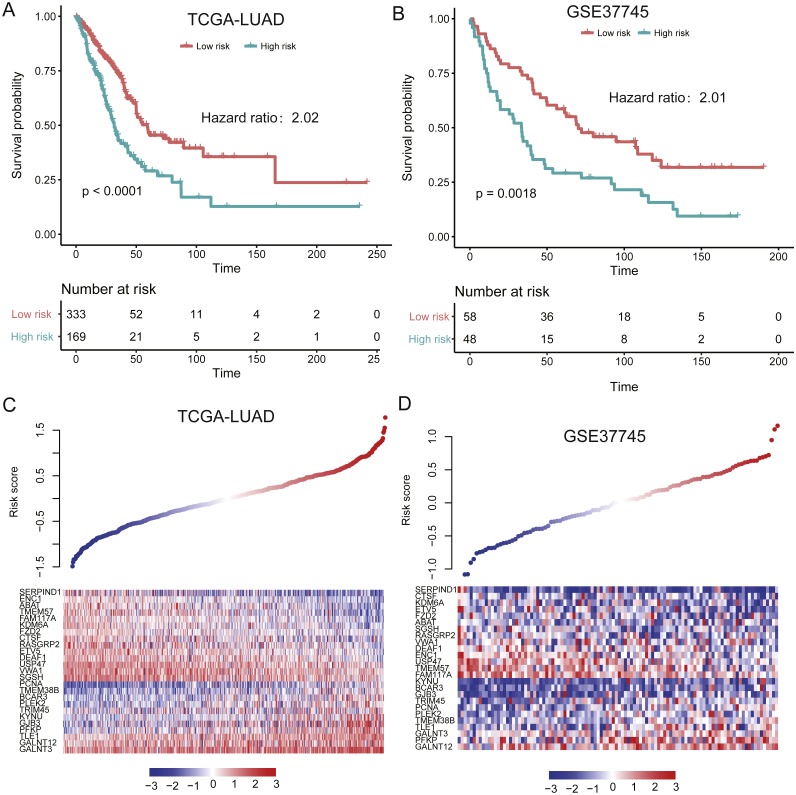
Figure 4. Performance of the prognostic model in two validation sets (TCGA and GSE37745).
(A and B) illustrate the significant difference of the overall survival between the high- and low-risk groups. The signatures of 25 genes showed differentially expressed patterns in the two validation sets (C and D).

