

Abstract
Measles, an acute viral disease, continues to be an important cause of childhood mortality worldwide. Infection with the measles virus is thought to be associated with a transient but profound period of immune suppression. Recently, it has been claimed that measles-induced immune manipulation lasts for about 30 months and results in increased susceptibility to other co-circulating infectious diseases and more severe disease outcomes upon infection. We tested this hypothesis using model-based inference applied to parallel historical records of measles and whooping cough mortality and morbidity. Specifically, we used maximum likelihood to fit a mechanistic transmission model to incidence data from three different eras, spanning mortality records from 1904 to 1912 and 1922 to 1932 and morbidity records from 1946 to 1956. Our aim was to quantify the timing, severity and pathogenesis impacts of measles-induced immune modulation and their consequences for whooping cough epidemiology across a temporal gradient of measles transmission. We identified an increase in susceptibility to whooping cough following recent measles infection by approximately 85-, 10- and 36-fold for the three eras, respectively, although the duration of this effect was variable. Overall, while the immune impacts of measles may be strong and clearly evident at the individual level, their epidemiological signature in these data appears both modest and inconsistent.
This article is part of the theme issue ‘Modelling infectious disease outbreaks in humans, animals and plants: approaches and important themes’. This issue is linked with the subsequent theme issue ‘Modelling infectious disease outbreaks in humans, animals and plants: epidemic forecasting and control’.
Keywords: measles, immune suppression, whooping cough, polymicrobial system, transmission model, maximum likelihood
1. Introduction
Understanding how infection with one pathogen can affect the severity, transmissibility or susceptibility to co-circulating pathogens and their epidemiological, medical and evolutionary implications is increasingly appreciated [1–4]. Such a ‘polymicrobial’ perspective [5,6] needs to take into account mechanisms that may be primarily ecological [2] or immunological [3] and may lead to interactions among pathogens that can be categorized as interference competition (resulting from cross immunity [7] or competition for susceptibles [8], and host resources (bottom-up control of population size via resource limitation) [9]), or facilitation (owing to, for example, antibody-dependent enhancement [10] and immune suppression [11]).
Historically, the potential interaction between infectious diseases was well recognized [12]. For instance, the medical historian Creighton [13] observed that the 1808 epidemic of measles in Glasgow was followed by many deaths attributed to whooping cough in 1809 and that while an association between the two pathogens was generally accepted, it was poorly understood. Similarly, Laing & Hay [14, p. 590] commented that ‘Most writers assert that there is an intimate association between epidemics of measles and epidemics of whooping cough, and that an epidemic strongly predisposes to the subsequent development of the latter’. Consistent with this, Coleman [15] reported an association between historical measles and whooping cough incidence in the USA, with peak whooping cough incidence lagging measles by approximately three to four weeks. Clinical reports of sequential infections have concluded that the order of exposure was important: whooping cough developing during a measles infection was likely to be more severe [16], while measles infection following whooping cough either had no effect on the severity of either disease [16] or served to ameliorate whooping cough symptoms [17]. As a result of previous empirical experiences, as far back as 1895, it was predicted that if the prevalence of measles could be reduced, it would diminish the death toll from both measles and whooping cough [18].
More recently, it has been shown that a reduction in measles transmission after the introduction of the vaccine was associated with a 23% decrease in all-cause mortality among children aged less than 5 years from 1990 to 2008 across the globe [19]. Mina et al. [20] revisited this topic and used population-level data to document the roll out of measles immunization coinciding with declines in non-measles infectious disease deaths. These authors cited ample immunological evidence to explain their findings. Specifically, it is known that infection with the measles virus (MV) initiates in macrophages and dendritic cells in the respiratory tract, followed by rapid spread to T- and B-lymphocytes in the draining lymphoid tissues, and then to multiple organs [11]. Subsequent infection of the cellular receptor of the MV results in a partial depletion of memory lymphocyte repertoire, which is masked by the rapid expansion of MV-specific lymphocytes, leading to ‘immune amnesia’ [21]. Measles immune suppression extends for several weeks to months [11,22]. Challenge studies of measles infection in non-human primates have shown that while infectious virus is rapidly cleared, MV RNA persists in blood for up to three months after infection. The persistence of viral RNA is thought to be responsible for the prolonged immune suppression; however, this causal relationship is not conclusively established [23,24]. Mina et al. [20] found that their best-fitting model assumed a mean duration of measles-induced immuno-modulation of approximately 30 months.
These prior studies motivated us to examine the consequences of transient measles-induced immune suppression on the epidemiology and pathogenesis of subsequent exposure to whooping cough. Whooping cough is a highly contagious disease of the respiratory tract caused primarily by the bacterium Bordetella pertussis [25]. We chose to examine the interaction of measles with whooping cough both because of the historical literature regarding their suspected association [13,14,18], but also because similarities in their epidemiological traits led to a substantial overlap in the age groups affected, with a similar estimated mean age of infection of approximately 4–5 years in England and Wales during the 1940s and early 1950s [26,27].
To quantify the nature and magnitude of interactions, we used likelihood-based statistical inference and confronted a series of mechanistic transmission models that comprised our hypotheses regarding the impacts of measles-induced immune modulation on whooping cough epidemiology with weekly incidence data from London that spanned three distinct periods. We focused on the pre-vaccine era since previous work on the rollout of measles immunization in 1968 has shown no obvious impact of measles vaccination on the epidemiology of pertussis [28].
Given the assumption of no history of whooping cough infection, we tested whether recent infection with measles (i) increased an individual’s susceptibility to subsequent whooping cough infection (leading to a reduction in the whooping cough infectious dose), or (ii) raised the risk of mortality owing to whooping cough. In both cases, we also estimated the duration of the effect. Comparison with fitted models that focused on whooping cough alone allowed us to gauge whether our explanation of whooping cough data is improved by simultaneous consideration of the putative effects of measles.
2. Methods
(a). Mortality and morbidity incidence data
Our data consisted of weekly notifications of mortality owing to measles and whooping cough from London during 1904–1912 and 1922–1932, published by the Office of Population, Censuses and Surveys [29]. Previous studies have suggested that over this period, the case fatality probability for measles dropped from 13–20% to 5–7% [30,31] while for whooping cough estimates suggest a reduction from 10–13% to 3–9% [32,33]. We chose to fit these two eras separately to our model considering that disease-induced mortality and the amplitude of seasonality changed over the 20-year period concerned [31]. We also studied weekly records of measles and whooping cough (morbidity) incidence in the pre-vaccine era (1946–1956) (figure 1). In addition to epidemiological data, we obtained parallel demographic data containing annual per capita birth rates as well as annual population size estimates in London. Weekly population sizes and per capita birth rates were obtained by smooth-spline interpolation.
Figure 1.

Weekly notification of whooping cough and measles fatality cases in London during (a) 1904–1912 and (b) 1922–1932 and (c) weekly incidence of whooping cough and measles during 1946–1956.
(b). The process model
We formulated a seasonally forced deterministic continuous-time susceptible-infectious-recovered (SIR) model of whooping cough (figure 2), using measles incidence as a covariate [34,35]. We refer to this as the model. Compartments S and I were additionally subdivided to take into account individual status with respect to measles infection. Specifically, SM and IM represent susceptible and infectious individuals recently infected with measles, while individuals in S and I have no relevant history of measles. We estimated the size of SM, assuming that it is proportional to measles incidence in the past n weeks, corrected for under-reporting. For instance, when examining mortality reports, we have, at time t, , where N(t) is the population size, M(t) is the weekly reported measles deaths, α2 is the measles-specific case fatality probability and η is the measles reporting probability. To avoid potential trade-offs with other parameters and to ensure of the identifiability of other parameter values, we took advantage of previous estimates of measles reporting probabilities (range 49–55% [31,36,37]) to fix η at 52%. We assumed that the reporting rate of measles deaths is similar to the reporting rate of measles cases. Also, based on the literature [31], disease-induced mortality owing to measles, α2, was fixed at the values of 0.15 and 0.025 for 1904–1912 and 1922–32, respectively. Parameters quantifying interaction with measles were estimated along with parameters that determine the basic epidemiology of whooping cough, including its basic reproductive ratio (R0), the amplitude (b1) and the phase (ϕ) of seasonality in transmission and the rate of imports ().
Figure 2.
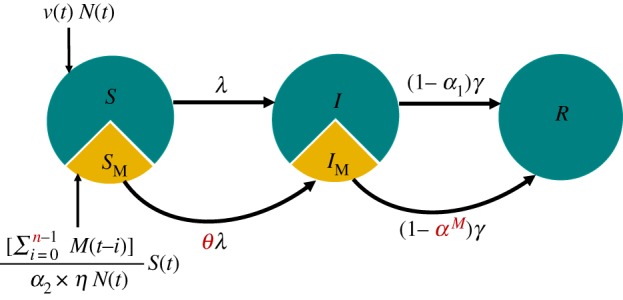
Schematic of the whooping cough transmission model. Individuals progress from compartments S to I and I to R at rates of λ and γ, respectively. Individuals recently infected with measles progress from compartments SM to IM and IM to R at rates of θλ and γ, respectively. Disease-induced mortality owing to whooping cough and measles are represented by α1 and α2, respectively. Here, M(t) is number of measles cases at week t. Immune mediation parameters are coloured red; θ quantifies the susceptibility to whooping cough after measles infection, αM represents the risk of disease-induced mortality owing to whooping cough after measles infection, and n is the immune modulation duration. The slice size does not represent the actual size of SM.
We used this model to test two hypotheses. First, that measles infection over the past n weeks increases susceptibility to whooping cough. This mechanism was implemented by incorporating a parameter, θ, that represents the susceptibility impact of measles infection. The first hypothesis, therefore, implies θ > 1. The second hypothesis is that measles infection increases the risk of mortality owing to whooping cough. We tested this by examining whether the case fatality estimated for IM individuals (denoted by αM) is greater than that estimated in a model of whooping cough alone (α1). For the third era (1946–1956), we fitted the morbidity data to the model, and therefore tested only the first hypothesis. In each case, we estimated the time scale of any association, n.
Our model ignores process noise and the only source of variability in observations is assumed to be the measurement error. Details of the process model are given in electronic supplementary material, S1, with the model parameters described in table 1.
Table 1.
Description of fitted disease parameters, and initial conditions.
| parameter | interpretation | value or allowed range |
|---|---|---|
| R0 | basic reproduction number | [1,50] |
| b1 | seasonality amplitude | [0,1] |
| ϕ | timing of the peak transmission rate | [0,1] |
| number of imported cases | [1,50] | |
| α1 | disease-induced mortality owing to whooping cough | [0,1] |
| α2 | disease-induced mortality owing to measles | 0.15 (1904–1912), 0.025 (1922–1932) |
| η | reporting probability of measles | 0.52 |
| θ | enhanced susceptibility to whooping cough after measles infection | [0.5,200] |
| αM | disease-induced mortality owing to whooping cough after measles infection | [0,1] |
| n | duration of measles-induced immune suppression | [0,30] |
| εi | reporting probability of whooping cough | 0.15 |
| ψi | overdispersion | [0,1] |
| μ | death rate | 0.025 yr−1 (1904–1912), 0.018 yr−1 (1922–1932,1946–1956) |
| 1/γ | infectious period of whooping cough | 21 days |
| S0 | initial fraction of susceptible class | [0.001,0.15] |
| I0 | initial fraction of infected class | [0.0001,0.01] |
| initial fraction of infected class following measles infection | [0.0001,0.01] | |
| R0 | initial fraction of recovered class | 1 − S0 − I0 |
(c). Trajectory matching and likelihood profiles
We fitted our deterministic models to the whooping cough data using maximum-likelihood estimation (MLE) via trajectory matching implemented in the R package ‘pomp’ [38]. To find MLEs, we initiated a global search of parameter space comprised of 5000 points generated using Latin Hypercube Sampling to span the parameter ranges shown in table 1. These points were used to sequentially initialize (i) the Nelder-Mead [39], (ii) simulated annealing (SANN; [40]) and (iii) the Subplex algorithms [41].
We constructed the likelihood profiles for each of the measles interaction parameters (θ, αM, n) as well as α1; that is, we varied the value of the parameter of interest systematically while maximizing the likelihood over all the remaining model parameters using trajectory matching. Furthermore, a smooth line was fitted through the values at the sampled points. The 95 per cent confidence interval was taken to be the parameter range that is log-likelihood units below the maximum univariate confidence limits using the χ2 distribution [42]. To visualize the potential interactions among these parameters, we also constructed two-dimensional likelihood surfaces; (θ, n), (αM, n) and (θ, αM). To quantify the agreement between the fitted model and data, we also calculated the generalized R2. Full details of our protocol for likelihood estimation are given in electronic supplementary material, S2–S4.
3. Results
(a). Simulation study
To assess the feasibility of our approach, we first carried out a systematic simulation study. For a given measles time series, using the model with the interaction term between whooping cough and measles (we call it here SIR-MV), we simulated whooping cough incidence data assuming different combinations of immune-suppression severity and duration. We then fitted models to these synthetic data to explore the identifiability of measles-induced immune-suppression duration, n, and impact, θ. Full protocol details are provided in electronic supplementary material, S9. We found that the severity of immune suppression (θ) was generally well identified (electronic supplementary material, figure S10). However, reliable estimates of the duration of immune suppression (n) are only possible when immune impact (θ) is large (electronic supplementary material, figure S10).
We also carried out a separate simulation study to test whether our model can estimate the simulation parameters from aggregate data. We first simulated a time series using a set of parameter values as shown in electronic supplementary material, table S3. Next, we fitted our model to the simulated data and estimated the parameters. Our fitting algorithm could accurately estimate the parameter values that generated the simulated data (electronic supplementary material, table S3).
(b). Era I. 1904–1912
For the fitted SIR-MV model, infection with measles significantly increased the susceptibility to whooping cough (θ = 85; CI: [5,153]), although this effect only lasted for one week (n=0; CI: [0,11] (figure 3a,b). n = 0 here means that measles infection increased the susceptibility to whooping cough within the same week. The model also identified an almost threefold increase in risk of mortality owing to whooping cough (αM = 0.2; CI: [0.09-1] compared with α1 = 0.07; CI: [0.07-0.08]) (figure 3c,d). Our two-dimensional likelihood profiles highlighted a clear trade-off between the duration and magnitude of the susceptibility impact (electronic supplementary material, figure S1b). Shorter durations of immune suppression were correlated with a stronger susceptibility impact. By contrast, we found no correlation between disease-induced mortality owing to whooping cough and the duration or magnitude of susceptibility (electronic supplementary material, figure S1a and S1a,c). The proportion of infectious individuals previously infected with measles (IM/I) was generally low and ranged between 0.1% to 3% during peak whooping cough season (electronic supplementary material, figure S7a).
Figure 3.

Log-likelihood profiles for parameters n, θ, αM and α1 for eras 1904–1912 (a–d), 1922–1932 (e–h), 1946–1956 (i,j) in London. The profiles are constructed by fitting a smooth curve through the log-likelihood points. Vertical dashed dotted lines represent the maximum-likelihood estimate (MLE). The horizontal dashed lines represent the approximately 2 log-likelihood units below the MLE. The shaded areas represent the estimated 95% confidence interval.
Our fitted SIR model consisting of whooping cough alone yielded very similar epidemiological estimates to the SIR-MV model. However, while the log-likelihood for the more complex SIR-MV model was higher, the nearly identical Akaike information criterion (AIC) scores indicate that the SIR-MV model does not outperform the SIR model. We also compared model performance by calculating the R2 for the fitted SIR and SIR-MV models relative to the data (electronic supplementary material, figure S4). We found comparable goodness-of-fit performance reaffirming that, for these data, the addition of measles as a covariate did not improve model performance (table 2).
Table 2.
MLE and parameter estimations of SIR and SIR-MV models using London data.
| era 1904–1912 |
era 1922–1932 |
era 1946–1956 |
||||
|---|---|---|---|---|---|---|
| parameters | SIR | SIR-MV | SIR | SIR-MV | SIR | SIR-MV |
| AIC | 2731.97 | 2731.99 | 2930.45 | 2822.24 | 6165.36 | 6122.93 |
| R2 | 0.39 | 0.4 | 0.26 | 0.38 | 0.07 | 0.1 |
| log-likelihood | −1356.99 | −1351.59 | −1456.22 | −1397.12 | −3074.68 | −3049.46 |
| R0 | 32.75 | 29.7 | 29.21 | 8.81 | 18.31 | 20.2 |
| b1 | 0.16 | 0.16 | 0.23 | 0.286 | 0.07 | 0.058 |
| ϕ | 0.76 | 0.75 | 0.71 | 0.69 | 0.85 | 0.85 |
| 3.23 × 10⁻¹⁰ | 6.14 × 10⁻³ | 2.46 × 10⁻⁵ | 2.89 × 10⁻³ | 6.45 × 10⁻¹⁰ | 1.29 × 10⁻⁵ | |
| α1 | 0.077 | 0.076 | 0.043 | 0.051 | – | – |
| αM | – | 0.18 | – | 1.49 × 10⁻¹⁹ | – | – |
| θ | – | 70.6 | – | 9.77 | – | 36.2 |
| n | – | 0 | – | 29 | – | 0 |
| S0 | 0.027 | 0.032 | 0.036 | 0.111 | 0.052 | 0.0458 |
| I0 | 0.001 | 7.5 × 10⁻⁴ | 3.9 × 10⁻⁴ | 4.2 × 10⁻⁴ | 6.8 × 10⁻⁴ | 9.6 × 10⁻⁴ |
| – | 0.0011 | – | 7.57 × 10⁻⁵ | – | 0.0012 | |
| R0 | 0.972 | 0.966 | 0.964 | 0.889 | 0.947 | 0.952 |
(c). Era II. 1922–1932
The best-fitting SIR-MV model from the second era indicated a 10-fold increase in susceptibility θ = 9.77; CI: [9,11], although under this model the effect was predicted to extend to 29 weeks (n = 29). There was no support for a mortality effect in this era (αM = 0.0001; CI:[10−4,0.005] and α1 = 0.05) (figure 3e–h). At the peak of whooping cough transmission, individuals previously infected with measles (IM) accounted for up to 19% of whooping cough fatalities (I), though this figure dropped to 0.23% during the troughs (electronic supplementary material, figure S7b). Comparison with the fitted SIR model indicated strong support for measles-driven immune effects shaping whooping cough epidemiology in this era, with ΔAIC = 107 (table 2; electronic supplementary material, figure S5). The SIR-MV model also better captured the peaks of whooping cough epidemics than the SIR model with respective R2 of 0.38 and 0.26. However, while our SIR and SIR-MV model fits for the first era exhibited strong parametric similarity, in this second era, the two models provide contrasting explanations of the data. The SIR estimates are largely consistent with those from the first era, especially an R0 value of approximately 30. The corresponding estimate for R0 for the SIR-MV model, however, is approximately 9 (table 2), although here measles infections were predicted to lead to increased susceptibility to pertussis for over six months. To ensure that the SIR-MV model was not trapped at a local maximum, we re-fitted the model but fixed R0 at 30, which is close to the estimated value for the SIR model (electronic supplementary material, table S2). We found no support for this fixed-R0 model, with log-likelihood, AIC and R2 all clearly identifying the model with R0 ∼ 9 as the better fit to these data (electronic supplementary material, figure S8).
(d). Era III. 1946–1956
As shown in figures 3i,j, in this era, we found evidence for an increase in susceptibility to whooping cough following measles infection (θ = 36; CI : [16,45]), but this effect is very short-lived (n = 0; CI : [0,1]). The proportion of infectious individuals previously infected with measles (IM/I) was low during the third era, accounting for only 6% of total infectious cases (I) during the peak season (electronic supplementary material, figure S7c). Although the model incorporating interaction with measles provided a superior fit compared with the SIR model (ΔAIC = 42; table 2), neither model explained the data well (R2 values of 0.1 and 0.07, respectively; electronic supplementary material, figure S6).
4. Discussion
In this study, we tested the association between two microparasitic childhood diseases, measles and whooping cough. This work was motivated in part by multiple studies at the individual scale conducted on non-human primates, which have suggested that the slow clearance of measles viral RNA from blood and tissues is linked to decreased host resistance to infection potentially as a result of immune suppression [23,43]. Furthermore, the population-level findings of Mina and colleagues [20]—based on trends in annual incidence reports—also identified long-term immune suppressive effects of measles infection on non-measles infectious diseases. Therefore, here, our principal aim was to evaluate the evidence in support of immune-mediated effects of measles infection on whooping cough epidemiology by fitting models to high resolution (weekly) long-term mortality and morbidity data over a temporal gradient of decreasing measles and whooping cough transmission.
Our findings were inconsistent across the datasets fitted. In two of the three time periods examined, we found support for an epidemiological impact of measles infection on whooping cough. However, estimates of the magnitude of this interaction were quite variable. For the first era (1904–1912), we found that while our model that included interaction with measles identified a strong but short-lived immune suppressive effect, this model did not fit the data any better than a stand-alone SIR model of whooping cough. By contrast, for the second era (1922–1932), there was evidence for a 10-fold increase in susceptibility to whooping cough if an individual had experienced a measles infection within the past six months. Finally, for the data from 1946 to 1956, the estimated duration of the immune modulation effect is one to two weeks, associated with a 36-fold increase in susceptibility to whooping cough. In this third era, however, forecasts from the best-fitting SIR and the interaction (SIR-MV) models were both in poor agreement with the data.
We examined whether our choice of seasonal transmission function may account for these findings. Implementing seasonal variation in contacts as a binary function, mimicking the opening and closing of school terms [44], produced model fits that provided both a poorer explanation of the data and improbable epidemiological parameter estimates (electronic supplementary material, S11 and table S4).
Differences in the inferences made across the three eras may be in part owing to notable demographic shifts that are known to affect the dynamics of these two diseases [2,31,45]. In particular, when transmission fluctuates seasonally, changes in per capita birth rates are known to impact mean transmission and subsequently the inter-epidemic period [45,46]. The first decade of twentieth century was characterized by high birth rates leading to annual measles and whooping cough epidemics [33]. The measles mortality data are clearly annual, though exhibit biennial outbreaks in 1909 and 1911 (figure 1a). Whooping cough mortality data are rigidly annual throughout 1904–1912. In the period immediately following World War I (1922–1932), we observed large amplitude, biennial, and strikingly out-of-phase epidemics of measles and whooping cough (figure 1b). Elsewhere, it has been argued that these changes in epidemiology were driven by a combination of a declining population growth rate and increasing seasonality in transmission owing to the roll out of Education Acts, which may have led to higher school attendance [31,33]. In the post World War II era, the baby boom from 1946 to 1950 coincided with annual epidemics of measles and whooping cough (figure 1c), followed by well-studied biennial epidemics in measles [45,47,48] and irregular whooping cough outbreaks with 2–3 inter-epidemic periods [48].
To test the robustness of our findings, we carried out additional analyses on comparable data from the city of Birmingham (UK) (electronic supplementary material, figure S11). Reassuringly, as outlined in electronic supplementary material, figures S12–S14 and table S5, our overall conclusions are consistent with those arrived at from fitting models to the London data. Taken together, these fits lead us to conclude that the impact of measles infections on whooping cough incidence (quantified via the aetiological fraction) is variable across three eras (electronic supplementary material, figure S7), suggesting there is no single candidate explanation for these data.
Previously, it has been suggested that the epidemiology of whooping cough may be explained in part by interaction with other pathogens [2,49]. Our findings indicate that measles-mediated dynamics can, in some time periods, generate whooping cough epidemics consistent with the data. In the final era, however, when measles transmission was lowest among the eras studied, our models fail to explain whooping cough incidence. It is possible that inherently stochastic models may be better able to capture the changing epidemiology of whooping cough in the most recent time period [48,50,51] and may perhaps lead to more consistent inference regarding the nature and magnitude of measles immune modulation. As previously discussed, epidemics of whooping cough are qualitatively impacted by stochasticity [52–54], with small perturbations leading to long-lasting transient dynamics that are characteristically different from the asymptotic dynamics [55]. Previous work has displayed the effect of population size on whooping cough dynamics, where a large population size leads to large annual outbreaks, and a smaller population size leads to a mixture of annual and multi-annual epidemics. Also, accounting for the environmental stochasticity leads to a combination of annual and multi-annual outbreaks [55]. Therefore, stochastic models will likely better explain the observed irregular multi-annual oscillations during 1946–1956 [48,50].
Future work needs also to examine whether immune amnesia resulting from MV infection renders previously infected and recovered individuals susceptible to whooping cough once again. This possibility would necessitate the fitting of more complex models with immune erasure and potentially different epidemiological traits of individuals experiencing repeat whooping cough infections [50,51,56]. Accounting for these mechanisms, as well as potential ecological interference effects [2,8], would require the development and fitting of explicit two-disease models [42]. Preliminary results of fitting such models to data from London are provided in supplementary material, S8. The AIC scores for these more complex models are systematically higher than those of the simpler (SIR and SIR-MV) models, indicating that their greater complexity is not supported by the data. This is likely in part owing to the additional challenge faced by these models of also explaining the epidemiological dynamics of measles.
Our study has attempted to use population-level footprints of individual-level interactions among infectious agents. We have provided a quantitative framework to quantify interactions among infectious agents from epidemiological time-series data. This framework is quite flexible and has previously been shown to successfully yield unequivocal and consistent conclusions regarding the consequence of influenza for subsequent pneumococcal infections [34,35,57]. The absence of a consistent finding may reflect either inherent variability in the posited effects of measles infection (perhaps by age), the need for additional models that attempt to diagnose these effects using alternative formulations, stochastic inference methodology, or a combination of these factors. Given the concerted global effort to eradicate measles [58], a better understanding of its effects on other infectious diseases and their epidemiology in a post-measles setting is both timely and important. We note that while much of the focus of the research on polymicrobial systems has been on human infectious diseases, we believe the approach may be broadly applicable to animal and plant infections. As an example, infection of maize by the phytopathogenic fungi Fusarium verticillioides facilitates infection by several related fungi [59,60]. Understanding the ecology of such host multi-pathogens will be central to the identification of effective control strategies.
Supplementary Material
Supplementary Material
Acknowledgements
We thank Aaron King, Toby Brett, Ana Bento, Afshin Mesbahi, Deven Gokhale and Carles Breto for their comments and insights. We also thank the Pittsburgh Supercomputing Center for access to Olympus, a multiple-use compute cluster dedicated to research in the MIDAS community.
Data accessibility
The datasets supporting this article are published by the Office of Population, Censuses and Surveys.
Authors' contributions
P.R. contributed to conception and acquisition of data. N.N. contributed to the analysis of data, N.N. and P.R. contributed to interpretation of data, and drafting the article.
Competing interests
We declare we have no competing interests.
Funding
This work was supported by MIDAS, National Institute of General Medical Sciences (grant no. U54-GM111274) and the National Institutes of Health (grant no. R01AI101155).
References
- 1.Petney TN, Andrews RH. 1998. Multiparasite communities in animals and humans: frequency, structure and pathogenic significance. Int. J. Parasitol. 28, 377–393. ( 10.1016/S0020-7519(97)00189-6) [DOI] [PubMed] [Google Scholar]
- 2.Rohani P, Green C, Mantilla-Beniers N, Grenfell B. 2003. Ecological interference between fatal diseases. Nature 422, 885–888. ( 10.1038/nature01542) [DOI] [PubMed] [Google Scholar]
- 3.Lello J, Boag B, Fenton A, Stevenson IR, Hudson PJ. 2004. Competition and mutualism among the gut helminths of a mammalian host. Nature 428, 840–844. ( 10.1038/nature02490) [DOI] [PubMed] [Google Scholar]
- 4.Brogden KA, Guthmiller JM, Taylor CE. 2005. Human polymicrobial infections. Lancet 365, 253–255. ( 10.1016/S0140-6736(05)70155-0) [DOI] [PMC free article] [PubMed] [Google Scholar]
- 5.Brogden KA, Guthmiller JM (eds). 2002. Polymicrobial diseases. Washington, DC: ASM Press. [PubMed] [Google Scholar]
- 6.Stacy A, McNally L, Darch SE, Brown SP, Whiteley M. 2015. The biogeography of polymicrobial infection. Nat. Rev. Microbiol. 14, 93–105. ( 10.1038/nrmicro.2015.8) [DOI] [PMC free article] [PubMed] [Google Scholar]
- 7.Ferguson N, Galvani A, Bush R. 2003. Ecological and immunological determinants of influenza evolution. Nature 422, 428–433. ( 10.1038/nature01509) [DOI] [PubMed] [Google Scholar]
- 8.Rohani P, Earn DJ, Finkenstädt B, Grenfell BT. 1998. Population dynamic interference among childhood diseases. Proc. R. Soc. Lond. B 265, 2033–2041. ( 10.1098/rspb.1998.0537) [DOI] [PMC free article] [PubMed] [Google Scholar]
- 9.Graham A. 2008. Ecological rules governing helminth–microparasite coinfection. Proc. Natl Acad. Sci. USA 105, 566–570. ( 10.1073/pnas.0707221105) [DOI] [PMC free article] [PubMed] [Google Scholar]
- 10.Katzelnick LC, Gresh L, Halloran ME, Mercado JC, Kuan G, Gordon A, Balmaseda A, Harris E. 2017. Antibody-dependent enhancement of severe dengue disease in humans. Science 358, 929–932. ( 10.1126/science.aan6836) [DOI] [PMC free article] [PubMed] [Google Scholar]
- 11.Griffin DE. 2010. Measles virus-induced suppression of immune responses. Immunol. Rev. 236, 176–189. ( 10.1111/j.1600-065X.2010.00925.x.) [DOI] [PMC free article] [PubMed] [Google Scholar]
- 12.Rohani P, Wearing HJ, Vasco D, Huang Y. 2008. Understanding host-multipathogen systems: modeling the interaction between ecology and immunology. In Infectious disease ecology (eds RS Ostfeld, F Keesing), pp. 48–70. Princeton, NJ: Princeton University Press.
- 13.Creighton C. 1894. A history of epidemics in Britain. Cambridge, UK: Cambridge University Press. [Google Scholar]
- 14.Laing J, Hay M. 1902. Whooping-cough: its prevalence and mortality in Aberdeen. Public Health 14, 584–598. ( 10.1016/S0033-3506(01)80186-4) [DOI] [Google Scholar]
- 15.Coleman S. 2015. The historical association between measles and pertussis: a case of immune suppression? SAGE Open Med. 3, 1–6. ( 10.1177/2050312115621315) [DOI] [PMC free article] [PubMed] [Google Scholar]
- 16.Barford LJ. 1948. Whooping-cough and measles. BMJ (Clinical research ed.), 441–442.
- 17.Hodge BL. 1948. Whooping-cough and measles. BMJ 2, 312 ( 10.1136/bmj.2.4570.312-a) [DOI] [PMC free article] [PubMed] [Google Scholar]
- 18.Williams D. 1895. Diseases of children: medical, measles and whooping cough. Practitioner 55, 74–78. [Google Scholar]
- 19.van den Ent MM, Brown DW, Hoekstra EJ, Christie A, Cochi SL. 2011. Measles mortality reduction contributes substantially to reduction of all cause mortality among children less than five years of age, 1990–2008. J. Infect. Dis. 204, S18–S23. ( 10.1093/infdis/jir081) [DOI] [PubMed] [Google Scholar]
- 20.Mina MJ, Metcalf CJE, de Swart RL, Osterhaus ADME, Grenfell BT. 2015. Long-term measles-induced immunomodulation increases overall childhood infectious disease mortality. Science 348, 694–700. ( 10.1126/science.aaa3662) [DOI] [PMC free article] [PubMed] [Google Scholar]
- 21.Laksono BM, de Vries RD, Mcquaid S, Duprex WP, Swart RLD. 2016. Measles virus host invasion and pathogenesis. Viruses 8, 1–13. ( 10.3390/v8080210) [DOI] [PMC free article] [PubMed] [Google Scholar]
- 22.de Vries RD, Mcquaid S, Amerongen GV, Yuksel S, Verburgh RJ, Osterhaus ADME, Duprex WP, Swart RLD. 2012. Measles immune suppression: lessons from the macaque model. PLoS Pathog. 8, 1–11. ( 10.1371/journal.ppat.1002885) [DOI] [PMC free article] [PubMed] [Google Scholar]
- 23.Lin WhW, Kouyos RD, Adams RJ, Grenfell BT, Grif DE. 2012. Prolonged persistence of measles virus RNA is characteristic of primary infection dynamics. Proc. Natl Acad. Sci. USA 109, 14 989–14 994. ( 10.1073/pnas.1211138109) [DOI] [PMC free article] [PubMed] [Google Scholar]
- 24.Pierson TC, Yewdell JW. 2012. Measles immunometrics. Proc. Natl Acad. Sci. USA 109, 14 724–14 725. ( 10.1073/pnas.1212243109) [DOI] [PMC free article] [PubMed] [Google Scholar]
- 25.Rohani P, Scarpino SV. 2018. Pertussis: epidemiology, immunology and evolution. Oxford, UK: Oxford University Press. [Google Scholar]
- 26.Anderson RM, May RM. 1982. Directly transmitted infectious diseases: control by vaccination. Science 215, 1053–1060. ( 10.1126/science.7063839) [DOI] [PubMed] [Google Scholar]
- 27.Anderson RM, May RM. 1985. Vaccination and herd immunity to infectious diseases. Nature 318, 323–329. ( 10.1038/318323a0) [DOI] [PubMed] [Google Scholar]
- 28.Rohani P, Earn DJ, Grenfell BT. 1999. Opposite patterns of synchrony in sympatric disease metapopulations. Science 286, 968–971. ( 10.1126/science.286.5441.968) [DOI] [PubMed] [Google Scholar]
- 29.Office of Population, Censuses and Surveys (OPCS). (1904–1913 and 1922–1932) Registrar General's weekly returns of births and deaths in London and in other large towns, vol. LXV, no. 1 (to LXXIV, no. 52 and ?). London, UK: HMSO.
- 30.Butler W. 1913. Measles. Proc. R. Soc. Med. 6, 120–153. [DOI] [PMC free article] [PubMed] [Google Scholar]
- 31.Mantilla-Beniers NB, Bjornstad ON, Grenfell BT, Rohani P. 2010. Decreasing stochasticity through enhanced seasonality in measles epidemics. J. R. Soc. Interface 7, 727–739. ( 10.1098/rsif.2009.0317) [DOI] [PMC free article] [PubMed] [Google Scholar]
- 32.Butler W. 1947. Whooping cough and measles. an epidemiological concurrence and contrast. Proc. R. Soc. Med. 40, 384–398. [DOI] [PMC free article] [PubMed] [Google Scholar]
- 33.Mantilla-Beniers NB. 2004. Spatio-temporal dynamics of sympatric childhood diseases in the 20th century. PhD thesis, University of Cambridge.
- 34.Shrestha S, Foxman B, Weinberger DM, Steiner C, Viboud C, Rohani P. 2013. Identifying the interaction between influenza and pneumococcal pneumonia using incidence data. Sci. Transl. Med. 5, 1–20. ( 10.1126/scitranslmed.3005982) [DOI] [PMC free article] [PubMed] [Google Scholar]
- 35.Shrestha S, Foxman B, Berus J, van Panhuis WG, Steiner C, Viboud C, Rohani P. 2015. The role of influenza in the epidemiology of pneumonia. Sci. Rep. 5, 1–13. ( 10.1038/srep15314) [DOI] [PMC free article] [PubMed] [Google Scholar]
- 36.Finkenstadt BF, Grenfell BT. 2000. Time series modelling of childhood diseases: a dynamical systems approach. J. R. Stat. Soc. Ser. C (Appl. Stat). 49, 187–205. ( 10.1111/1467-9876.00187) [DOI] [Google Scholar]
- 37.He D, Ionides EL, King AA. 2010. Plug-and-play inference for disease dynamics: measles in large and small populations as a case study. J. R. Soc. Interface 7, 271–283. ( 10.1098/rsif.2009.0151) [DOI] [PMC free article] [PubMed] [Google Scholar]
- 38.King AA, Nguyen D, Ionides EL. 2016. Statistical inference for partially observed markov processes via the R package pomp. J. Stat. Softw. 69, 1–43. ( 10.18637/jss.v069.i12) [DOI] [Google Scholar]
- 39.Nelder JA, Mead R. 1965. A simplex method for function minimization. Comput. J. 7, 308–313. ( 10.1093/comjnl/7.4.308) [DOI] [Google Scholar]
- 40.Belisle CJP. 1992. Convergence theorems for a class of simulated annealing algorithms on ℝd. J. Appl. Prob. 29, 885–895. ( 10.2307/3214721) [DOI] [Google Scholar]
- 41.Rowan TH. 1990. Functional stability analysis of numerical algorithms. PhD thesis, University of Texas at Austin.
- 42.Shrestha S, King AA, Rohani P. 2011. Statistical inference for multi-pathogen systems. PLoS Comput. Biol. 7, e1002135 ( 10.1371/journal.pcbi.1002135) [DOI] [PMC free article] [PubMed] [Google Scholar]
- 43.Griffin DE. 2016. The immune response in measles: virus control, clearance and protective immunity. Viruses 8, 1–8. ( 10.3390/v8100282) [DOI] [PMC free article] [PubMed] [Google Scholar]
- 44.Keeling RP, Matt J, Grenfell BT. 2001. Seasonally forced disease dynamics explored as switching between attractors. Physica D 148, 317–335. ( 10.1016/S0167-2789(00)00187-1) [DOI] [Google Scholar]
- 45.Earn D, Rohani P, Bolker B, Grenfell B. 2000. A simple model for complex dynamical transitions in epidemics. Science 287, 667–670. ( 10.1126/science.287.5453.667) [DOI] [PubMed] [Google Scholar]
- 46.Nguyen HTH, Rohani P. 2008. Noise, nonlinearity and seasonality: the epidemics of whooping cough revisited. J. R. Soc. Interface 5, 403–413. ( 10.1098/rsif.2007.1168) [DOI] [PMC free article] [PubMed] [Google Scholar]
- 47.Bolker B, Grenfell B. 1993. Chaos and biological complexity in measles dynamics. Proc. R. Soc. Lond. B 251, 75–81. ( 10.1098/rspb.1993.0011) [DOI] [PubMed] [Google Scholar]
- 48.Rohani P, Earn DJ, Grenfell BT. 1999. Opposite patterns of synchrony in sympatric disease metapopulations. Science 286, 968–971. ( 10.1126/science.286.5441.968) [DOI] [PubMed] [Google Scholar]
- 49.Bhattacharyya S, Ferrari MJ, Bjørnstad ON. 2018. Species interactions may help explain the erratic periodicity of whooping cough dynamics. Epidemics 23, 64–70. ( 10.1016/j.epidem.2017.12.005) [DOI] [PubMed] [Google Scholar]
- 50.Magpantay FMG, Domenech de Celles M, Rohani P, King AA. 2016. Pertussis immunity and epidemiology: mode and duration of vaccine-induced immunity. Parasitology 143, 835–849. ( 10.1017/S0031182015000979) [DOI] [PMC free article] [PubMed] [Google Scholar]
- 51.Domenech de Celles M, Magpantay FMG, King AA, Rohani P. 2018. The impact of past vaccination coverage and immunity on pertussis resurgence. Sci. Transl. Med. 10, eaaj1748 ( 10.1126/scitranslmed.aaj1748) [DOI] [PMC free article] [PubMed] [Google Scholar]
- 52.Hethcote HW. 1998. Oscillations in an endemic model for pertussis. CAMQ 6, 61–89. [Google Scholar]
- 53.Bauch CT, Earn DJD. 2003. Transients and attractors in epidemics. Proc. R. Soc. Lond. B 270, 1573–1578. ( 10.1098/rspb.2003.2410) [DOI] [PMC free article] [PubMed] [Google Scholar]
- 54.Black A, McKane A. 2010. Stochastic amplification in an epidemic model with seasonal forcing. J. Theor. Biol. 267, 85–94. ( 10.1016/j.jtbi.2010.08.014) [DOI] [PubMed] [Google Scholar]
- 55.Rohani P, Keeling MJ, Grenfell BT. 2002. The interplay between determinism and stochasticity in childhood diseases. Am. Nat. 159, 469–481. ( 10.1086/339467) [DOI] [PubMed] [Google Scholar]
- 56.Broutin H, Viboud C, Grenfell BT, Miller MA, Rohani P. 2010. Impact of vaccination and birth rate on the epidemiology of pertussis: a comparative study in 64 countries. Proc. R. Soc. B 277, 1–7. ( 10.1098/rspb.2010.0994) [DOI] [PMC free article] [PubMed] [Google Scholar]
- 57.de Cellès MD, Pons-Salort M, Varon E, Vibet MA, Ligier C, Letort V, Opatowski L, Guillemot D. 2015. Interaction of vaccination and reduction of antibiotic use drives unexpected increase of pneumococcal meningitis. Sci. Rep. 5, 1–11. ( 10.1038/srep11293) [DOI] [PMC free article] [PubMed] [Google Scholar]
- 58.WHO, 2014 Meeting of the strategic advisory group of experts on immunization, April 2014 – conclusions and recommendations. Weekly epidemiological record. Weekly epidemiological record, 23 May 2014, vol. 89, no. 21, pp. 221–236. Geneva, Switzerland: World Health Organization.
- 59.Abdullah AS, Moffat CS, Lopez-Ruiz FJ, Gibberd MR, Hamblin J, Zerihun A. 2017. Host–multi-pathogen warfare: pathogen interactions in co-infected plants. Front. Plant Sci. 8, 1–12. ( 10.3389/fpls.2017.01806) [DOI] [PMC free article] [PubMed] [Google Scholar]
- 60.Saunders M, Kohn LM. 2008. Host-synthesized secondary compounds influence the in vitro interactions between fungal endophytes of maize. Appl. Environ. Microbiol. 74, 136–142. ( 10.1128/AEM.01538-07) [DOI] [PMC free article] [PubMed] [Google Scholar]
Associated Data
This section collects any data citations, data availability statements, or supplementary materials included in this article.
Supplementary Materials
Data Availability Statement
The datasets supporting this article are published by the Office of Population, Censuses and Surveys.