

Abstract
Cancer treatments have evolved from indiscriminate cytotoxic agents to selective genome- and immune-targeted drugs that have transformed outcomes for some malignancies.1 Tumor complexity and heterogeneity suggest that the “precision medicine” paradigm of cancer therapy requires treatment to be personalized to the individual patient.2–6 To date, precision oncology trials have been based upon molecular matching with predetermined monotherapies.7–14 Several of these trials have been hindered by very low matching rates, often in the 5–10% range,15 and low response rates. Low matching rates may be due to the use of limited gene panels, restrictive molecular matching algorithms, lack of drug availability or the deterioration and death of end-stage patients before therapy can be implemented. We hypothesized that personalized treatment with combination therapies would improve outcomes in patients with refractory malignancies. As a first test of this concept, we implemented a cross-institutional, prospective study (I-PREDICT, NCT02534675) that used tumor DNA sequencing and timely recommendations for individualized treatment with combination therapies. We found that administration of customized multi-drug regimens was feasible, with 49% of consented patients receiving personalized treatment. Targeting of a larger fraction of identified molecular alterations, yielding a higher “matching score,” was correlated with significantly improved disease control rates, as well as longer progression-free and overall survival rates, as compared to when fewer somatic alterations were targeted. Our findings suggest that the current clinical trial paradigm for precision oncology, which pairs one driver mutation with one drug, may be optimized by treating molecularly complex and heterogeneous cancers with combinations of customized agents.
We conducted Investigation of Profile-Related Evidence Determining Individualized Cancer Therapy (I-PREDICT, NCT02534675), a prospective navigation trial, at two centers (University of California, San Diego Moores Cancer Center and Avera Cancer Institute). Tissue genomic profiling using next generation sequencing (NGS) (Foundation Medicine; 236–405 genes), and, if possible, PD-L1 immunohistochemistry (IHC), tumor mutational burden (TMB), microsatellite instability (MSI) status, and NGS of blood-derived circulating tumor DNA (ctDNA) were performed. Based on this information, a Molecular Tumor Board consisting of oncologists, pharmacologists, cancer biologists, geneticists, surgeons, radiologists, pathologists, and bioinformatics experts focused on selecting customized, multi-drug combinations to target a majority of the genomic alterations in each patient’s tumor(s) while simultaneously considering potential overlapping drug toxicities. The therapies ultimately administered were based on the treating oncologists’ choice, with physicians crafting the regimen by incorporating Molecular Tumor Board discussions, as well as patient preference, attention to co-morbidities, consideration of drug toxicities, insurance payor coverage of off-label agent(s), and investigational agent clinical trial availability, hence reflecting actual clinical practice in the United States today.
One hundred and forty-nine patients with previously treated, refractory, lethal metastatic cancers (Stage IV disease) were consented to the I-PREDICT trial. Eighty-three patients (56%) were treated and evaluable for analysis (Supplementary Table 1 and Supplementary Table 2). These 83 patients had a median of two prior lines of therapy. The other 66 patients were considered inevaluable, mainly because they deteriorated or died before treatment could be initiated (Extended Data Figure 1). Patient demographics of the 83 treated patients are described in Table 1. The most common primary tumor sites were gastrointestinal (including hepatopancreatobiliary) (42.2%), gynecologic (16.9%), breast (14.5%), and central nervous system (CNS, 7.2%). The median number of characterized genomic alterations per tumor was 5 (range: 1–20; Table 1).
Table 1.
Patient demographics, molecular pathology, and treatment history.
| Consented patients (N) | 149 |
| Treated patients [N (% of consented patients)] | 83 (55.7%) |
| Patients with ≥1 matched treatment [N (% of consented patients)] | 73 (49.0%) |
| Patients with no matched treatments administered [N (% of consented patients)] | 10 (6.7%) |
| Age1 (Median, 95% CI, Range) | 62 (59–65, 21–86) |
| Gender1 [N (%)] | |
| Women | 55 (66.3%) |
| Men | 28 (33.7%) |
| Ethnicity1 [N (%)] | |
| Caucasian | 67 (80.7%) |
| Asian | 4 (4.8%) |
| African American | 1 (1.2%) |
| Other or unknown | 11 (13.3%) |
| Tumor type1 [N (%)] | |
| Gastrointestinal & hepatopancreatobiliary | 35 (42.2%) |
| Gynecologic | 14 (16.9%) |
| Breast | 12 (14.5%) |
| Central nervous system (CNS) | 6 (7.2%) |
| Genitourinary | 3 (3.6%) |
| Head and neck | 3 (3.6%) |
| Lung | 3 (3.6%) |
| Other2 | 7 (8.4%) |
| Number of total genomic alterations1 (Median, Range; VUS excluded) | 5 (1–19) |
| Number of administered drugs1 (Median, Range) | 2 (1–5) |
| Median number of prior therapies in the metastatic setting1 (Median, IQR) | 2 (1–3) |
Parameters shown are for the 83 treated patients (N=83).
Other included liposarcoma (N=2); carcinoma of the skin, neuroendocrine carcinoma, fibromyxoid sarcoma, bone marrow multiple myeloma, and paraganglioma (N=1 each).
Abbreviations: CI = Confidence Interval; IQR = interquartile range: N=number; VUS = variant of unknown significance.
Of the 83 treated patients, 73 (88% of treated patients; 49% of enrolled patients) were administered a personalized, precision therapy consisting of ≥1 molecularly “matched” treatments (≥1 MT), following receipt of molecular profile results. No two molecular profiles were identical and, hence, most treatment regimens were not exactly alike. The other 10 patients (12%) were not administered matched therapies (no-MT), although 9 of them had potential matches for receiving targeted therapies. Instead, they received only “unmatched” standard-of-care drugs for their respective tumor types, most often due to the treating oncologists’ choices (36.4%), patient preference (36.4%), clinical trial availability of other investigational agents (18.2%), and consideration of drug toxicities (9.1%) (Supplementary Table 3). The median time from study consent to treatment initiation was less than one month (0.93 months, 95% CI 0.73–1.4). Since the protocol permitted use of FoundationOne molecular tests performed as part of physicians’ routine practice (before enrollment), the median time from molecular results until treatment initiation was 2.0 months (95% CI 1.3–2.3).
The 73 patients (≥1 MT) had previously been treated with a median of 2 (IQR 1–3) prior lines of therapy. They received a median of 2 drugs in their on-study treatment regimens (range: 1–5, Table 1). Figure 1A–B details the percentage of matched genomic alterations in a pathway, complex, or gene that were targeted by the customized therapeutic regimens (median of 2 genomic alterations targeted per patient; range: 1–6). Of the 73 patients, all had matches linked to genomic alterations (see Supplementary Table 2 for molecular results and drug matches with supporting references); in 67 patients (91.8%), the drugs were gene product-targeted drugs, while the others were checkpoint inhibitor immunotherapy, based on the genomic profile (Supplementary Table 4). Specifically, a checkpoint inhibitor was administered (alone or in combination with other drugs) to 14 matched patients (19.1%) based upon PD-L1 IHC positivity, high/intermediate TMB, MSI high status, CD274 (PD-L1) amplification, or when tumors had ≥8 genomic alterations with unknown PD-L1 IHC, TMB, and MSI.16–18 Four patients (5.5%) were treated with hormone therapies in combination with other molecularly targeted drugs based on positive hormone status. Only two patients had one genomic alteration and were molecularly matched to one drug. Patients given no-MT (N=10) received a median of 2 drugs (range: 1–3).
Figure 1. Molecular alterations targeted by matched therapies and impact of the Matching Score on treatment outcome.
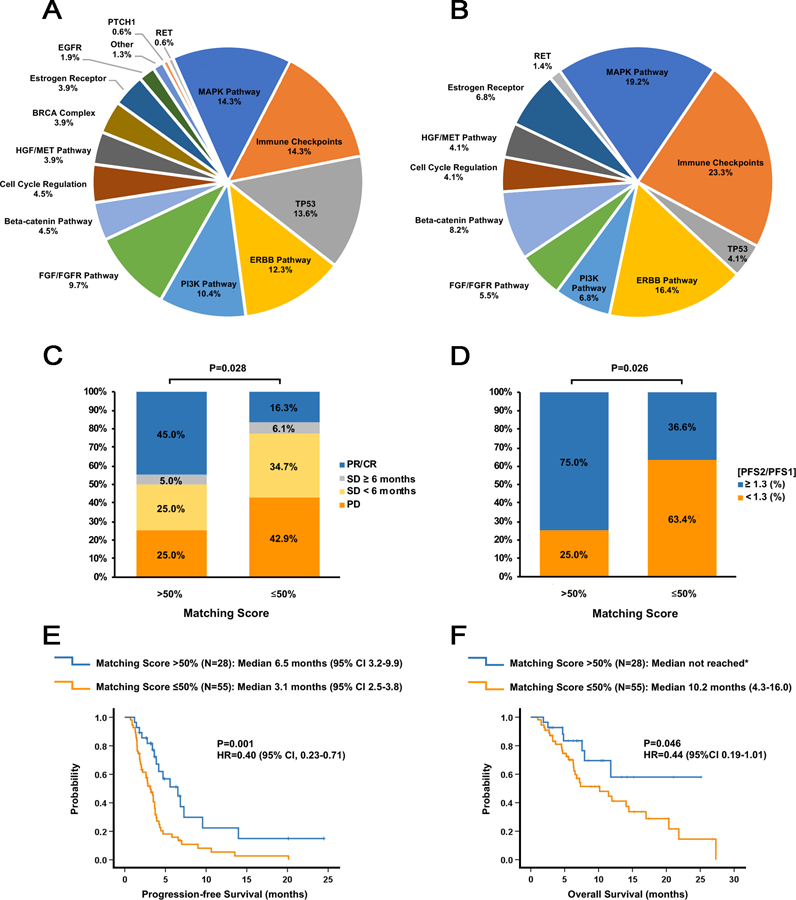
A. Pie graph of the percentage of actionable aberrations in the indicated targets or target pathways for the 73 patients who received at least one matched drug. Since some patients had alterations targeted in multiple genes or pathways, the percentages do not add up to 100%. “Immune checkpoints” refers to amplification of the CD274 (PD-L1) and/or PDCD1LG2 (PD-L2) genes, positive PD-L1 expression (immunohistochemistry), high/intermediate tumor mutational burden, or high microsatellite instability; “MAPK pathway” refers to alterations in the KRAS, BRAF, GNAS, MEK1, NF2 or JAK2 genes; “ERBB pathway” refers to alterations in the ERBB2 or ERBB3 genes; “PI3K pathway” refers to alterations in the AKT1, AKT2, PIK3CA, PIK3R1 or PTEN genes; “FGF/FGFR” pathway refers to alterations/amplifications in the FGFR1/2/3, FGF3, FGF4, FGF6, FGF19, FGF23 or FRS2 genes; “Beta-catenin pathway” refers to alterations in the APC, CTNNB1 or FAT1 genes; “Cell cycle regulation” refers to alterations in the CDKN2A/B, CCND1/2 or CDK4/6 genes; “HGF/MET pathway” refers to alterations in the HGF or MET genes; “BRCA complex” refers to alterations in the BRCA1, BRCA2, ATM, BRIP or PALB2 genes; Estrogen receptor” refers to alterations in the ESR1 gene or estrogen receptor (ER) positivity as assessed by immunohistochemistry; “Other” refers to alterations in the MYC or EWSR1 genes. TP53, EGFR, PTCH1, and RET refer to alterations in the genes encoding these proteins.
B. Pie graph of the percentage of actionable aberrations in the indicated targets or target pathways for the 28 patients who had a Matching Score >50%. In these 28 patients, a total of 67 molecular alterations were matched to treatments.
C. Bar graph analyzing the percentage of patients with SD ≥6 months, partial response (PR), and complete response (CR) for patients with a Matching Score of ≤50% (N=49) versus >50% (N=20). P-values were computed using a binary logistic regression test.
D. Bar graph analyzing the percentage of patients with a PFS ratio ≥1.3 versus PFS<1.3 for patients with a Matching Score of ≤50% (N=49) versus >50% (N=20). P-values were computed using a binary logistic regression test.
E. Kaplan-Meier curves display progression-free survival (PFS) for patients with a Matching Score ≤50% (N=55) versus >50% (N=28). P-values are from the log-rank test (two-sided)
F. Kaplan-Meier curves display overall survival (OS) for patients with a Matching Score ≤50% (N=55) versus >50% (N=28). P-values are from the log-rank test (two-sided). *Median OS not reached after a median follow up of 8.5 months.
As previously described,9,11 a “Matching Score” score system was then utilized for each patient. Blinded to patient outcomes, the investigators calculated the total number of molecular alterations matched to the drugs administered and divided that number by the total number of characterized genomic aberrations. Further details for scoring are delineated in the Methods (Matching Score).19–24 We next stratified patients based upon Matching Scores >50% (designated as high; N=28 patients) versus ≤50% [designated as low; N=55 patients including 10 patients with no-MT administered (Matching Scores = 0%)] (Supplementary Table 1).19 The total number of molecular matches for the high group was 67 (mean: 2.4 matches per patient). Patients with high Matching Scores received a median of 2 drugs in their regimen (range: 1–5 drugs) as did patients with low Matching Scores (median: 2 drugs (range: 1–4 drugs)(Supplementary Table 2 and Supplementary Table 4).
Patients were followed until progression of disease, treatment intolerability, or death. The overall median follow up was 10.8 months (95% CI 6.9–14.6; Supplementary Table 5). Overall, 30% of patients evaluable for response achieved disease control [defined as stable disease (SD) ≥6 months (N=4); complete response (CR, N=1); or partial response (PR, N=16)]. When patients were stratified to high and low groups, a high Matching Score was an independent predictor of an increased disease control rate (DCR); 50% of the patients with a high Matching Score achieved disease control as compared to 22.4% of patients with a low Matching Score (P=0.028, Table 2). Amongst the different variables tested, Matching Score >50% was the only parameter significantly associated with higher DCR (Table 2 and Figure 1C). The multivariable analysis confirmed that only a high Matching Score was an independent predictor of higher DCR [odds ratio (OR) 3.6; 95% CI 1.1–11.8; P=0.033].
Table 2.
Comparison of disease control rate, progression-free survival, and overall survival in patients treated on I-PREDICT.
| Disease Control Rate [DCR, SD≥6mos/PR/CR]* | Progression-free Survival (PFS)* | Overall Survival (OS)* | |||||||||||||||||
|---|---|---|---|---|---|---|---|---|---|---|---|---|---|---|---|---|---|---|---|
| Univariable | Multivariable | Univariable | Multivariable | Univariable | Multivariable | ||||||||||||||
| N | OR (95%CI) |
P5 | OR (95%CI) |
P5 | N | Median, months (95% CI) | HR (95% CI) |
P6 | HR (95%CI) |
P6 | N | Median, months (95%CI) |
HR (95%CI) |
P6 | HR (95%CI) |
P6 | |||
| Evaluable patients* | 69 | 21 (30.4%) | --- | --- | --- | --- | 83 | 3.67 (3.36–3.98) | --- | --- | --- | --- | 83 | 11.8 (7.16–16.44) | --- | --- | --- | --- | |
| Age1, years | <62 ≥62 |
33 36 |
9 (27.3%) 12 (33.3%) |
0.75 (0.27–2.11) |
0.585 | --- | --- | 40 43 |
3.67 (2.52–4.82) 3.67 (3.28–4.07) |
0.98 (0.60–1.61) |
0.948 | --- | --- | 40 43 |
17.0 (9.06–24.94) 7.57 (2.70–12.43) |
0.49 (0.25–0.96) |
0.032 | 0.46 (0.24–0.91) |
0.025 |
| Gender | Female Male |
45 24 |
12 (26.7%) 9 (37.5%) |
0.61 (0.21–1.75) |
0.354 | --- | --- | 55 28 |
3.50 (3.08–3.92) 3.87 (2.57–5.17) |
1.45 (0.86–2.45) |
0.163 | 1.85 (1.06–3.21) |
0.029 | 55 28 |
11.97 (8.75–15.19) 10.17 (1.60–18.74) |
0.89 (0.46–1.74) |
0.730 | --- | --- |
| Matched treatment (MT) | ≥1 MT no-MT |
60 9 |
20 (33.3%) 1 (11.1%) |
4.00 (0.47–34.2) |
0.206 | --- | --- | 73 10 |
3.67 (3.34–4.00) 1.93 (1.62–2.24) |
0.65 (0.31–1.38) |
0.253 | --- | --- | 73 10 |
11.8 (7.20–16.40) NR (after a median follow-up of 6.8 months, 95% CI 5.7–7.9) |
1.24 (0.38–4.06) |
0.727 | --- | --- |
| Matching Score (%)2 | >50 ≤50 |
20 49 |
10 (50.0%) 11 (22.4%) |
3.46 (1.15–10.42) |
0.028 | 3.62 (1.11–11.79) |
0.033 | 28 55 |
6.53 (3.16–9.90) 3.13 (2.46–3.80) |
0.40 (0.23–0.71) |
0.001 | 0.34 (0.19–0.62) |
0.0004 | 28 55 |
NR (after a median follow-up of 8.5 months,
95% CI 3.9–13.2) 10.17 (4.34–16.00) |
0.44 (0.19–1.01) |
0.046 | 0.42 (0.18–0.95) |
0.038 |
| Gastrointestinal cancer3 | YES NO |
32 37 |
7 (21.9%) 14 (37.8%) |
0.46 (0.16–1.34) |
0.155 | 0.55 (0.17–1.87) |
0.341 | 35 48 |
3.13 (2.13–4.13) 3.73 (3.39–4.07) |
1.21 (0.74–1.99) |
0.443 | --- | --- | 35 48 |
7.93 (1.36–14.51) 14.07 (9.47–18.66) |
1.44 (0.75–2.76) |
0.266 | --- | --- |
| Gynecologic cancer | YES NO |
12 57 |
4 (33.3%) 17 (29.8%) |
1.18 (0.31–4.44) |
0.810 | --- | --- | 14 69 |
3.87 (3.55–4.19) 3.50 (2.97–4.04) |
1.14 (0.60–2.15) |
0.689 | --- | --- | 14 69 |
NR (after a median follow-up of 8.9 months,
95% CI 6.4–11.3) 11.80 (5.84–17.76) |
0.93 (0.36–2.41) |
0.881 | --- | --- |
| Breast cancer | YES NO |
10 59 |
5 (50.0%) 16 (27.1%) |
2.69 (0.69–10.53) |
0.156 | 1.43 (0.29–7.07) |
0.663 | 12 71 |
3.50 (0.57–6.43) 3.67 (3.30–4.04) |
0.92 (0.45–1.86) |
0.809 | --- | --- | 12 71 |
11.47 (5.51–17.42) 11.97 (4.81–19.12) |
0.81 (0.31–2.09) |
0.657 | --- | --- |
| Combination therapy** | YES NO |
51 18 |
16 (31.4%) 5 (27.8%) |
1.19 (0.36–3.90) |
0.776 | --- | --- | 62 21 |
3.67 (3.36–3.98) 3.63 (2.27–4.99) |
1.09 (0.62–1.93) |
0.766 | --- | --- | 62 21 |
11.47 (6.14–16.79) 20.37 (1.64–39.10) |
1.45 (0.67–3.13) |
0.338 | --- | --- |
| Prior lines of therapy4 | ≤2 >2 |
27 42 |
11 (40.7%) 10 (23.8%) |
2.20 (0.77–6.26) |
0.139 | 2.43 (0.78–7.51) |
0.124 | 34 49 |
3.87 (3.64–4.11) 3.40 (2.54–4.26) |
0.80 (0.48–1.34) |
0.400 | --- | --- | 34 49 |
10.17 (4.44–15.89) 14.07 (6.06–22.07) |
1.15 (0.59–2.22) |
0.683 | --- | --- |
Age cut-off chosen corresponds to the median age.
The cut-off of 50% for the Matching Score was chosen according to the minimum P-value criteria.19
Gastrointestinal cancer includes hepatopancreatobiliary cancer.
Cut-off chosen was the median number of prior lines of therapy administered.
P-values were computed using binary logistic regression analyses (univariable and multivariable). Variables with P<0.2 in univariable analysis were included in the multivariable model.
P-values were computed using the Kaplan-Meier method (two-sided log-rank test for univariable and Cox regression for multivariate analysis); variables with P <0.2 in univariable analysis were included in the Cox regression model (multivariable).
Survival analyses included 83 patients. Disease control rate analysis (SD ≥ 6 months/PR/CR) included the 69 patients evaluable for response; for the remaining 14 patients, the disease control rate was too early to assess, as these patients had stable disease but had not yet had the 6-month follow up scan. Only tumor types with at least 9 patients were tested.
Combination therapy refers to administrations of molecularly matched multi-drug regimens.
Abbreviations: CI = Confidence Interval; CR = complete remission; HR = hazard ratio; MT = matched treatment; N = number; NR = not reached; OR = odds ratio; OS = overall survival; PFS = progression-free survival; PR = partial remission; SD = stable disease; y = year.
A higher Matching Score was also an independent predictor of longer progression-free survival (PFS) (Table 2 and Figure 1E) and overall survival (OS) (Table 2 and Figure 1F) according to Kaplan-Meier analysis20. All treated patients (N=83) were included in the PFS and OS analyses of high Matching Score versus low Matching Score (median PFS: 6.5 versus 3.1 months, P=0.001; median OS: not reached after a median follow up of 8.5 months versus 10.2 months; P=0.046). In multivariable Cox regression models adjusting for patient age, gender, matching score, disease site, combination therapy, and therapy line, a high Matching Score remained the most significant variable associated with a prolonged PFS [HR for low versus high Matching Score: 0.34 (95% CI 0.19–0.62, P=0.0004)] and with a prolonged OS [HR for low versus high Matching Score: 0.42 (95% CI 0.18–0.95, P=0.038)].
Generally, PFS becomes shorter with each line of therapy administered. Thus, we compared the PFS on the study (PFS2) with the immediate prior line of unmatched therapy (PFS1), hence using the patient as their own control. Specifically, we compared the frequency of patients with a PFS ratio (PFS2/PFS1) ≥1.3, based upon the work of Von Hoff and colleagues who reported that 27% (18 of 66) of molecularly matched patients had a PFS ratio of ≥1.3.7 In the current study, a high Matching Score was the only parameter significantly impacting the PFS ratio ≥1.3 in both the univariable (P=0.026) and multivariable analyses (P=0.015) (Table 3 and Figure 1D). Indeed, 75% of patients reached a PFS ratio ≥1.3 if the Matching Score was >50% as compared to 36.6% if the Matching Score was ≤50% (P=0.026) (Figure 1D). These findings indicate PFS can be prolonged by 30% or longer in later lines of therapy when a majority of the molecular alterations are targeted.
Table 3.
Factors associated with prolongation of progression-free survival (PFS) by 30% or greater in later lines of therapy.
| Univariable | Multivariable | ||||
|---|---|---|---|---|---|
| Parameters | Patients with PFS2/PFS1≥1.3 (%)6 | OR (95% CI) | P7 | OR (95% CI) | P7 |
| Evaluable patients1 (N=53) | 24/53=45.3% | --- | --- | --- | --- |
| Age2 | |||||
| < 62 years old (N=24) | 9/24=37.5% | 0.56 (0.19–1.69) | 0.302 | --- | --- |
| ≥ 62 years old (N=29) | 15/29=51.7% | ||||
| Gender | |||||
| Women (N=36) | 15/36=41.7% | 0.64 (0.20–2.03) | 0.443 | --- | --- |
| Men (N=17) | 9/17=52.9% | ||||
| Patients with ≥1 matched therapy administered | |||||
| YES (N=46) | 22/46=47.8% | 2.29 (0.40–13.04) | 0.350 | --- | --- |
| NO (N=7) | 2/7=28.6% | ||||
| Matching Score3 | |||||
| >50% (N=12) | 9/12=75.0% | 5.20 (1.22–22.23) | 0.026 | 8.18 (1.50–44.77) | 0.015 |
| ≤50% (N=41) | 15/41=36.6% | ||||
| Gastrointestinal cancer (includes hepatopancreatobiliary cancer) | |||||
| YES (N=23) | 10/23=43.5% | 0.88 (0.30–2.62) | 0.817 | --- | --- |
| NO (N=30) | 14/30=46.7% | ||||
| Gynecologic cancer | |||||
| YES (N=10) | 3/10=30.0% | 0.45 (0.10–1.97) | 0.289 | 0.20 (0.03–1.42) | 0.108 |
| NO (N=43) | 21/43=48.8% | ||||
| Combination therapy4 | |||||
| YES (N=38) | 18/38=47.4% | 1.35 (0.40–4.54) | 0.628 | --- | --- |
| NO (N=15) | 6/15=40.0% | ||||
| Prior lines of therapy5 | |||||
| ≤2 (N=20) | 7/20=35.0% | 0.51 (0.16–1.59) | 0.245 | 0.48 (0.13–1.73) | 0.262 |
| >2 (N=33) | 17/33=51.5% | ||||
N=53 patients were evaluable for this analysis. Patients were inevaluable mainly because the PFS1 was in the adjuvant/neoadjuvant setting or was a matched therapy.
Age cut-off chosen corresponds to the median age.
The cut-off of 50% for the Matching Score was chosen according to the minimum P-value criteria.19
Combination therapy refers to administrations of molecularly matched multi-drug regimens.
Cut-off chosen was the median line of therapy administered.
PFS2 refers to progression-free survival on the I-PREDICT protocol; PFS1 refers to progression-free survival on the prior unmatched therapy (in a metastatic or an unresectable setting).
P-values by Kaplan-Meier method [two-sided log-rank test (univariable analysis); Cox regression (multivariate analysis)]; variables with P<0.3 in univariable analysis were included in the Cox regression model (multivariable analysis).
We also attempted to understand if other parameters were impacting patient outcomes in a sub-analysis that only included patients who received ≥1 MT (N=73) (Supplementary Table 6). This sub-analysis demonstrated that both a time interval between the tissue biopsy and molecularly matched treatment initiation of <9 months, as well as the addition of chemotherapy in the regimen, increased the rate of patients achieving disease control (SD≥6 months/CR/PR) in a multivariate analysis (P=0.031 and P=0.033, respectively). However, only the Matching Score remained a favorable independent predictor in the multivariable analysis for the PFS and OS analyses (P=0.004 and P=0.050, respectively), further validating earlier studies of this methodology.9,11
We also evaluated the role of targeting downstream of RAS and TP53, two common mutations in cancers (Figure 1A–B). To date, there is not a specific drug known to directly target RAS. Furthermore, the efficacy of MEK inhibitors has been circumstantial and mixed.25 It is unclear if the weak efficacy of current MEK inhibitors for KRAS targeting is a fundamental property of these inhibitors or if it is related to the fact that KRAS alterations are usually accompanied by other drivers that need to be targeted. Of interest in this regard is a recent report demonstrating that a patient with Rosai Dorfman syndrome and a single activating KRAS alteration had a remarkable response to the MEK inhibitor cobimetinib.26 In regard to TP53 aberrations, recent data suggest it may be indirectly/partially target matched with VEGF/VEGFR inhibitors inhibitors (perhaps because loss of p53 function is associated with upregulation of VEGF-A).27,28 Thus, we evaluated the DCR, PFS, and OS for patients with TP53 and/or RAS mutations that were treated with VEGF/VEGFR and/or MEK inhibitors versus patients with TP53 and/or RAS mutations who were not matched to any therapy (Supplementary Table 7). There is no difference between the groups, although the numbers are too small to draw definitive conclusions. However, Wheler and colleagues did address this question in regard to TP53 alterations matched to VEGF/VEGFR inhibitors.27 That report showed that VEGF/VEGFR inhibitor therapy was independently associated with improvement in all outcome parameters for TP53-mutant patients (but not for TP53 wild-type patients) (who received no other molecular-matched agents) treated with VEGF/VEGFR inhibitors (versus those not treated with these agents).
Overall, 16 of 83 treated patients (19.3%) experienced ≥1 serious adverse events (SAE) in the study [14 of 73 (19.2%) with ≥1 MT and 2 of 10 (20%) with no MT administered]. The number of drugs in the regimen was unrelated to the number of SAEs. The SAEs deemed at least possibly or probably related to drug trended to be less common in patients with a Matching Score >50% versus ≤50% [1 (3.6%) versus 7 (15.6%); P=0.14] There were no treatment-related deaths in this study. Taken together, therapy-related SAEs tended to be more common in the patients who received no-MT and in patients with a Matching Score ≤50%. (Supplementary Tables 8–10).
Matching single agents (other than immunotherapies for select individuals) to tumors with multiple genomic alterations is unlikely to result in prolonged or complete remissions. In fact, only two patients (2.7%) in our cohort with ≥1 MT had only one genomic alteration identified. Yet, precision medicine trials performed to date concentrate on finding commonalities between patients and then matching them to monotherapy, a design consistent with traditional treatment models, but inconsistent with the reality unveiled by genomics (i.e., the vast majority of patients with metastatic tumors have numerous genomic alterations that differ from patient to patient).2–6
We achieved a matching rate of 49% (73 of 149 patients), a number considerably higher than in any other precision medicine trials of which we are aware. This high matching rate was based on several key factors: (i) molecular interrogation by NGS for a large panel of cancer-related genes, and including assessment, when possible, of TMB, MSI status, PD-L1 IHC and ctDNA; (ii) timely Molecular Tumor Board discussions (that occurred immediately upon receipt of molecular results including by ad hoc e-meetings) to inform treatment recommendations without delay; and (iii) use of a medication acquisition specialist and clinical trials coordinator to ensure rapid access to drugs. It is important to note that we did not treat canonical tumor types for success. For example, no melanomas were treated and only three lung cancers (3.6%) were included, demonstrating that this approach may be feasible and effective in diseases that are classically not thought of in the setting of molecularly targeted approaches.
The study had several limitations, including the lack of a control group. In addition, the number of alterations detected may depend upon the number of genes interrogated in a given panel test. Therefore, the specific Matching Scores and cut offs could differ between panels. However, the more comprehensive the panel with regard to cancer-related genes, the more accurate the Matching Score should be. Further, the important finding herein is that higher degrees of matching are associated with better outcomes than lower degrees of matching, and that higher Matching Scores often require customized combinations, rather than single agents, as is often given in traditional precision oncology trials. Further validation and assay harmonization studies will be needed to determine a universal cut off for matching, although it remains conceivable that degrees of matching and outcome are related in a continuum. Another limitation relates to the fact that some of the matches, especially in the high Matching Score group, were to immunotherapy and this was often based upon high TMB status. Hence, these results may confound our ability to calculate matching of strictly gene-targeted agents. But, our findings demonstrate that genomics and other biomarkers are more broadly useful for matching a variety of drugs beyond gene-targeted agents. However, our findings may have potential self-selection bias for patients that sought out enrollment on the trial or bias based upon physician referral. Even so, this study represents real-world practice patterns, and the molecular matching of targets with cognate agents is generally independent of these issues and therefore likely to have low impact on the results. Finally, a limitation of the paper is the small number of patients in individual subgroups, such as those with TP53 alterations matched with VEGF/VEGFR inhibitors or RAS mutations matched with MEK inhibitors alone, which precluded determining the efficacy of these matches when not part of a combination regimen. Additional studies with larger sample size are needed.
In conclusion, the administration of N-of-1 customized, multi-drug combinations targeting multiple identified molecular alterations (discerned by NGS) based upon recommendations from a just-in-time Molecular Tumor Board was feasible and safe. Characteristics of this intervention (e.g., the Matching Score) were associated with significant improvements in the disease control rate and all survival parameters. Though we were able to administer ≥1 matched drug to 49% of our patients, substantial numbers of patients still dropped off, mostly due to disease deterioration with hospice placement or demise. Therefore, personalized, precision medicine approaches should be instituted earlier in the course of the disease. At present, there is another study group in the I-PREDICT trial investigating the administration of customized combination therapies in treatment-naïve patients with unresectable and metastatic disease.29 Enrollment is ongoing. Taken together, our findings underscore the safety, feasibility and the importance of designing precision oncology trials that emphasize personalized, individually tailored combination therapies, rather than scripted monotherapies, for patients with lethal cancers. Follow up studies with greater numbers of patients are needed to confirm our findings.
METHODS
Human Research
Ethics Committee:
The Investigation of Profile-Related Evidence Determining Individualized Cancer Therapy (I-PREDICT) was reviewed and approved by the UC San Diego Protocol Review and Monitoring Committee (PRMC) and the Human Research Protections Program (HRRP)/Institutional Review Board (IRB) (Protocol 141758). It was subsequently reviewed and approved by the Avera Cancer Institute PRMC and IRB (Protocol 2015.058). The safety of the protocol was also monitored by the UC San Diego Moores Cancer Center Data Safety Monitoring Board (DSMB).
Ethical Compliance:
During the preparation, submission, conduct, and analysis of this study, we complied with all relevant ethical regulations.
Informed Consent:
All patients enrolled on the I-PREDICT (NCT02534675) study underwent informed consent in their native languages via licensed medical interpreters, as well as signed consented forms in their native languages. Patients who were navigated to an investigational drug or drug(s) that were part of an investigational study signed consent for that study as well.
Study Design
This was a prospective, open label navigational investigation to evaluate the feasibility of using molecular profile-based evidence to determine individualized cancer therapy for patients with incurable malignancies. This was a non-randomized, histology-agnostic trial. Although there would be a case mix of histologies, we know that individual histologies are composed of a heterogeneous mix of genomic alterations. It is not clear that one case mix is better or worse than another. Thus, we designed the study to test a strategy of molecular matching that may apply across cancers.
Sample size:
This feasibility study has descriptive primary analyses to characterize the study findings. There were three groups and only results from Group 3 (previously treated unresectable/metastatic patients) are described herein; groups 1 and 2 (treatment-naïve unresectable and treatment-naïve metastatic with lethal diseases) are not described and are accruing. A Molecular Tumor Board recommended therapy, but treatment decisions were the choice of the physician. The primary study objective was to determine the feasibility of using molecular testing to determine therapy for patients with previously treated cancers with incurable biology (≥50% 2- year cancer-associated mortality). Primary and secondary endpoints included: the proportion of patients who receive molecularly targeted matched treatment after recommendations based on genomic analysis (primary endpoint); proportion of patients with actionable genomic alterations and overall response rate, regression rate, progression-free and overall survival and incidence of high-grade adverse events (secondary and exploratory endpoints). Relevant hypotheses included: patients who receive targeted therapy based upon recommendations from actionable genomic alteration(s) will yield anti-tumor activity; the PFS on matched therapy will be greater than on their last unmatched therapy. For evaluation of treatment decisions, the Study Committee assessed the degree of matching that occurred using the best information available at the time of the data evaluation. The original plan was to enroll 75 evaluable patients. Since this was a hypothesis-generating, descriptive trial, this number was later expanded to permit enrollment of up to 1,000 patients. Based on the fact that a minority of patients is usually matched to therapy on precision medicine trials, it was expected that we would show feasibility with 40% of the 75 evaluable patients (N=30) being matched and 60% treated with no matched therapy (N=45). With the sample size of 30 matched versus 45 unmatched, we would have 79% power to detect a response rate of 0.25 versus 0.05 in the two arms with one-sided 10% type I error rate using the continuity corrected chi-square test. We calculated we would have more than 80% power to detect the difference between the two groups using the log-rank test when the median PFS is 4 months and 2 months for the two arms, respectively. We analyzed group 3 after enrollment of 149 patients; feasibility to administer matched therapy was confirmed because, of the 83 evaluable treated patients, 73 (88% of evaluable treated patients and 49% of enrolled patients) were matched. The ability to compare matched and unmatched patient was limited by the small number of evaluable unmatched patients (N=10). As part of the descriptive analysis, we evaluated the effect of degree of matching in patients with low versus high matching scores (N=55 versus 28 patients).
Early safety stopping rule:
Simon’s two-stage design was used. The null hypothesis was that the true response rate is 0.05 and this would be tested against a one-sided alternative. In the first stage, 13 patients would be accrued. If there were 0 responses in these 13 patients, the study would be stopped. Other early stopping rules were for >10 drug related severe adverse events and >10 drug-related Grade 4–5 toxicities. Early stopping was not triggered in the study.
Data Exclusion:
No data were excluded from analysis.
Replication:
As this is a clinical trial, no replication was possible or performed.
Patients
We analyzed the clinicopathologic and outcomes data of 149 patients with previously treated advanced or metastatic solid malignancies who consented to the I-PREDICT study (Group 3) during the study period. The study was activated on February 13, 2015. Accrual is ongoing in Groups 1 and 2 [patients with treatment-naïve unresectable (Group 1) or metastatic (Group 2) lethal cancers (defined as ≥50% 2-year mortality)] in order to meet accrual goals for analysis.29 Genomic profiling (GP, Foundation Medicine; 236–405 genes), and, if possible, PD-L1 immunohistochemistry (IHC), tumor mutational burden (TMB), microsatellite instability (MSI) status, and next generation sequencing (NGS) of blood-derived circulating tumor DNA (ctDNA) were performed. A Molecular Tumor Board discussed results immediately upon receipt and emphasized customized combination therapies. The attending physician made final treatment decisions. All analyses were based on drugs administered.
Sites and investigator communication:
The protocol was conducted at two sites: University of California San Diego (UC San Diego) Moores Center for Personalized Cancer Therapy and Avera Cancer Institute in Sioux Falls, South Dakota. The study was cross-institutional in that all investigators, regardless of disease affiliation, at each site could enroll patients. Principal investigators and co-investigators, as well as study coordinators reviewed information by teleconference (and/or face-to-face meetings for UC San Diego investigators/coordinators) at least every two weeks. In addition, retreats at the primary site (UC San Diego) to review study information occurred at least every two months, with Avera physicians and staff teleconferenced in as needed.
Molecular Tumor Board:
Molecular Tumor Board face-to-face meetings occurred about weekly and were attended by oncologists, surgeons, radiologists, pathologists, basic scientists, geneticists, colleagues from the UC San Diego Supercomputer Center, and bioinformatics specialists, as well as a medication acquisition specialist and clinical trial coordinators/navigators.30,31 In addition, just-in-time (ad hoc) molecular tumor boards occurred electronically for any patients whom the physician felt could not wait for the face-to-face discussion (and for all patients treated at Avera Cancer Institute); patients were discussed in this case immediately upon receipt of results. All molecular tumor boards had templated information distribution and complied with HIPPA privacy protections regulations.
Next Generation Sequencing, Microsatellite Status (MSI), Tumor Molecular Burden (TMB), and PD-L1 Status by Immunohistochemistry
Next generation sequencing (NGS) was performed by Foundation Medicine on tissue and blood (FoundationOne™, FoundationOne Heme™ and FoundationACT, Cambridge, Massachusetts, http://www.foundationmedicine.com) (CLIA-certified). The FoundationOne™ tissue assay utilized during a majority of the study period interrogates 315 genes, as well as introns of 28 genes involved in rearrangements.32 The current FoundationOne Heme™ tissue assay interrogates 406 genes, as well as introns of 31 genes involved in rearrangements, as well as sequences RNA of 265 genes commonly rearranged in cancer to better identify known and novel gene fusions. Both assays identify all four classes of genomic alterations (i.e., base substitutions, insertions and deletions, copy number alterations, and rearrangements). All specimens were reviewed by a pathologist to ensure specimen viability and tumor content. FoundationACT is a blood-based circulating tumor DNA (ctDNA) assay for solid tumors that identifies clinically relevant genomic alterations driving the growth of a patient’s cancer.33,34 It interrogates the 62 most clinically-relevant cancer genes in solid tumors and is validated to identify all 4 alteration types (base-pair substitutions, insertions/deletions, copy-number alterations and rearrangements). Two patients in this study only had ctDNA results available.
Microsatellite status (a measure of microsatellite instability, or “MSI”) was determined by assessing indel characteristics at 114 homopolymer repeat loci in, or near, the targeted gene regions of the FoundationOne assay and was available for N=52 patients. MSI was reported as MSI-High, MS-Stable, MSI-Ambiguous, or MSI-Unknown when relevant.
The Foundation Medicine, Inc. Laboratory is Clinical Laboratory Improvement Amendments (CLIA) certified. The FoundationOne CDx (F1CDx) is the first U.S. Food and Drug Administration (FDA)-approved broad companion diagnostic (CDx). The F1CDx Tumor Mutation Burden (TMB) result is pending approval in an expanded CDx claim for nivolumab in the front-line setting for non-small cell lung cancer (NSCLC). The TMB categorization (into low, intermediate, and high) was assigned as previously described.35 TMB was defined as the number of somatic, coding, base substitution, and indel mutations per megabase of genome examined. All base substitutions and indels in the coding region of targeted genes, including synonymous alterations, are initially counted before filtering as described below. Synonymous mutations are counted in order to reduce sampling noise. While synonymous mutations are not likely to be directly involved in creating immunogenicity, their presence is a signal of mutational processes that will also have resulted in nonsynonymous mutations and neoantigens elsewhere in the genome. Non-coding alterations were not counted. Alterations listed as known somatic alterations in COSMIC and truncations in tumor suppressor genes were not counted, since our assay genes are biased toward genes with functional mutations in cancer.36 Alterations predicted to be germline by the somatic-germline-zygosity algorithm were not counted.37 Alterations that were recurrently predicted to be germline in our cohort of clinical specimens were not counted. Known germline alterations in dbSNP were not counted. Germline alterations occurring with two or more counts in the ExAC database were not counted.38 To calculate the TMB per megabase, the total number of mutations counted is divided by the size of the coding region of the targeted territory. The nonparametric Mann–Whitney U-test was subsequently used to test for significance in difference of means between two populations.”
While germline genomic alterations in mismatch repair (MMR) genes (e.g., MLH1 and MSH2) and homology directed repair (HDR) genes (e.g., BRCA1, BRCA2, and ATM), as well as bona fide somatic driver alterations were excluded from TMB calculations, they were not excluded from use for drug targeting in the patients with ≥1 matched treatment. TMB results were reported as follows: TMB-High corresponds to greater than or equal to 20 mutations per megabase (Muts/Mb); TMB-Intermediate corresponds to 6–19 Muts/Mb; TMB-Low corresponds to less than or equal to 5 Muts/Mb. TMB was reported for all patients in whom a clinical-grade (CLIA), rather than a research grade, result was available since only CLIA results can be used for making treatment decisions for patients in the United States.
PD-L1 status (performed by Foundation Medicine) was assessed by immunohistochemistry using the U.S. Food and Drug Administration (FDA)-approved Dako 22C3 PD-L1 pharmDx qualitative immunohistochemical assay (pre-diluted by manufacturer), which localizes PD-L1 expression in both tumor cells and tumor-infiltrating immunocytes within formalin-fixed, paraffin-embedded (FFPE) tissue sections. Detection was performed using the Ventana Optiview DAB detection system on the Ventana Benchmark ULTRA platform. If any of these tests had been performed as part of routine physician practice before enrollment, the results could be utilized for recommending therapy.
Hormone Receptor Antibodies:
The hormone receptor antibody analyses were performed as part of standard clinic care at each institution. Estrogen receptor (ER) status was assessed by immunohistochemistry using the Ventana ER (SP1) antibody (pre-diluted by manufacturer) within FFPE tissue sections and detection was performed using the Ventana automated platform at UC San Diego. This test was cleared by the FDA and was used per manufacturer’s instructions. ER status was assessed by immunohistochemistry using the Dako ID5 ER (1:30 dilution; until 9/2015) and Dako EP1 Ready-To-Use Clone (dilution: 1:270; 9/2015–2017) at Avera Cancer Institute. Performance characteristics were verified by either UC San Diego and Avera Cancer Institute Departments of Pathology per Clinical Laboratory Improvement Amendments (CUA ‘88) requirements and in accordance with College of American Pathologists (CAP) checklist requirements and guidance. Androgen receptor (AR) status was assessed by immunohistochemistry using the CellMarque AR (SP107; dilution 1:100) performed at San Diego Pathology (San Diego, CA), a CAP accredited and CLIA certified laboratory facility. A manual platform with decloaker with EDTA buffer was utilized for antigen retrieval.
Therapy and Matching
Therapy was recommended by the Molecular Tumor Board, but the actual therapy given was the choice of the treating oncologist. Treatment was considered “matched” if at least one agent in the treatment regimen targeted at least one aberration, or pathway component, altered in a patient’s molecular profile or a protein preferentially expressed in the tumor [e.g., estrogen receptor (ER) or androgen receptor (AR) or Her2 status] as assessed by standard of care testing other than NGS, or PD-L1 expression assessed by immunohistochemistry as above). For small molecule inhibitors, matching was based on low inhibitory concentration 50% (IC50) of the drug for the target (generally, less than 100 nM) or for effectors immediately downstream of the gene product altered. Antibodies were considered matched if their primary target was the product of the molecular alteration. Matching designation was confirmed by the senior investigators (RK and JS), who were blinded to patient outcomes at the time of designation. Patients were stratified into those having received at least one matched treatment (1 MT) versus no matched treatment (no-MT) administered, with a later further stratification into those who received treatment with Matching Scores >50% versus ≤50%. For patients navigated to a secondary clinical trial, to which they consented, the doses used were as per the clinical trial for that cohort. Otherwise, dosing combinations of drugs was done according to safety rules gleaned from the literature.21–24 If the combination of drugs had established dosing known from clinical trials in the literature, that dosing was utilized. If the dosing was unknown, we used data from our analyses of almost 75,000 patients treated in the literature21–24 and further modified this after discussion in our Molecular Tumor Board and consultation with our PharmD, as needed. Essentially, for de novo combinations, we started patients at about 50% of the usual dose of each drug for two drug combinations, and at about one-third of the dose of each drug for three-drug combinations. Patients then received escalating doses of drug to tolerance, while being monitored closely by their treating physicians. Combinations of drugs with overlapping toxicities were avoided. The safety of the protocol was also monitored by our Data Safety Monitoring Board.
Medication Acquisition Specialist and Clinical Trial Coordinators
In order to obtain medications in a timely fashion, a medication acquisition specialist and clinical trial coordinators attended the face-to-face Molecular Tumor Boards. They were available immediately upon physician request at other times. Their purpose was to assist with obtaining on- and/or off-label approved drugs, as well as information about relevant clinical trials utilizing investigational or off-label drugs.
Matching Score
An exploratory scoring system (“Matching Score”) was developed, as previously described.6,9 The Matching Score was calculated post hoc by investigators blinded to outcomes at the time and it was based upon the actual drugs administered. Under this system, the higher the Matching Score, the better the match. In general, the Matching Score was calculated by dividing the number of alterations matched in each patient (numerator) by the number of characterized aberrations in that patient’s tumor (denominator). For instance, if a patient’s tumor harboring six genomic aberrations received two drugs that targeted three of the patient’s genomic alterations, the Matching Score would be 3/6 or 50%. This is because certain drugs targeted more than one alteration (e.g., many small molecule inhibitors often have activity against multiple kinases) and were counted as matches for each identified genomic alteration that was matched.
Other considerations were as follows:
two mutations in the same gene that had the same effect (e.g., loss of function) counted as one aberration in the denominator; two mutations in the same gene that were known to function differently counted twice.
two different structural alterations in the same gene (e.g., amplification and mutation) were counted as two aberrations in the denominator since they have different functional effects (e.g., overexpression versus activation);
two drugs targeting the same alteration were counted twice in both the numerator and denominator if they had well-established synergy (e.g. the FDA-approved combinations of dabrafenib and trametinib for BRAF mutations, or pertuzumab and trastuzumab ERBB2 alterations);
only if the patient was matched (in part) based on hormone (ER) positivity in the tissue biopsied for genomic analysis, the ER status was then added to both the numerator and the denominator;
all variants of unknown significance were excluded;
in the case of cell cycle inhibitors that targeted CDK4/6, we counted any concomitant CDK4/6 and CDKN2A/B alterations (N=2 patients) or CCND1/2/3 and CDKN2A/B alterations (N=2 patients) as one alteration and one drug target in the numerator and denominator, because the CDKN2A protein, p16(INK4a), directly binds to the CDK4/CDK6/Cyclin D1 complex, thus regulating their activity.39,40
TP53 alterations were considered matched to anti-angiogenic agents, based on data showing that TP53 mutations are associated with upregulation of VEGF-A and that treatment of TP53-mutant tumors with anti-angiogenic agents is associated with improved outcomes.27,28,41,42
if the patient was treated with immunotherapy (e.g., anti-PD-1 or anti-PD-L1 checkpoint inhibitors), the Matching Score was 100% for PD-L1 IHC high positive, TMB high, MSI high results (or MHL1, MSH2, MSH6, PMS2 alterations), or if none of the aforementioned were known, but the patient had ≥8 genomic alterations (N=1 patient) based upon the assumption of a high TMB.
if PD-L1 IHC was low positive, the TMB was intermediate, or there was a CD274 (PD-L1) amplification, the Matching Score was 50%; if the patient received a combination of a checkpoint inhibitor and a gene-targeted drug that matched one or more of his/her genomic alterations, the score was >50%. As an example, if a patient had intermediate TMB and a MET amplification, as well as a TP53 mutation, and was treated with nivolumab and the MET inhibitor, crizotinib, the Matching Score would be >50%.
if more than one NGS report was available, the alterations in each report were counted (since there can be heterogeneity between tissue biopsies);
if a patient’s regimen included drugs that did not match any alteration, those drugs received a Matching Score of 0.
The cut-off of 50% for the analyses of low versus high Matching Scores was chosen according to the minimum P-value criteria.19 See Supplemental Text for selected examples of therapy and Matching Score methodology.
Alternative Approach to Matching Score for Immune Checkpoint Blockade
There may be alternative approaches to scoring matches, especially in the case of immunotherapy, as one drug may be used in some circumstances to theoretically target multiple genomic alterations. It is becoming increasingly evident that immune checkpoint blockade and genomics are not separate silos, but rather linked to each other. This is because abnormalities in DNA damage repair and DNA replication can result in increased rates of somatic mutations in tumors. In turn, the presentation of neo-antigens generated by the mutanome in combination with immune system activation by checkpoint blockade can distinguish normal from tumor tissue. Based on studies demonstrating a relationship between TMB and immunotherapy response (i.e., the higher the TMB, the greater the response rate) and between other gene alterations, such as PDL1 amplification and response, genomics is directly relevant to selecting patients for immune checkpoint blockade.17,43 Furthermore, the FDA has approved the immune checkpoint inhibitor, pembrolizumab, for any solid tumor with alterations in DNA mismatch repair pathway genes (e.g.,MSH2, MSH6, MLH1, PMS2) due to associated large increases in TMB.35 Moreover, TMB increases correlate with a higher neoantigen load based upon somatic mutation data from the TCGA.44 In turn, these would be expected to be more immunogenic and therefore responsive to immunotherapy.17
In a retrospective fashion that was unblinded to outcomes, we developed an alternative approach for scoring immune checkpoint blockade matches. In a histology agnostic fashion, we previously reported objective response rates (ORR, %) for patients receiving immunotherapy in the setting of low, intermediate, and high TMB.17 Therefore, we adopted these ORRs as the matching scores for intermediate TMB (15/48 = 31%) and high TMB (22/38 = 58%) tumors. As noted above, four patients (47, 121, 155, A011) had high TMB and received immunotherapy, while four more patients (102, 115, A035, A037) had intermediate TMB and received immunotherapy. Following evaluation with this alternative Matching Score approach, all eight patients remained in their same assigned group with Matching Scores >50%. Thus, none of the results changed. Furthermore, if we assessed CD274 amplification targeted with immunotherapy as one alterations targeted by one drug, the two patients (141, A016) with CD274 amplifications and 11 or 12 other alterations who received immunotherapy remained in the Matching Score ≤50% group. Again, the two patients’ group assignments did not change with the amended scoring. See Supplemental Text for selected examples of immunotherapy and alternative Matching Score methodology.
Response/Outcome Endpoints
All patients were assessed using RECIST version 1.1 by board-certified radiologists at both UC San Diego and Avera Cancer Institute. Selected Avera cases were secondarily reviewed at UC San Diego. The following radiological endpoints were considered: (i) disease control rate (DCR) = rate of [stable disease (SD) ≥6 months + partial response (PR) + complete response (CR)] according to RECIST 1.1;45 (ii) progression-free survival (PFS) of therapy given under the I-PREDICT protocol (PFS2); (iii) PFS2 versus PFS1 (immediate prior line of therapy using patients as their own control),7,46; (iv) percent of patients with a PFS2/PFS1 ratio ≥1.3;7 and (v) overall survival (OS). SD, PR, or CR was initially determined per the assessment of the treating physician. Patients with ongoing SD for less than six months at the date of data cut off were considered inevaluable for the DCR. However, they were evaluable for PFS and OS. PFS was defined as the time from the beginning of therapy to disease progression, or the time to last follow up for patients that were progression-free (patients that were progression-free on the date of last follow up were censored on that date). OS was defined as the time from the beginning of therapy to death, or last follow-up date for patients who were alive (the latter were censored on that date). The cut-off date of the analysis was August 15, 2017 and cut-off date for patients included was consent by end of June 2017.
Patients were inevaluable for comparison of PFS on study to prior PFS if prior PFS was for therapy given in the adjuvant or neo-adjuvant setting or if prior therapy included a matched drug. Patients were considered inevaluable for therapy outcome if: (i) they did not receive treatment by 6 months after consent; (ii) patients had not received at least 10 days of therapy (if the drug was taken orally); (iii) patients had not received two doses of an intravenous drug given once every two weeks or more often; or (iv) patients had received only one dose of drug in case of an intravenous drug given every three weeks or less frequently.
Data Collection and Data Analysis
All data was collected in a Microsoft Access 2013 (version 15.0) database. Logistic regressions were performed for binary endpoints. Hazard ratios (HR) for the PFS and OS were analyzed by the Kaplan-Meier method20 and the log-rank test was used to compare the survival endpoints by groups. Cox regression models were used as multivariable analysis when appropriate for survival endpoints. The importance of a prognostic factor was assessed by the odds ratio (OR) using log-rank test and logistic regression/Cox regression models). Statistical analysis was performed by MS and RO, as well as verified by JJL using SPSS version 24.0.
Life Sciences Reporting Summary
Additional methodological details can be found in the “Life Sciences Reporting Summary.”
Data Availability
Supporting source data for all figures and tables are made available in Supplementary Table 1 and Supplementary Table 2.
Extended Data
Extended Data Figure 1.
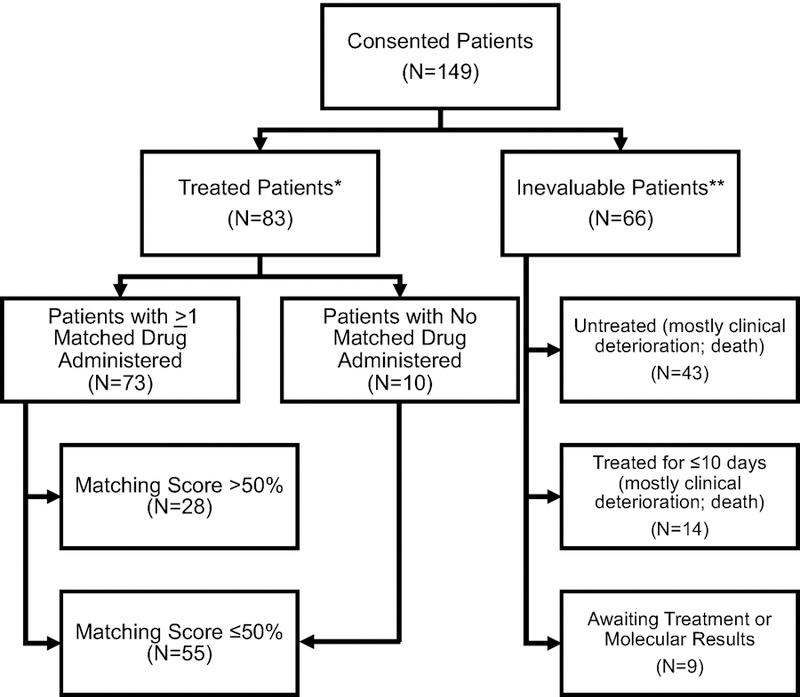
Consolidated Standards of Reporting Trials (CONSORT) diagram, which includes the 149 patients that consented to I-PREDICT.
* Treated evaluable patients includes patients who received >10 d of treatment for drugs given on a daily basis (generally drugs given by mouth) or at least two doses of a drug normally given every two weeks or more frequently (the latter generally being intravenous drugs). Only patients whose treatment was reviewed and validated by data analysis lockdown are included.
** One patient had inadequate tissue for NGS and declined biopsy; he was later reenrolled after he agreed to undergo biopsy.
Note: One treated patient who initially was believed to have prior therapy was found, after data lockdown analysis, to have not received the prior regimen.
Supplementary Material
ACKNOWLEDGEMENTS:
We thank J. Wrolstad, M. Scur, and J. Porter for their critical roles in clinical trial and data management, L. Marquez for medication acquisition, D. Sandler and S. Silverman for assistance with manuscript preparation, T. Reya for her critical review of the manuscript, and most importantly, the patients and their families.
FINANCIAL SUPPORT:
This work was supported in part by Foundation Medicine Inc. (JKS, RO, BLJ, RK), as well as the Joan and Irwin Jacobs Philanthropic Fund (RK), the Jon Schneider Memorial Cancer Research Fund (JKS, PTF) and NIH P30CA023100 (JKS, SML, RK), and NIH P30CA016672 (JJL). The authors also acknowledge the support of NIH K08CA168999 and R21CA192072, as well as Pedal the Cause, David Foundation, and Kristen Ann Carr Fund (JKS).
Footnotes
COMPETING INTERESTS:
Jason Sicklick receives research funds from Foundation Medicine Inc., Novartis Pharmaceuticals, Blueprint Medicines, and Amgen, as well as consultant fees from Loxo, Biotheranostics, and Grand Rounds. Michael Hahn receives research funds from General Electric and is an equity holder in Illumina, Inc. Casey Williams receives research support from Takeda, Tesaro, and Pfizer, as well as consultant fees from Takeda. Vincent Miller, Jeffrey Ross, and Jennifer Webster are employees and equity holders in Foundation Medicine Inc. Vincent Miller is also on the Board of Directors for Revolution Medicines (equity and compensation >$10,000) and has patent royalties for EGFR T790M testing issued to Memorial Sloan Kettering Cancer Center. Adam Benson is formerly an employee and is an equity holder in Foundation Medicine Inc. He is now an employee of Scipher Medicine. Philip J. Stephens is formerly an employee and is formerly an equity holder in Foundation Medicine Inc. He is now an employee of Grail, Inc. J. Jack Lee served on the Statistical Advisory Board of AbbVie. Razelle Kurzrock has research funding from Incyte, Genentech, Merck Serono, Pfizer, Sequenom, Grifols, Omniseq, Foundation Medicine Inc., Guardant Health, and Konica Minolta, as well as consultant fees from Loxo, Actuate Therapeutics, Roche, Xbiotech and NeoMed. She serves as an advisor to Soluventis. She receives speaker fees from Roche, and has an equity interest in IDbyDNA, Curematch, Inc., and Soluventis. All other authors have no relationships to disclose.
REFERENCES
- 1.Kato S, Subbiah V & Kurzrock R Counterpoint: Successes in the Pursuit of Precision Medicine: Biomarkers Take Credit. Journal of the National Comprehensive Cancer Network : JNCCN 15, 863–866 (2017). [DOI] [PMC free article] [PubMed] [Google Scholar]
- 2.Gerlinger M, et al. Intratumor heterogeneity and branched evolution revealed by multiregion sequencing. The New England journal of medicine 366, 883–892 (2012). [DOI] [PMC free article] [PubMed] [Google Scholar]
- 3.Hoadley KA, et al. Multiplatform analysis of 12 cancer types reveals molecular classification within and across tissues of origin. Cell 158, 929–944 (2014). [DOI] [PMC free article] [PubMed] [Google Scholar]
- 4.Ciriello G, et al. Emerging landscape of oncogenic signatures across human cancers. Nature genetics 45, 1127–1133 (2013). [DOI] [PMC free article] [PubMed] [Google Scholar]
- 5.Kandoth C, et al. Mutational landscape and significance across 12 major cancer types. Nature 502, 333–339 (2013). [DOI] [PMC free article] [PubMed] [Google Scholar]
- 6.Wheler J, Lee JJ & Kurzrock R Unique molecular landscapes in cancer: implications for individualized, curated drug combinations. Cancer research 74, 7181–7184 (2014). [DOI] [PMC free article] [PubMed] [Google Scholar]
- 7.Von Hoff DD, et al. Pilot study using molecular profiling of patients’ tumors to find potential targets and select treatments for their refractory cancers. Journal of clinical oncology : official journal of the American Society of Clinical Oncology 28, 4877–4883 (2010). [DOI] [PubMed] [Google Scholar]
- 8.Tsimberidou AM, et al. Personalized medicine in a phase I clinical trials program: the MD Anderson Cancer Center initiative. Clinical cancer research : an official journal of the American Association for Cancer Research 18, 6373–6383 (2012). [DOI] [PMC free article] [PubMed] [Google Scholar]
- 9.Schwaederle M, et al. Precision Oncology: The UC San Diego Moores Cancer Center PREDICT Experience. Molecular cancer therapeutics 15, 743–752 (2016). [DOI] [PubMed] [Google Scholar]
- 10.Le Tourneau C, et al. Molecularly targeted therapy based on tumour molecular profiling versus conventional therapy for advanced cancer (SHIVA): a multicentre, open-label, proof-of-concept, randomised, controlled phase 2 trial. The lancet oncology 16, 1324–1334 (2015). [DOI] [PubMed] [Google Scholar]
- 11.Wheler JJ, et al. Cancer Therapy Directed by Comprehensive Genomic Profiling: A Single Center Study. Cancer research 76, 3690–3701 (2016). [DOI] [PubMed] [Google Scholar]
- 12.Chen AP, et al. Feasibility of molecular profiling based assignment of cancer treatment (MPACT): A randomized NCI precision medicine study. Journal of Clinical Oncology 34, 2539–2539 (2016). [Google Scholar]
- 13.Tsimberidou AM, et al. Initiative for Molecular Profiling and Advanced Cancer Therapy (IMPACT): An MD Anderson Precision Medicine Study. JCO Precis Oncol 2017(2017). [DOI] [PMC free article] [PubMed] [Google Scholar]
- 14.Massard C, et al. High-Throughput Genomics and Clinical Outcome in Hard-to-Treat Advanced Cancers: Results of the MOSCATO 01 Trial. Cancer discovery 7, 586–595 (2017). [DOI] [PubMed] [Google Scholar]
- 15.Prasad V Perspective: The precision-oncology illusion. Nature 537, S63 (2016). [DOI] [PubMed] [Google Scholar]
- 16.Patel SP & Kurzrock R PD-L1 Expression as a Predictive Biomarker in Cancer Immunotherapy. Molecular cancer therapeutics 14, 847–856 (2015). [DOI] [PubMed] [Google Scholar]
- 17.Goodman AM, et al. Tumor Mutational Burden as an Independent Predictor of Response to Immunotherapy in Diverse Cancers. Molecular cancer therapeutics 16, 2598–2608 (2017). [DOI] [PMC free article] [PubMed] [Google Scholar]
- 18.Le DT, et al. PD-1 blockade in tumors with mismatch-repair deficiency. New England Journal of Medicine 372, 2509–2520 (2015). [DOI] [PMC free article] [PubMed] [Google Scholar]
- 19.Mazumdar M & Glassman JR Categorizing a prognostic variable: review of methods, code for easy implementation and applications to decision-making about cancer treatments. Statistics in medicine 19, 113–132 (2000). [DOI] [PubMed] [Google Scholar]
- 20.Goel MK, Khanna P & Kishore J Understanding survival analysis: Kaplan-Meier estimate. International journal of Ayurveda research 1, 274–278 (2010). [DOI] [PMC free article] [PubMed] [Google Scholar]
- 21.Nikanjam M, Patel H & Kurzrock R Dosing immunotherapy combinations: Analysis of 3,526 patients for toxicity and response patterns. Oncoimmunology 6, e1338997 (2017). [DOI] [PMC free article] [PubMed] [Google Scholar]
- 22.Liu S, Nikanjam M & Kurzrock R Dosing de novo combinations of two targeted drugs: Towards a customized precision medicine approach to advanced cancers. Oncotarget 7, 11310–11320 (2016). [DOI] [PMC free article] [PubMed] [Google Scholar]
- 23.Nikanjam M, Liu S, Yang J & Kurzrock R Dosing Three-Drug Combinations That Include Targeted Anti-Cancer Agents: Analysis of 37,763 Patients. The oncologist 22, 576–584 (2017). [DOI] [PMC free article] [PubMed] [Google Scholar]
- 24.Nikanjam M, Liu S & Kurzrock R Dosing targeted and cytotoxic two-drug combinations: Lessons learned from analysis of 24,326 patients reported 2010 through 2013. International journal of cancer. Journal international du cancer 139, 2135–2141 (2016). [DOI] [PMC free article] [PubMed] [Google Scholar]
- 25.Wood K, Hensing T, Malik R & Salgia R Prognostic and Predictive Value in KRAS in Non-Small-Cell Lung Cancer: A Review. JAMA Oncol 2, 805–812 (2016). [DOI] [PubMed] [Google Scholar]
- 26.Jacobsen E, Shanmugam V & Jagannathan J Rosai-Dorfman Disease with Activating KRAS Mutation - Response to Cobimetinib. The New England journal of medicine 377, 2398–2399 (2017). [DOI] [PubMed] [Google Scholar]
- 27.Wheler JJ, et al. TP53 Alterations Correlate with Response to VEGF/VEGFR Inhibitors: Implications for Targeted Therapeutics. Molecular cancer therapeutics 15, 2475–2485 (2016). [DOI] [PubMed] [Google Scholar]
- 28.Koehler K, Liebner D & Chen JL TP53 mutational status is predictive of pazopanib response in advanced sarcomas. Annals of oncology : official journal of the European Society for Medical Oncology / ESMO 27, 539–543 (2016). [DOI] [PMC free article] [PubMed] [Google Scholar]
- 29.Sicklick JK, et al. Personalized, Molecularly Matched Combination Therapies for Treatment-Naïve, Lethal Malignancies: The I-PREDICT Study. Journal of Clinical Oncology 35, 2512–2512 (2017). [Google Scholar]
- 30.Parker BA, et al. Breast Cancer Experience of the Molecular Tumor Board at the University of California, San Diego Moores Cancer Center. Journal of oncology practice 11, 442–449 (2015). [DOI] [PubMed] [Google Scholar]
- 31.Schwaederle M, et al. Molecular tumor board: the University of California-San Diego Moores Cancer Center experience. The oncologist 19, 631–636 (2014). [DOI] [PMC free article] [PubMed] [Google Scholar]
- 32.Frampton GM, et al. Development and validation of a clinical cancer genomic profiling test based on massively parallel DNA sequencing. Nature biotechnology 31, 1023–1031 (2013). [DOI] [PMC free article] [PubMed] [Google Scholar]
- 33.Stephens P, et al. Analytic validation of a clinical circulating tumor DNA assay for patients with solid tumors. [ASCO abstract #e23049]. Journal of clinical oncology : official journal of the American Society of Clinical Oncology 34(2016). [Google Scholar]
- 34.Hartmaier RJ, et al. High-Throughput Genomic Profiling of Adult Solid Tumors Reveals Novel Insights into Cancer Pathogenesis. Cancer research 77, 2464–2475 (2017). [DOI] [PubMed] [Google Scholar]
- 35.Chalmers ZR, et al. Analysis of 100,000 human cancer genomes reveals the landscape of tumor mutational burden. Genome medicine 9, 34 (2017). [DOI] [PMC free article] [PubMed] [Google Scholar]
- 36.Bamford S, et al. The COSMIC (Catalogue of Somatic Mutations in Cancer) database and website. British journal of cancer 91, 355–358 (2004). [DOI] [PMC free article] [PubMed] [Google Scholar]
- 37.Sun JX, et al. A computational approach to distinguish somatic vs. germline origin of genomic alterations from deep sequencing of cancer specimens without a matched normal. PLoS computational biology 14, e1005965 (2018). [DOI] [PMC free article] [PubMed] [Google Scholar]
- 38.Lek M, et al. Analysis of protein-coding genetic variation in 60,706 humans. Nature 536, 285–291 (2016). [DOI] [PMC free article] [PubMed] [Google Scholar]
- 39.Helsten T, et al. Cell-Cycle Gene Alterations in 4,864 Tumors Analyzed by Next-Generation Sequencing: Implications for Targeted Therapeutics. Molecular cancer therapeutics 15, 1682–1690 (2016). [DOI] [PubMed] [Google Scholar]
- 40.Kato S, et al. Cyclin-dependent kinase pathway aberrations in diverse malignancies: clinical and molecular characteristics. Cell cycle 14, 1252–1259 (2015). [DOI] [PMC free article] [PubMed] [Google Scholar]
- 41.Said R, et al. P53 Mutations in Advanced Cancers: Clinical Characteristics, Outcomes, and Correlation between Progression-Free Survival and Bevacizumab-Containing Therapy. Oncotarget 4, 705–714 (2013). [DOI] [PMC free article] [PubMed] [Google Scholar]
- 42.Schwaederle M, et al. VEGF-A Expression Correlates with TP53 Mutations in Non-Small Cell Lung Cancer: Implications for Antiangiogenesis Therapy. Cancer research 75, 1187–1190 (2015). [DOI] [PubMed] [Google Scholar]
- 43.Goodman AM, et al. Prevalence of PDL1 Amplification and Preliminary Response to Immune Checkpoint Blockade in Solid Tumors. JAMA Oncol (2018). [DOI] [PMC free article] [PubMed]
- 44.Jia J, et al. Correlation of tumor mutational burden and predicted functional impact of mutations across cancer types. Journal of Clinical Oncology 36, abstr e24296 (2018). [Google Scholar]
- 45.Eisenhauer EA, et al. New response evaluation criteria in solid tumours: revised RECIST guideline (version 1.1). European journal of cancer (Oxford, England : 1990) 45, 228–247 (2009). [DOI] [PubMed] [Google Scholar]
- 46.Dhani N, Tu D, Sargent DJ, Seymour L & Moore MJ Alternate endpoints for screening phase II studies. Clinical cancer research : an official journal of the American Association for Cancer Research 15, 1873–1882 (2009). [DOI] [PubMed] [Google Scholar]
Associated Data
This section collects any data citations, data availability statements, or supplementary materials included in this article.
Supplementary Materials
Data Availability Statement
Supporting source data for all figures and tables are made available in Supplementary Table 1 and Supplementary Table 2.