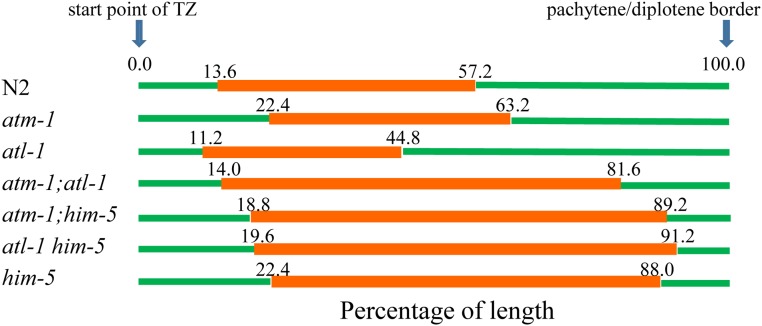
Figure 8.
DSB-2 staining manifests different kinetics in the absence of ATM-1 or ATL-1 functions. Proportion of length of the germline region from meiotic onset to the pachytene/diplotene border that stain positive for nuclear localized DSB-2. Nonstained regions (green); stained (red). Genotypes are shown to the left with the average DSB-2 region depicted in orange (n = 3, 6, 7, 4, 4, 5, 6 for N2, atm-1, atl-1, atm-1;atl-1, atm-1;him-5, atl-1 him-5, and him-5, respectively).

