

Urinary proteomes from 49 healthy adult donors were comprehensively analyzed. Besides age, gender was found to be a crucial factor contributing to individual variation. Proteins that were increased in the male urine samples include major prostate-secreted proteins, and those that were increased in the female urine samples are enriched in immunological pathways. Reference intervals of each urinary protein were estimated, providing the baseline for the discovery of abnormalities.
Keywords: Urine analysis, Biofluids*, Protein Identification*, Label-free quantification, Mass Spectrometry
Graphical Abstract

Highlights
Comprehensive analysis of inter-individual variation of normal urinary proteome.
Significant gender differences were observed.
Proteins increased in female urine are enriched in immunological pathways.
Estimated reference intervals of proteins as the baseline for biomarker discovery.
Abstract
Disease biomarkers are the measurable changes associated with a pathophysiological process. Without homeostatic control, urine accumulates systematic changes in the body. Thus, urine is an attractive biological material for the discovery of disease biomarkers. One of the major bottlenecks in urinary biomarker discovery is that the concentration and composition of urinary proteins are influenced by many physiological factors. To elucidate the individual variation and related factors influencing the urinary proteome, we comprehensively analyzed the urine samples from healthy adult donors (aged 20–69 years). Co-expression network analysis revealed protein clusters representing the metabolic status, gender-related differences and age-related differences in urinary proteins. In particular, we demonstrated that gender is a crucial factor contributing to individual variation. Proteins that were increased in the male urine samples include prostate-secreted proteins and TIMP1, a protein whose abundance alters under various cancers and renal diseases; however, the proteins that were increased in the female urine samples have known functions in the immune system. Nine gender-related proteins were validated on 85 independent samples by multiple reaction monitoring. Five of these proteins were further used to build a model that could accurately distinguish male and female urine samples with an area under curve value of 0.94. Based on the above results, we strongly suggest that future biomarker investigations should consider gender as a crucial factor in experimental design and data analysis. Finally, reference intervals of each urinary protein were estimated, providing a baseline for the discovery of abnormalities.
Disease biomarkers are the measurable changes associated with a pathophysiological process (1). Without homeostatic control, urine accumulates systematic changes in the body (1, 2). Thus, urine is an attractive biological material for disease biomarker discovery. With the development of techniques, urinary proteomics has become one of the most popular fields in biomarker discovery. Although the total amount of proteins in normal urine is much lower than that in plasma, urine contains a large variety of protein species. To date, over six thousand proteins have been identified by the deep profiling of the normal human urinary proteome (3). The urinary proteome is mainly composed of plasma proteins that pass the glomerular barrier and proteins shed by cells within the urogenital system; therefore, it could reflect both systemic and local conditions of the body (4, 5). Applications of urinary proteomics have been focused on urogenital diseases (6, 7), and there is also a large amount of evidence supporting that changes in urinary proteins could reflect disorders at distant locations such as pancreatitis (8, 9), cardiovascular system diseases (10, 11), brain diseases (12), and breast cancers (13–15).
One of the major bottlenecks in urinary protein biomarker discovery is that both the concentration and composition of urinary proteins are influenced by physiological factors such as aging, sex hormones, diet and exercise (16–24). Previous observations showed a considerable level of intra-individual variation (i.e. variation in the proteins from urine samples collected from the same individual at different time points) (25–29) and an even higher level of inter-individual variation (26, 27) in the normal urinary proteome. In 2011, Mann and colleagues quantified over 600 proteins in the urine samples from seven individuals collected over three consecutive days and evaluated the technical, intra-individual, inter-individual and overall variations in the urinary proteome. In one of our early studies (30), the variation in the urinary proteome was measured in samples from ten male and ten female healthy volunteers by a semi-quantitative method. Inter-gender variation was observed to be greater than intra-gender variation.
Determining the levels and sources of variation among normal urinary proteomes is the foundation to distinguishing the real disease-mediated alterations from those caused by physiological conditions. This goal could not be achieved using a small sample size, as most of the previous studies have used. Recently, Leng et al. established a highly efficient workflow to analyze the sediment of urine samples acquired by ultracentrifugation at high speed (31). They measured the variation among 497 urine samples collected from 167 healthy donors and established reference intervals for ∼2000 proteins. However, to the best of our knowledge, studies of the urinary supernatant, which is the most popular urine sample in biomarker studies with comparable sample sizes, have not been conducted.
In this study, the urine samples from a total of 134 healthy donors were analyzed with proteomic approaches. A total of 49 samples were comprehensively analyzed by 2D LC-MS/MS in the discovery phase to evaluate individual variation in the urinary proteome. A network was established to explore the co-expression patterns of urinary proteins. Markedly different patterns between the male and female urinary proteomes were observed. The gender-related differences were then validated with a set of samples from the other 85 donors, demonstrating that gender is one of the main factors that contributes to individual variation in the normal urinary proteome. Finally, the reference intervals for each gender were estimated, providing a baseline to discover changes under disease conditions. The workflow of this study is illustrated in Fig. 1.
Fig. 1.

The flowchart of the urinary proteome analysis of individuals.
EXPERIMENTAL PROCEDURES
Experimental Design and Statistical Rationale
All donors of the urine samples were recruited from a cohort at the PLA General Hospital in Beijing, China. Donors were provided written informed consent. All the protocols for urine collection were approved by the Ethics Board. All donors were free of acute or chronic illnesses and were not taking any prescription or over-the-counter medications at the time of urine collection. Female donors were not pregnant or menstruating at the time of urine collection. All donors completed a series of physical examinations and laboratory tests. Measurements such as blood pressure, body mass index (BMI)1, plasma glucose level, total cholesterol (TC), triglyceride (TG), urinary white blood cell, red blood cell and total protein levels, and estimated glomerular filtration rate (eGFR) were employed to select healthy donors. A total of 134 healthy donors aged 20 to 69 years were included in this study. The detailed characterization of donors is provided in supplemental Table S1.
One second voided urine specimen was collected from each donor. Samples were divided into two sets. Set I, including 49 urine samples, was used as the discovery group and analyzed by 2D LC-MS/MS. Set II, including the remaining 85 samples, was used as the validation group for targeted multiple reaction monitoring (MRM) analysis (tier 3). In both sets I and II, each gender and age group were represented by a similar number of donors. The donors were categorized by their age and gender as summarized in Table I. To evaluate the technical reproducibility of the profiling and targeted MS experiments, quality control (QC) samples were generated by pooling all samples in sets I and II in equal amounts and were repeatedly analyzed throughout the entire MS process.
Table I. Characteristics of urine donors. F, female; M, male.
| Age group | Set I (F/M) | Set II (F/M) |
|---|---|---|
| A (20–30 years) | 7/3 | 9/9 |
| B (30–40 years) | 6/4 | 9/5 |
| C (40–50 years) | 4/6 | 10/10 |
| D (50–60 years) | 7/3 | 6/10 |
| E (>60 years) | 4/5 | 9/8 |
Urine Sample Collection and Storage
Urine samples were collected in 250 ml conical tubes, immediately acidified to pH 2.7 with hydrochloric acid and then stored at −80 °C to prevent bacterial growth and proteolysis.
Sample Preparation
Samples were centrifuged at 5000 × g for 30 min, and the precipitates were removed. The supernatants were precipitated overnight at 4 °C using 3 times the volume of ethanol for 2 h. After 30 min of centrifugation at 10000 × g, the pellets were resuspended in lysis buffer (7 m urea, 2 m thiourea, 0.1 m DTT, and 50 mm Tris). The protein concentration of each sample was quantified by the Bradford method.
Five hundred micrograms of protein from each sample were digested with the filter-aided sample preparation (FASP) method (32). The protein samples were reduced with 20 mm DTT at 37 °C for 1 h and then carboxyamidomethylated with 50 mm IAA at room temperature in the dark for 45 min. Then, the sample was loaded onto a 10 KD ultracentrifugation filter, washed twice with UA buffer (containing 7 m urea and 50 mm Tris), and washed twice with 25 mm NH4HCO3. The treated samples were digested with trypsin (2 μg per 100 μg protein) in 25 mm NH4HCO3. The digested peptides were eluted from the 10 KD filter, and the samples desalted on C18 columns (3 cc, 60 mg, Oasis, Waters Corporation, Milford, MA). The desalted peptides were lyophilized by vacuum centrifugation and stored at −80 °C.
2DLC-MS/MS Analysis
Offline HPLC separation. The digested peptides were fractionated using a high pH RPLC column from Waters (4.6 mm×250 mm, Xbridge C18, 3 μm, Waters Corporation, Milford, MA). The samples were loaded onto the column in buffer A1 (H2O, pH = 10). The elution gradient was 5–35% buffer B1 (90% ACN, pH = 10; flow rate = 1 ml/min) over 30 min. The eluted peptides were collected at a frequency of one fraction per minute. The dried 30 fractions were resuspended in 0.1% formic acid and pooled into 8 fractions by combining fractions 6–7, 8–9, 10–11, 12–13, 14–16, 17–19, 20–22 and 23–26.
Online LC/MS/MS Analysis
The peptide fractions from both the individual urine samples and the QC samples were analyzed by the same LC-MS/MS configuration. Each fraction was analyzed with a reverse-phase C18 self-packed capillary LC column (75 μm×100 mm). The eluted gradient was 5–30% buffer B2 (0.1% formic acid, 99.9% ACN; flow rate = 0.3 μl/min) over 40 min. A TripleTOF 5600 mass spectrometer (AB Sciex, Framingham, MA) was used to analyze the eluted peptides from LC. The MS data were acquired using high-sensitivity mode with the following parameters: 30 data-dependent MS/MS scans per full scan; full scans acquired at a resolution of 40,000 and MS/MS scans at a resolution of 20,000; rolling collision energy; charge state screening (including precursors with a +2 to +4 charge state); dynamic exclusion (exclusion duration 15 s); MS/MS scan range of 100–1800 m/z; and scan time of 100 ms. A total of 432 LC-MS/MS runs were conducted, including 392 runs for the 49 individual samples and 40 runs for the five technical replicates of the QC sample. To avoid time-dependent systematic bias, the samples from different HPLC fractions were arranged in random order for LC-MS/MS analysis.
2DLC-MS/MS Data Analysis
All MS/MS data were searched against the human section of the SwissProt database (www.uniprot.org, 20121 entries, downloaded on October 2016) using Mascot (Matrix Science, London, UK; version 2.5.01) with the following parameters: fully tryptic digestion and up to two miss cleavage sites; 0.05 Da for both precursor and fragment ion mass tolerance; carbamidomethyl of cysteine as a fixed modification; and methionine oxidation and +43 on Kn (carbamyl) as variable modifications. The database search results obtained with Mascot were further processed by Scaffold (version 4.0.7, Proteome Software Inc., Portland, OR) for protein inference and false discovery rate (FDR) calculation. The probabilities of protein identification were estimated by the ProteinProphet algorithm (33). Only protein groups with at least 2 unique peptides were accepted as positively identified. The false discovery rates (FDR) were set at <1% at both the peptide and protein levels.
The acquired wiff files were imported into the Progenesis LC-MS software (Nonlinear Dynamics, Newcastle, UK, Version 4.0) for label-free quantification analysis. LC alignments were automatically conducted between the runs of the same offline HPLC fractions based on nonlinear mapping of the extracted features. Peptide identifications were then transferred between the aligned features. The abundances of peptide ions based on the robust estimation of the mean log peak area ratio of all peptide ions in the target run were normalized against an automatically selected reference run. Only features of peptide ions with charge states from +2 to +5 were selected for quantification. Protein abundances were calculated by the sum of the normalized abundances of their unique peptides.
MRM Experiments and Data Analysis
Data derived from a spectral library of the normal urine proteome generated by conventional 1D LC-MS/MS and 2D LC-MS/MS using HCD collision were imported into Skyline version 3.5 (33). Skyline was employed to manually select the most intense peptide transitions. Up to five transitions per peptide were traced on a QTRAP 6500 mass spectrometer (AB Sciex, Framingham, MA). Peptides with potential modification sites (cysteine and methionine) and those with missed cleavage sites were excluded. A total of 1–3 peptides from one protein were selected for quantification. All samples were loaded onto a self-packed C18 RP capillary column (100 mm×0.075 mm, 3 μm) with buffer A (0.1% formic acid). The peptides were eluted with 5–30% buffer B (0.1% formic acid, 99.9% ACN; flow rate = 300 nL/min) for 60 min. The samples were analyzed in a random order, and each sample was analyzed three times. All the MRM data were imported into Skyline, which was used for further visualization, transition detection, and abundance calculation. The peptide abundance in a sample was calculated as the mean summed peak area of all selected transitions.
To observe the stability of the MS signal, the mixed peptide sample was used as a QC sample and analyzed 3 times every 2 days during the process of MS analysis.
Estimation of Absolute Protein Concentrations and Reference Intervals
First, a protein MS abundance measurement like iBAQ (34) was calculated for each protein. The abundance was defined as (protein molecular weight) * (summed peptide peak areas)/(number of theoretical peptides that could be detected by mass spectrometry). As reported in an epidemiological study, the mean concentration of urinary albumin among healthy 40–59-year-old Chinese individuals was ∼2.675 mg/L (35). A conversion factor between the protein MS abundance measurement and its absolute concentration was then calculated by dividing 2.675 by the mean albumin abundance among samples within the same age range. Consequently, the concentration of each protein in each sample could be estimated by multiplying its MS abundance measurement by the conversion factor. For each protein, the 2.5% and 97.5% quantiles of concentration values were calculated to estimate the 95% reference interval of protein concentrations in the normal population.
Evaluation of the Effects of Potential Influencing Factors on Urinary Proteome
Hierarchical clustering was employed to evaluate and visualize the overall similarities between samples. This analysis was performed on log2 transformed protein abundance data using the Pearson correlation coefficient for similarity calculation and the Ward agglomeration method. Only proteins with the biological coefficients of variation (CVs) above the median were used for clustering. PERMANOVA (permutational multivariate analysis of variance) was employed to test whether there was a significant effect of each potential influencing factor on the urinary proteome. All tests were performed with the adonis2 function in the vegan package of R using the same distance matrix as in the hierarchical clustering, and the number of permutations was set to 999.
Protein Coexpression Network Analysis
Network analysis was performed to identify co-expressed urinary protein clusters in different individuals. First, the Spearman correlation coefficients between proteins were calculated, and tests of significance were conducted. p values were then corrected for multiple hypothesis testing using the method described by Hochberg (36). A protein co-expression network was constructed based on the correlation analysis. In this network, each vertex denotes a protein; two vertices were linked by an edge if and only if the correlation between the two proteins was significant (adjusted p value < 0.05), and the weight of this edge was determined by the absolute value of the correlation coefficient of the two proteins. Densely connected subnetworks were discovered by the fast greedy community detection algorithm in the iGraph package of R (37, 38). Each subnetwork was required to contain at least 7 vertices and contain more edges than vertices. To identify hub proteins, Kleinberg's hub centrality scores considering edge weights were calculated for all vertices in a subnetwork (39).
Identification of Differentially Expressed Proteins Between Male and Female Urine Samples
To determine the gender-related proteins in urine, a t test with the assumption of unequal variances was performed on the log transformed abundance value for each protein. Adjusted p values for multiple hypothesis tests were then calculated using the Benjamini-Hochberg method (40). Proteins with an adjusted p value less than 0.05 and a fold change over 1.5 were significantly differentially expressed between the two groups.
Discriminate Model
In the training set (Set I), the peak area of each candidate protein was log2 transformed and then standardized (mean = 0 and standard deviation = 1). The LASSO logistic regression model was performed with the glmnet package in R (41). Ten-fold cross-validation was used to determine the lambda value for the LASSO model. The lambda value was the largest value with an error within 1 standard error of lambda that gives the minimum mean cross-validated error. The fitted “urinary gender model” included a panel of proteins that perfectly separated male and female samples. In the test set (Set II), the abundance of each protein was calculated as the weighted sum of peptide peak areas. The weight of a peptide was defined as its median peak area among all samples divided by the sum of median peak areas of the peptides belonging to the same protein. The protein abundances were log2 transformed and standardized in the same way as the training set. The performance of the “urinary gender model” was evaluated by the ROC curve with the pROC package in R (42).
Functional Analysis
The subcellular localization of proteins was annotated by the IPA software (Ingenuity Systems, Mountain View, CA). The significance of enrichment for each subcellular localization term was then calculated by one-sided Fisher's exact test, using all urinary proteins identified in this study as the background. Overrepresentation analysis of protein functions and pathways was performed by IPA and Reactome (43), respectively.
RESULTS
Protein Identification and Label-free Quantification
Urine samples from 49 healthy donors aged 20–69 years in sample Set I were comprehensively analyzed by 2D LC-MS/MS. Donors were assigned to five categories based on age, and each category spanned ten-year interval. Thus, the whole sample set was classified into ten groups based on donor age and gender. A total of 3008 proteins were identified with a protein FDR of <1% and with at least two unique peptides. For each sample, a median of 1162 protein groups was identified by peptide-spectrum-matching, whereas 1884 protein groups could be identified by either peptide-spectrum-matching or the match-between-runs approach (Fig. 2A and supplemental Table S2A).
Fig. 2.
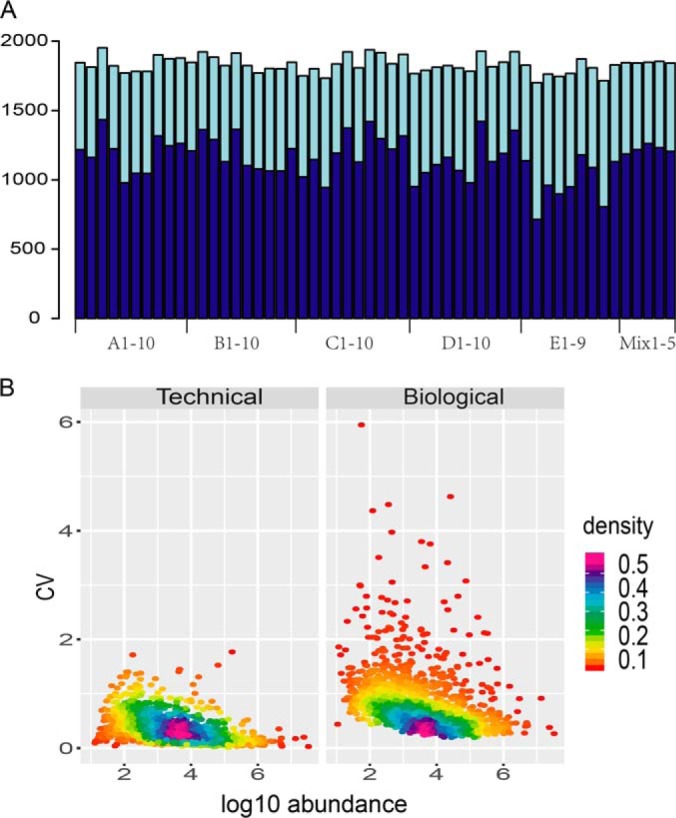
Protein identification and CV distributions. A, Number of protein groups identified in each sample. Darker color: number of proteins identified by MS/MS spectral match; Lighter color: number of proteins identified by match between runs. The first and second letters of each label on the x axis denote the age and gender group of the sample, respectively. B, Technical and biological CVs. The x axis denotes the median log10 protein abundance among the QC runs.
A total of 1872 proteins were quantifiable (supplemental Table S2B). A total of 1738 of these with quantitative data in more than half of the samples were selected for further analysis. Technical variation of this analysis was evaluated by calculating the CV of the protein abundances among the five QC replicates. The median and 75% quantile of technical CVs were 0.23 and 0.39, respectively. Considering that the whole mass spectrometry analysis process included 432 LC-MS/MS runs and lasted for 60 days, the technical reproducibly with the label-free quantification used in this analysis is acceptable.
Individual Variation in the Normal Urinary Proteome
For each protein, the biological variation was evaluated as the CV of the measured protein abundances in the 49 urine samples. The median biological CV was 0.60, remarkably greater than the median technical CV (0.23). The distributions of the technical and biological variations are shown in Fig. 2B. The dynamic range spanned seven orders of magnitude. As more abundant proteins are generally easier to precisely quantify, protein abundance was negatively correlated with the technical CV.
Proteins with CV > 0.77 (the 95% quantile of the technical CV) were considered outliers and removed from the subsequent analysis. A total of 1640 proteins remained in the final dataset for quantitative analysis. Hierarchical clustering analysis was performed to classify 48 out of the 49 samples (a female sample in age group C was not included) into ten small clusters (Fig. 3). Each cluster is dominated by samples from an age and gender group. Only five samples were “mistakenly” classified into four clusters in which the dominant samples were from a different group. This observation suggests that gender and age are the core contributing factors to the individual variability of the normal urinary proteome. The significance of their effects was tested by PERMANOVA (p < 0.001 for both age and gender). The effects of five other physiological factors (TC, TG, blood glucose level, BMI and eGFR) were also examined. Only eGFR showed a significant (p = 0.003) effect based on the PERMANOVA tests. It is important to note that eGFR is well known to decline with the normal aging process (44), and it showed a strong negative correlation with age in our dataset, as expected (Pearson correlation coefficient = -0.78). For the other four physiological factors, no significant correlations were observed with either age or gender, and none of them showed significant effects on the urinary proteomes (p = 0.17, 0.11, 0.78, 0.41 for TC, TG, blood glucose level, and BMI, respectively).
Fig. 3.

Hierarchical clustering of the 49 individual urinary proteomes. Samples were categorized into ten groups based on donor age and gender, as illustrated by the colored bars beside both rows and columns of the heatmap. Based on the clustering tree, the 48 samples were classified into 10 clusters, and 1 was an outlier. The clusters are labeled by their dominant sample groups on the corresponding branches of the dendrogram with the same color code.
Urinary Protein Co-expression Network
Protein co-expression analysis was then performed to identify proteins with similar urinary expression profiles across different individuals. A protein co-expression network containing 332 vertices and 480 edges was built as described in the Experimental Procedures section. In this network, each vertex represents a protein, whereas each edge linking two vertices represents a significant abundance correlation between two proteins. Densely connected subnetworks representing protein clusters with similar expression profiles were detected and characterized in Fig. 4A and 4B.
Fig. 4.

Protein co-expression networks. A, Characteristics of the 9 protein co-expression subnetworks. #Vertices. Number of vertices (i.e. proteins) in the subnetwork; #Edges, the median edge number of all vertices; Correlation, the median absolute Spearman correlation coefficient of all vertex pairs, regardless of whether they are linked by edges; CV, the median biological CV of all proteins in that subnetwork; Hub proteins, proteins with a hub score > 0.9. B, Expression profiles of the protein co-expression subnetworks. For the convenience of visualization, the high dimension abundance matrix in each subnetwork was summarized into a one-dimensional array (an eigengene in co-expression network analysis[45]) by principal component analysis. In detail, the abundance values for each protein were log2 transformed and scaled to a mean of 0 and standard deviation of 1. Then, the eigengene for each subnetwork was calculated as its first principle component, which explained 49.65% to 75.59% of the total protein variance. Thus, the major information of protein abundance distribution in a subnetwork could be represented by the distribution of its eigengene. C, The metabolism subnetwork. Proteins involved in different metabolic pathways are displayed in different colors. All of the proteins were positively correlated with each other.
Subnetwork No.1, the largest one, is composed of 55 proteins (Fig. 4C). It is a relatively stable component of the individual urinary proteomes, with a median biological CV of 0.51. Proteins in this subnetwork did not exhibit different abundance patterns between the two gender groups. According to the REACTOME database, a total of 36 proteins are involved in metabolic pathways. Four metabolic pathways were significantly enriched: metabolism of carbohydrates (12 proteins, FDR adjusted p value = 1.39E-7), metabolism of amino acids and derivatives (11 proteins, FDR adjusted p value = 1.18E-04), biological oxidation (9 proteins, FDR adjusted p value = 1.18E-04) and metabolism of vitamins and cofactors (5 proteins, FDR adjusted p value = 0.05). The tissue expression patterns of the proteins in these pathways were then queried in The Human Protein Atlas (www.proteinatlas.org) (45). Twelve proteins were observed to be highly expressed in the kidney, liver or both. Proteins highly expressed in kidney and liver are particularly enriched in the pathway of amino acid and derivative metabolism, in which 4 proteins are increased in both kidney and liver, whereas another one is increased in kidney and some other tissues. Because kidney and liver play important roles in the metabolism of the body, this subnetwork might act as a urinary indicator of metabolic state. Significant alterations observed in this subnetwork might indicate abnormalities in the metabolic system.
The remaining 8 subnetworks are shown in supplemental Fig. S1. Two gender-related subnetworks exhibit the top two largest individual variations: Subnetwork No. 2 contains 46 proteins that were increased in the female urine samples as well as only one increased in the male urine samples, whereas all the proteins in Subnetwork No. 7 were more abundant in the male urine samples than in the female urine samples. Subnetwork No. 7 represents the prostate secretion states of individuals, as it contains all the three predominate prostate-secreted proteins: prostate-specific antigen (abbreviated as PSA or KLK3), prostatic acid phosphatase (ACPP) and beta-microseminoprotein (MSMB) (47). In-depth analysis of the gender-related urinary proteome differences are provided in the next section.
Gender-related Urinary Proteins
A total of 35 and 76 proteins that were significantly increased in the male and female urine samples, respectively, with changes larger than 1.5-fold and p values <0.05 were identified (supplemental Table S3 and Fig. 5A). This gender-related protein list includes 6 proteins in Subnetwork No. 7 and 39 proteins in Subnetwork No. 2.
Fig. 5.

Gender-related differential protein analysis. A, Volcano plot for protein abundance changes between the male and female urine samples. B, Comparison of the subcellular localization distributions of the proteins that were increased in the different gender groups. C, Functional analysis by IPA. The significance of the enrichment was tested by Fisher's exact test. The x axis represents the -log10 p value of this test. The color of the bar represents the Z-score, which was calculated to predict the effect of protein changes. A positive/negative Z-score indicates that proteins with observed changes in abundance have a potential activating/inhibitory effect on a function. D, Pathway analysis with REACTOME. The significance of the enrichment for each pathway is shown as the -log10 p value adjusted for multiple hypothesis tests. E, Enrichment of related diseases analyzed by IPA.
First, proteins that might originate from the reproductive system were analyzed. Three predominant proteins secreted by the human prostate gland (PSA, ACPP, and MSMB) were observed in all 49 samples. Despite not being uniquely identified in the male urine samples, these proteins were 3 to 7 times more abundant in the male urine samples than in the female urine samples. In addition, several proteins that were observed to be highly expressed in the vagina and cervix were increased in the female urine samples. Among them, fatty acid binding protein 5 (FABP5) and small proline-rich protein 3 (SPRR3) were reported to be characteristic vaginal fluid proteins (48).
Next, differences in the subcellular localization distribution and protein functions between the proteins that were increased in males and females were investigated (Fig. 5B). The proteins that were increased in the male urine samples are enriched with extracellular proteins (odds ratio = 3.20 and p < 0.01), whereas those increased in the female urine samples had a significantly greater proportion of cytoplasmic proteins (odds ratio = 1.82 and p < 0.01) and a lower proportion of plasma membrane proteins (odds ratio = 0.41 and p = 0.02).
The molecular functions of the gender-related proteins were analyzed by IPA (Fig. 5C). An interesting phenomenon is that the proteins that were increased in the different gender groups showed an opposite effect on cell invasion (supplemental Fig. S2). In the group of proteins that were increased in males, 4 of the 5 proteins related to cell invasion were predicted to have an inhibitory effect, whereas in the group of proteins that were increased in females, 10 of the 13 proteins related to this function showed a potential activating effect. The two protein groups also display opposite effects on apoptosis, which was predicted to be inhibited by the proteins that were increased in males and slightly activated by the proteins that were increased in females. Additionally, proteins with several molecular functions, such as the migration of cells, catabolism of protein, and cross-linking of peptides, were significantly enriched only in the group of proteins that were increased in females.
Pathway analysis was further performed by the online analysis tool of the REACTOME database (Fig. 5D). The immune system is the most significantly enriched category, containing nearly half (36/76) of the proteins that were increased in females. The markedly enriched immunological pathways included neutrophil degranulation, which contained 24 and 6 proteins that were increased in females and males, respectively, and antimicrobial peptides, containing 9 proteins enriched in females. The differential proteins in urine might reflect the gender-related immunological differences across the whole body. The second enriched pathway category is keratinization, which contains 15 proteins that were increased in females that are specifically involved in the formation of the cornified envelope. This observation might suggest more shed keratinocytes in women's urine than in men's urine.
Nine proteins with interesting functions were chosen for further validation (Table II). An independent set of urine samples from 85 donors (Set II) was employed for validation by the MRM approach. The result of the validation analysis is shown in Fig. 6A. Detailed information on the monitored transitions and their quantitative information in each sample is listed in supplemental Table S4. The same direction of significant abundance changes (p < 0.05 by two-sided t test on log2 transformed peptide peak areas) was observed as in the Set I analysis for all peptides of the nine proteins quantified in the MRM experiments.
Table II. Nine gender-related proteins that were validated by MRM approach.
| Gene | Increase group | Subcellular localizationa | Tissue specificity | Functions and pathways | Related diseasesa,e |
|---|---|---|---|---|---|
| ANXA1 | Female | Plasma Membrane | Enriched in esophagusd | Activation of cell invasiona; Innate and adaptive immune respondsb,c; chemotaxisa,c; keratinocyte differentiationc | Breast, gastrointestinal cancer; glomerulopathy; inflammatory arthritis |
| S100A9 | Female | Cytoplasm | Highly expressed in squamous epithelial cells of vagina and cervixd | Activation of cell invasiona; neutrophil chemotaxisc; defense response to bacteriumb,c; chemokine and cytokine productionc; apoptoisisa,c | Various inflammatory and autoimmune diseases[49]; various cancers[50]; cardiovascular diseases[51] |
| TXN | Female | Cytoplasm | cell redox homeostasisb; Innate Immune Systemb | Cardiovascular disease; heart failure, stroke, inflammation, metabolic syndrome, neurodegenerative diseases, arthritis, and cancer[52] | |
| AZU1 | Female | Cytoplasm | Enriched in bone marrowd | Induction of positive chemotaxisa,c; Neutrophil degranulationb; antimicrobial humoral responsec | Periodontitis; cornea cancer |
| SPRR3 | Female | Cytoplasm | Characteristic vaginal fluid protein; highly expressed in keratinocytesc | Formation of the cornified envelopeb | Esophageal and skin tumors[53] |
| FABP5 | Female | Cytoplasm | Highly expressed in squamous epithelial cells of vagina and cervixd | Activation of cell invasiona; lipid metabolismc; neutrophil degranulationb; Keratinocyte Differentiationb;[54] | Psoriasis; basal and squamous cell carcinomas[55]; tongue carcinoma[56] |
| PSA | Male | Extracellular Space | Prostate secreted protein | Inhibition of cell invasiona | Prostate cancer and other prostate diseases[57] |
| TIMP1 | Male | Extracellular Space | Metalloproteinase inhibitor; regulation of cell differentiation, migration and cell deathc | Various cancer and renal diseases | |
| AZGP1 | Male | Extracellular Space | Inhibition of cell invasiona; stimulation of lipolysisc | Diabetes; cachexia; obesity[58]; ovarian, bladder and prostate cancers[59] |
a IPA;
b REACTOME;
c UniProtKB;
d The Human Protein Atlas, data available from v18.proteinatlas.org;
e Urinary Protein Biomarker Database, http://upbd.bmicc.cn.
Fig. 6.

Urinary gender model. A, MRM validation results for nine gender-related proteins. B, Distribution of the “gender score” among the training (2D LC-MS/MS) set. C, Performance of the urinary gender model on the test (MRM) set. ROC curves represent the urinary gender model as well as five predictors using individual proteins in this model.
The nine gender-related proteins were then used to develop a “urinary gender model” to distinguish male and female urine samples. The 2D LC-MS/MS results (Set I) were used to train a LASSO logistic regression model. As shown in Fig. 6B, male and female samples were perfectly distinguished by their gender scores. The same model was then applied to predict donors' genders for sample Set II. The ROC curve illustrating the discriminant power is displayed in Fig. 6C. Most of the samples were correctly classified except for three outliers.
Reference Intervals of Urinary Proteins
In addition to gender, many other factors might also influence the urinary proteome. The reference interval for each protein provides a baseline to discover abnormalities in urinary biomarker analysis. Therefore, absolute concentrations of urinary proteins were estimated based on the mean value of urinary albumin concentration in the Chinese population. The 95% reference interval for each protein was calculated (supplemental Table S5).
Table III lists the concentrations of the top 10 most abundant proteins in the normal urinary proteome. None of these proteins had significant differences in abundance in female and male urine. Most of these proteins are extracellular glycoproteins existing in plasma. Among them, uromodulin (UMOD) is the only one that is exclusively secreted by the kidney.
Table III. The top 10 most abundant proteins in urinary proteome. The unit of protein concentration is mg/l. Proteins were ranked based on the median concentration among all of the 49 samples.
| Protein ID | Protein Name | CV | Concen. all | Concen. male | Concen. female |
|---|---|---|---|---|---|
| P02768 | ALB | 0.27 | 2.74 (1.63–4.57) | 2.63 (1.7–4.54) | 2.93 (1.77–4.4) |
| P07911 | UMOD | 0.92 | 1.14 (0.24–5.72) | 1.04 (0.2–4.73) | 1.23 (0.31–4.51) |
| P02760 | AMBP | 0.38 | 1.07 (0.53–1.95) | 1.34 (0.82–1.71) | 0.93 (0.49–2.09) |
| P05090 | APOD | 0.47 | 0.56 (0.11–1.03) | 0.71 (0.28–1) | 0.45 (0.08–1.03) |
| P01834 | IGKC | 0.45 | 0.51 (0.28–1.09) | 0.53 (0.33–1.05) | 0.47 (0.28–1.2) |
| P41222 | PTGDS | 0.41 | 0.49 (0.23–1) | 0.61 (0.33–1.09) | 0.44 (0.19–0.91) |
| P01042 | KNG1 | 0.4 | 0.35 (0.11–0.66) | 0.35 (0.18–0.67) | 0.34 (0.1–0.65) |
| P10451 | SPP1 | 0.67 | 0.3 (0.05–0.84) | 0.32 (0.14–0.77) | 0.28 (0.04–0.95) |
| P13987 | CD59 | 0.28 | 0.23 (0.11–0.34) | 0.23 (0.1–0.35) | 0.21 (0.13–0.34) |
| Q7Z5L0 | VMO1 | 0.46 | 0.22 (0.07–0.42) | 0.26 (0.11–0.48) | 0.18 (0.07–0.36) |
DISCUSSION
The characterization of the normal urine proteome provides fundamental information for the diagnosis and monitoring of diseases. In this study, we found that in addition to age, gender is a crucial factor that contributes to individual variation. The female and male urinary proteomes exhibited distinct expression profiles and could be accurately distinguished by a linear model consisting of merely five proteins. The effect of gender on the urinary proteome has not yet been well studied except for our previous studies using small sample sizes (16, 30).
By looking at gender-related proteins, physiological differences between men and women could be revealed. Typical proteins secreted by the prostate (PSA, ACPP, and MSMB) were enriched in male urine, but did not specifically exist in the male urine. It was reported that Skene's gland, the homolog of the prostate in females, is a source of PSA secretion into female urine (60, 61). These proteins were also found to be secreted or expressed by other tissues, such as lung, kidney, stomach, ovary, and breast, suggesting that their existence in female urine might come from multiple sources (62–65).
The most interesting finding in our study is that many proteins increased in the female urine have functions in the immune system, such as neutrophil degranulation and antimicrobial peptides. Sex differences cause complicated differences in immune response throughout lifetime. These differences occur in both innate and adaptive immune responses, which are thought to be contributed by both the genes located on the X chromosome and the sex hormones (66, 67). For example, females are more susceptible to autoimmune diseases (68), whereas infectious diseases are more prevalent in males. Our study indicates that certain gender differences in the immune system could be reflected in the urinary proteome. A proteomic study on normal saliva also observed elevated abundances of immune-related proteins in females (69). These findings together suggest that the systematic status of the human body might be reflected by various biofluids.
The overrepresented disease terms that are associated with the gender-related proteins identified by IPA are highly enriched in a diverse dermatological, immunological and inflammatory-related diseases and disorders, including dermatitis, hypersensitive reaction, psoriasis, and lupus erythematosus (Fig. 5E). Some of these diseases are known to be more prevalent in females than in males (70–73). In addition, many clues suggest that the levels of these gender-related proteins change in the urine under various other disease conditions. Detailed data can be found in the Urinary Protein Biomarker Database (6).
Individual variation is thought to be an important factor for the inability to validate the biomarker candidates discovered in pilot proteomic studies (17). The bias of factors causing individual variation in case-control studies may lead to an inaccurate list of differentially expressed proteins. Considering the wide range of diseases associated with gender-related proteins, we strongly suggest that future biomarker studies should consider gender as a crucial factor in both experimental design and data analysis. Gender-stratified analysis is preferable when the proper sample size is available; otherwise, the number of female and male subjects must be balanced between groups.
Aging is another important factor that influences the urinary proteome, because aging kidneys show a progressive decline of renal function, such as loss of GFR and decline of the capacity to concentrate urine (74). In a previous study, Bakun et al. reported altered extracellular matrix turnover and declining immune function from the changes in proteins in an elderly group (aged from 70 to 90 years) compared with the young and middle-age groups (23). The correlation with age and the urinary proteome was also observed in our datasets from relatively younger donors (aged 20 to 69 years). Trends of aging-related differences were also observed in Subnetworks No. 1 and 5 in both gender groups. To accurately measure the age-related differences, our further investigations will include donors with an extended age range and use a larger sample size.
In our data set, plasma glucose levels, TC, TG and BMI showed insignificant effects on the normal urinary proteome. Other known (e.g. diet and exercise) and unknown factors may also cause changes in urinary proteins. The results of the protein co-expression network analysis might offer clues for further studies. For example, Subnetwork No. 9, the third most variable subnetwork, includes a hub vertex UMOD. All of the other six proteins showed a strong correlation with this hub protein. UMOD is a tubular specifically secreted protein and a famous marker of renal function (75). However, none of the other proteins have been observed to be highly expressed in the kidney. The functional associations of proteins in this subnetwork remain to be discovered.
Finally, we estimated reference intervals for 1640 urinary proteins quantified in Set I among normal males and females providing a baseline for detecting abnormalities in urine. We previously used the same approach to determine the absolute concentration of 2571 urinary proteins in a pooled sample and showed a medium correlation with immunoassay results (3). It is an interesting phenomenon that UMOD exhibited much broader intervals than the high abundant proteins that originated from the plasma. This suggests that the levels of renal secretion are variable among healthy donors in our study. We hope that the omic-scale reference interval would be helpful for urinary proteome clinical applications and related research.
DATA AVAILABILITY
All raw MS data are stored at the iProx (www.iprox.org) data repository (Project ID: IPX0001256000).
Supplementary Material
Footnotes
* This work was supported by National Key R&D Program of China (2017YFC0908404), National Basic Research Program of China (No. 2014CBA02005, 2013CB530805), National Key Research and Development Program of China (No. 2016 YFC 1306300), Key Basic Research Program of the Ministry of Science and Technology of China (No. 2013FY114100), National Natural Science Foundation of China (No. 30970650, 31200614, 31400669, 81371515, 81170665, 81560121), Beijing Natural Science Foundation (No. 7173264, 7172076), Beijing cooperative construction project (No. 110651103), Beijing Normal University (No. 11100704), Peking Union Medical College Hospital (No. 2016-2.27), CAMS Innovation Fund for Medical Sciences (2017-I2M-1-009) and Biologic Medicine Information Center of China, National Scientific Data Sharing Platform for Population and Health.
 This article contains supplemental material. The authors declare that they have no competing interests.
1 The abbreviations used are:
- BMI
- body mass index
- 2DLC-MS/MS
- two dimensional liquid chromatography - tandem mass spectrometry
- ACPP
- prostatic acid phosphatase
- ANXA1
- annexin A1
- APOD
- apolipoprotein D
- AUC
- area under curve
- AZGP1
- zinc-alpha-2-glycoprotein
- AZU1
- AZU1 protein
- CI
- confidence interval
- CV
- coefficient of variation
- eGFR
- estimated glomerular filtration rate
- FABP5
- fatty acid binding protein 5
- FASP
- filter-aided sample preparation
- IGKC
- Ig kappa chain C region
- KNG1
- kininogen-1
- LC -MS/MS
- liquid chromatography - tandem mass spectrometry
- MRM
- multiple reaction monitoring
- MSMB
- beta-microseminoprotein
- PERMANOVA
- permutational multivariate analysis of variance
- PSA
- prostate specific antigen
- PTGDS
- prostaglandin-H2 D-isomerase
- QC
- quality control
- RI
- reference interval
- ROC
- receiver operation curve
- S100A9
- protein S100-A9
- SPP1
- osteopontin
- SPRR3
- small proline-rich protein 3
- TC
- total cholesterol
- TG
- triglyceride
- TIMP1
- tissue inhibitor of metalloproteinase-1
- TXN
- thioredoxin
- UMOD
- uromodulin
- VMO1
- vitelline membrane outer layer protein 1 homolog.
REFERENCES
- 1. Gao Y. (2013) Urine-an untapped goldmine for biomarker discovery? Sci. China Life Sci. 56, 1145–1146 [DOI] [PubMed] [Google Scholar]
- 2. Gao Y. (2015) Urine is a better biomarker source than blood especially for kidney diseases. Adv. Exp. Med. Biol. 845, 3–12 [DOI] [PubMed] [Google Scholar]
- 3. Zhao M., Li M., Yang Y., Guo Z., Sun Y., Shao C., Li M., Sun W., and Gao Y. (2017) A comprehensive analysis and annotation of human normal urinary proteome. Sci. Rep. 7, 3024. [DOI] [PMC free article] [PubMed] [Google Scholar]
- 4. Decramer S., Gonzalez de Peredo A., Breuil B., Mischak H., Monsarrat B., Bascands J. L., and Schanstra J. P. (2008) Urine in clinical proteomics. Mol. Cell. Proteomics 7, 1850–1862 [DOI] [PubMed] [Google Scholar]
- 5. Nolen B. M., Orlichenko L. S., Marrangoni A., Velikokhatnaya L., Prosser D., Grizzle W. E., Ho K., Jenkins F. J., Bovbjerg D. H., and Lokshin A. E. (2013) An extensive targeted proteomic analysis of disease-related protein biomarkers in urine from healthy donors. PLoS ONE 8, e63368. [DOI] [PMC free article] [PubMed] [Google Scholar]
- 6. Shao C., Li M., Li X., Wei L., Zhu L., Yang F., Jia L., Mu Y., Wang J., Guo Z., Zhang D., Yin J., Wang Z., Sun W., Zhang Z., and Gao Y. (2011) A tool for biomarker discovery in the urinary proteome: a manually curated human and animal urine protein biomarker database. Mol. Cell. Proteomics 10, M111 010975 [DOI] [PMC free article] [PubMed] [Google Scholar]
- 7. Thomas C. E., Sexton W., Benson K., Sutphen R., and Koomen J. (2010) Urine collection and processing for protein biomarker discovery and quantification. Cancer Epidemiol. Biomarkers Prev. 19, 953–959 [DOI] [PMC free article] [PubMed] [Google Scholar]
- 8. Flint R. S., Phillips A. R., Farrant G. J., McKay D., Buchanan C. M., Cooper G. S., and Windsor J. A. (2007) Probing the urinary proteome of severe acute pancreatitis. HPB 9, 447–455 [DOI] [PMC free article] [PubMed] [Google Scholar]
- 9. Lipinski M., Rydzewska-Rosolowska A., Rydzewski A., and Rydzewska G. (2015) Urinary neutrophil gelatinase-associated lipocalin as an early predictor of disease severity and mortality in acute pancreatitis. Pancreas 44, 448–452 [DOI] [PubMed] [Google Scholar]
- 10. Matafora V., Zagato L., Ferrandi M., Molinari I., Zerbini G., Casamassima N., Lanzani C., Delli Carpini S., Trepiccione F., Manunta P., Bachi A., and Capasso G. (2014) Quantitative proteomics reveals novel therapeutic and diagnostic markers in hypertension. BBA Clin. 2, 79–87 [DOI] [PMC free article] [PubMed] [Google Scholar]
- 11. Chugh S., Ouzounian M., Lu Z., Mohamed S., Li W., Bousette N., Liu P. P., and Gramolini A. O. (2013) Pilot study identifying myosin heavy chain 7, desmin, insulin-like growth factor 7, and annexin A2 as circulating biomarkers of human heart failure. Proteomics 13, 2324–2334 [DOI] [PMC free article] [PubMed] [Google Scholar]
- 12. An M., and Gao Y. (2015) Urinary biomarkers of brain diseases. Genomics Proteomics Bioinformatics 13, 345–354 [DOI] [PMC free article] [PubMed] [Google Scholar]
- 13. Gajbhiye A., Dabhi R., Taunk K., Vannuruswamy G., RoyChoudhury S., Adhav R., Seal S., Mane A., Bayatigeri S., Santra M. K, Chaudhury K., and Rapole S. (2016) Urinary proteome alterations in HER2 enriched breast cancer revealed by multipronged quantitative proteomics. Proteomics 16, 2403–2418 [DOI] [PubMed] [Google Scholar]
- 14. Beretov J., Wasinger V. C., Graham P. H., Millar E. K., Kearsley J. H., and Li Y. (2014) Proteomics for breast cancer urine biomarkers. Adv. Clin. Chem. 63, 123–167 [DOI] [PubMed] [Google Scholar]
- 15. Beretov J., Wasinger V. C., Millar E. K., Schwartz P., Graham P. H., and Li Y. (2015) Proteomic analysis of urine to identify breast cancer biomarker candidates using a label-free LC-MS/MS approach. PLoS ONE, 10, e0141876. [DOI] [PMC free article] [PubMed] [Google Scholar]
- 16. Guo Z., Zhang Y., Zou L., Wang D., Shao C., Wang Y., Sun W., and Zhang L. (2015) A proteomic analysis of individual and gender variations in normal human urine and cerebrospinal fluid using iTRAQ quantification. PLoS ONE 10, e0133270. [DOI] [PMC free article] [PubMed] [Google Scholar]
- 17. Chen Y. (2015) Variations of human urinary proteome. Adv. Exp. Med. Biol. 845, 91–94 [DOI] [PubMed] [Google Scholar]
- 18. Castagna A., Channavajjhala S. K., Pizzolo F., and Olivieri O. (2015) Hormone-dependent changes in female urinary proteome. Adv. Exp. Med. Biol. 845, 103–120 [DOI] [PubMed] [Google Scholar]
- 19. Castagna A., Olivieri O., Milli A., Dal Bosco M., Timperio A.M., Zolla L., Gunasekaran M., Raffaelli R., Pizzolo F., and Cecconi D. (2011) Female urinary proteomics: New insight into exogenous and physiological hormone-dependent changes. Proteomics Clin. Appl. 5, 343–353 [DOI] [PubMed] [Google Scholar]
- 20. Khristenko N. A., Larina I. M., and Domon B. (2016) Longitudinal urinary protein variability in participants of the space flight simulation program. J. Proteome Res. 15, 114–124 [DOI] [PubMed] [Google Scholar]
- 21. Kohler M., Schanzer W., and Thevis M. (2015) Effects of exercise on the urinary proteome. Adv. Exp. Med. Biol. 845, 121–131 [DOI] [PubMed] [Google Scholar]
- 22. Li M., Zhao M., and Gao Y., (2015) Effect of transient blood glucose increases after oral glucose intake on the human urinary proteome. Proteomics Clin. Appl. 9, 618–622 [DOI] [PubMed] [Google Scholar]
- 23. Bakun M., Senatorski G., Rubel T., Lukasik A., Zielenkiewicz P., Dadlez M., and Paczek L. (2014) Urine proteomes of healthy aging humans reveal extracellular matrix (ECM) alterations and immune system dysfunction. Age 36, 299–311 [DOI] [PMC free article] [PubMed] [Google Scholar]
- 24. Froehlich J. W., Vaezzadeh A. R., Kirchner M., Briscoe A. C., Hofmann O., Hide W., Steen H., and Lee R. S. (2014) An in-depth comparison of the male pediatric and adult urinary proteomes. Biochim. Biophys. Acta 1844, 1044–1050 [DOI] [PMC free article] [PubMed] [Google Scholar]
- 25. Khan A., and Packer N. H. (2006) Simple urinary sample preparation for proteomic analysis. J. Proteome Res. 5, 2824–2838 [DOI] [PubMed] [Google Scholar]
- 26. Sun W., Chen Y., Li F., Zhang L., Yang R., Zhang Z., Zheng D., and Gao Y. (2009) Dynamic urinary proteomic analysis reveals stable proteins to be potential biomarkers. Proteomics Clin. Appl. 3, 370–382 [DOI] [PubMed] [Google Scholar]
- 27. Nagaraj N., and Mann M. (2011) Quantitative analysis of the intra- and inter-individual variability of the normal urinary proteome. J. Proteome Res. 10, 637–645 [DOI] [PubMed] [Google Scholar]
- 28. Thongboonkerd V., Chutipongtanate S., and Kanlaya R. (2006) Systematic evaluation of sample preparation methods for gel-based human urinary proteomics: quantity, quality, and variability. J. Proteome Res. 5, 183–191 [DOI] [PubMed] [Google Scholar]
- 29. Oh J., Pyo J. H., Jo E. H., Hwang S. I., Kang S. C., Jung J. H., Park E. K., Kim S. Y., Choi J. Y., and Lim J. (2004) Establishment of a near-standard two-dimensional human urine proteomic map. Proteomics 4, 3485–3497 [DOI] [PubMed] [Google Scholar]
- 30. Liu X., Shao C., Wei L., Duan J., Wu S., Li X., Li M., and Sun W. (2012) An individual urinary proteome analysis in normal human beings to define the minimal sample number to represent the normal urinary proteome. Proteome Sci. 10, 70. [DOI] [PMC free article] [PubMed] [Google Scholar]
- 31. Leng W., Ni X., Sun C., Lu T., Malovannaya A., Jung S. Y., Huang Y., Qiu Y., Sun G., Holt M. V., Ding C., Sun W., Men X., Shi T., Zhu W., Wang Y., He F., Zhen B., Wang G., and Qin J. (2017) Proof-of-concept workflow for establishing reference intervals of human urine proteome for monitoring physiological and pathological changes. EBioMedicine 18, 300–310 [DOI] [PMC free article] [PubMed] [Google Scholar]
- 32. Wisniewski J. R., Zougman A., Nagaraj N., and Mann M. (2009) Universal sample preparation method for proteome analysis. Nat. Methods, 6, 359–362 [DOI] [PubMed] [Google Scholar]
- 33. MacLean B., Tomazela D. M., Shulman N., Chambers M., Finney G. L., Frewen B., Kern R., Tabb D. L., Liebler D. C., and MacCoss M. J. (2010) Skyline: an open source document editor for creating and analyzing targeted proteomics experiments. Bioinformatics 26, 966–968 [DOI] [PMC free article] [PubMed] [Google Scholar]
- 34. Schwanhausser B., Busse D., Li N., Dittmar G., Schuchhardt J., Wolf J., Chen W., and Selbach M. (2011) Global quantification of mammalian gene expression control. Nature 473, 337–342 [DOI] [PubMed] [Google Scholar]
- 35. Dyer A. R., Greenland P., Elliott P., Daviglus M.L., Claeys G., Kesteloot H., Ueshima H., Stamler J., and INTERMAP Research Group (2004) Evaluation of measures of urinary albumin excretion in epidemiologic studies. Am. J. Epidemiol. 160, 1122–1131 [DOI] [PMC free article] [PubMed] [Google Scholar]
- 36. Hochberg Y. (1988) A Sharper Bonferroni Procedure for Multiple Tests Of Significance. Biometrika 75, 800–802 [Google Scholar]
- 37. Csardi G., and Nepusz T., (2006) The igraph software package for complex network research. InterJournal. Complex Systems: p. 1695 [Google Scholar]
- 38. Clauset A., Newman M. E. J., and Moore C. (2004) Finding community structure in very large networks. Phys Rev E Stat Nonlin Soft Matter Phys. 70, 066111 [DOI] [PubMed] [Google Scholar]
- 39. Kleinberg J. (1999) Authoritative sources in a hyperlinked environment. JACM 46, 604–632 [Google Scholar]
- 40. Benjamini Y., and Hochberg Y. (1995) Controlling the false discovery rate - a practical and powerful approach to multiple testing. J. Roy. Statistical Soc. 57, 289–300 [Google Scholar]
- 41. Friedman J., Hastie T., and Tibshirani R. (2010) Regularization paths for generalized linear models via coordinate descent. J. Stat. Softw. 33, 1–22 [PMC free article] [PubMed] [Google Scholar]
- 42. Robin X., Turck N., Hainard A., Tiberti N., Lisacek F., Sanchez J. C., and Müller M. (2011) pROC: an open-source package for R and S plus to analyze and compare ROC curves. Bmc Bioinformatics 12, 77. [DOI] [PMC free article] [PubMed] [Google Scholar]
- 43. Fabregat A., Jupe S., Matthews L., Sidiropoulos K., Gillespie M., Garapati P., Haw R., Jassal B., Korninger F., May B., Milacic M., Roca C.D., Rothfels K., Sevilla C., Shamovsky V., Shorser S., Varusai T., Viteri G., Weiser J., Wu G., Stein L., Hermjakob H., and D'Eustachio P. (2016) The Reactome pathway Knowledgebase. Nucleic Acids Res. 44, D481–D487 [DOI] [PMC free article] [PubMed] [Google Scholar]
- 44. Glassock R. J., and Winearls C. (2009) Ageing and the glomerular filtration rate: truths and consequences. Trans. Am. Clin. Climatol. Assoc. 120, 419–428 [PMC free article] [PubMed] [Google Scholar]
- 45. Uhlen M., Fagerberg L., Hallström B. M., Lindskog C., Oksvold P., Mardinoglu A., Sivertsson Å., Kampf C., Sjöstedt E., Asplund A., Olsson I., Edlund K., Lundberg E., Navani S., Szigyarto C. A., Odeberg J., Djureinovic D., Takanen J. O., Hober S., Alm T., Edqvist P. H., Berling H., Tegel H., Mulder J., Rockberg J., Nilsson P., Schwenk J. M., Hamsten M., von Feilitzen K., Forsberg M., Persson L., Johansson F., Zwahlen M., von Heijne G., Nielsen J., and Pontén F. (2015) Proteomics Tissue-based map of the human proteome. Science 347, 1260419. [DOI] [PubMed] [Google Scholar]
- 46. Zhang B., and Horvath S. (2005) A general framework for weighted gene co-expression network analysis. Stat. Appl. Genet. Mol. Biol. 4, Article17 [DOI] [PubMed] [Google Scholar]
- 47. Lilja H., and Abrahamsson P. A. (1988) Three predominant proteins secreted by the human prostate gland. Prostate 12, 29–38 [DOI] [PubMed] [Google Scholar]
- 48. Igoh A., Doi Y., and Sakurada K. (2015) Identification and evaluation of potential forensic marker proteins in vaginal fluid by liquid chromatography/mass spectrometry. Anal. Bioanal. Chem. 407, 7135–7144 [DOI] [PubMed] [Google Scholar]
- 49. Nacken W., Roth J., Sorg C., and Kerkhoff C. (2003) S100A9/S100A8: Myeloid representatives of the S100 protein family as prominent players in innate immunity. Microsc. Res. Tech. 60, 569–580 [DOI] [PubMed] [Google Scholar]
- 50. Gebhardt C., Németh J., Angel P., and Hess J. (2006) S100A8 and S100A9 in inflammation and cancer. Biochem. Pharmacol. 72, 1622–1631 [DOI] [PubMed] [Google Scholar]
- 51. Averill M. M., Kerkhoff C., and Bornfeldt K. E. (2012) S100A8 and S100A9 in cardiovascular biology and disease. Arterioscler. Thromb. Vasc. Biol. 32, 223–229 [DOI] [PMC free article] [PubMed] [Google Scholar]
- 52. Mahmood D. F., Abderrazak A., El Hadri K., Simmet T., and Rouis M. (2013) The thioredoxin system as a therapeutic target in human health and disease. Antioxid Redox Signal 19, 1266–1303 [DOI] [PubMed] [Google Scholar]
- 53. Carregaro F., Stefanini A. C., Henrique T., and Tajara E. H. (2013) Study of small proline-rich proteins (SPRRs) in health and disease: a review of the literature. Arch. Dermatol. Res. 305, 857–866 [DOI] [PubMed] [Google Scholar]
- 54. Ogawa E., Owada Y., Ikawa S., Adachi Y., Egawa T., Nemoto K., Suzuki K., Hishinuma T., Kawashima H., Kondo H., Muto M., Aiba S., and Okuyama R. (2011) Epidermal FABP (FABP5) regulates keratinocyte differentiation by 13(S)-HODE-mediated activation of the NF-kappaB signaling pathway. J. Invest. Dermatol. 131, 604–612 [DOI] [PubMed] [Google Scholar]
- 55. Masouye I., Saurat J. H., and Siegenthaler G. (1996) Epidermal fatty-acid-binding protein in psoriasis, basal and squamous cell carcinomas: an immunohistological study. Dermatology 192, 208–213 [DOI] [PubMed] [Google Scholar]
- 56. Ohyama Y., Kawamoto Y., Chiba T., Kikuchi K., Sakashita H., and Imai K. (2014) Differential expression of fatty acid-binding proteins and pathological implications in the progression of tongue carcinoma. Mol. Clin. Oncol. 2, 19–25 [DOI] [PMC free article] [PubMed] [Google Scholar]
- 57. Catalona W. J., Smith D. S., Ratliff T. L., Dodds K. M., Coplen D. E., Yuan J. J., Petros J. A., and Andriole G. L. (1991) Measurement of prostate-specific antigen in serum as a screening test for prostate cancer. N. Engl. J. Med. 324, 1156–1161 [DOI] [PubMed] [Google Scholar]
- 58. Tisdale M. J. (2009) Zinc-alpha2-glycoprotein in cachexia and obesity. Curr. Opin. Support Palliat. Care 3, 288–293 [DOI] [PubMed] [Google Scholar]
- 59. Hassan M. I., Waheed A., Yadav S., Singh T. P., and Ahmad F. (2008) Zinc alpha 2-glycoprotein: a multidisciplinary protein. Mol. Cancer Res. 6, 892–906 [DOI] [PubMed] [Google Scholar]
- 60. Zaviacic M., and Ablin R. J. (2000) The female prostate and prostate-specific antigen. Immunohistochemical localization, implications of this prostate marker in women and reasons for using the term “prostate” in the human female. Histol. Histopathol. 15, 131–142 [DOI] [PubMed] [Google Scholar]
- 61. Schmidt S., Franke M., Lehmann J., Loch T., Stöckle M., and Weichert-Jacobsen K. (2001) Prostate-specific antigen in female urine: a prospective study involving 217 women. Urology 57, 717–720 [DOI] [PubMed] [Google Scholar]
- 62. Grubisha D. S., Lipert R. J., Park H. Y., Driskell J., and Porter M. D. (2003) Femtomolar detection of prostate-specific antigen: an immunoassay based on surface-enhanced Raman scattering and immunogold labels. Anal. Chem. 75, 5936–5943 [DOI] [PubMed] [Google Scholar]
- 63. Quintero I. B., Araujo C. L., Pulkka A. E., Wirkkala R. S., Herrala A. M., Eskelinen E. L., Jokitalo E., Hellström P. A., Tuominen H. J., Hirvikoski P. P., and Vihko P. T. (2007) Prostatic acid phosphatase is not a prostate specific target. Cancer Res. 67, 6549–6554 [DOI] [PubMed] [Google Scholar]
- 64. Graddis T. J., McMahan C. J., Tamman J., Page K. J., and Trager J. B. (2011) Prostatic acid phosphatase expression in human tissues. Int. J. Clin. Exp. Pathol. 4, 295–306 [PMC free article] [PubMed] [Google Scholar]
- 65. Ohkubo I., Tada T., Ochiai Y., Ueyama H., Eimoto T., and Sasaki M. (1995) Human seminal plasma beta-microseminoprotein: its purification, characterization, and immunohistochemical localization. Int. J. Biochem. Cell Biol. 27, 603–611 [DOI] [PubMed] [Google Scholar]
- 66. Ghazeeri G., Abdullah L., and Abbas O. (2011) Immunological differences in women compared with men: overview and contributing factors. Am. J. Reprod. Immunol. 66, 163–169 [DOI] [PubMed] [Google Scholar]
- 67. Klein S. L., and Flanagan K. L. (2016) Sex differences in immune responses. Nat. Rev. Immunol. 16, 626–638 [DOI] [PubMed] [Google Scholar]
- 68. Whitacre C. C. (2001) Sex differences in autoimmune disease. Nat. Immunol. 2, 777–780 [DOI] [PubMed] [Google Scholar]
- 69. Xiao X., Liu Y., Guo Z., Liu X., Sun H., Li Q., and Sun W. (2017) Comparative proteomic analysis of the influence of gender and acid stimulation on normal human saliva using LC/MS/MS. Proteomics Clin. Appl. 11, 7–8 [DOI] [PubMed] [Google Scholar]
- 70. Chen W., Mempel M., Schober W., Behrendt H., and Ring J. (2008) Gender difference, sex hormones, and immediate type hypersensitivity reactions. Allergy, 63, 1418–1427 [DOI] [PubMed] [Google Scholar]
- 71. Rönmark E. P., Ekerljung L., Lötvall J., Wennergren G., Rönmark E., Torén K., and Lundbäck B. (2012) Eczema among adults: prevalence, risk factors and relation to airway diseases. Results from a large-scale population survey in Sweden. Br J Dermatol. 166, 1301–1308 [DOI] [PubMed] [Google Scholar]
- 72. Statescu L., Branisteanu D., Dobre C., Solovastru L. G., Vasilca A., Petrescu Z., and Azoicai D. (2011) Contact dermatitis - epidemiological study. Maedica 6, 277–281 [PMC free article] [PubMed] [Google Scholar]
- 73. Yacoub Wasef S. Z. (2004) Gender differences in systemic lupus erythematosus. Gend. Med. 1, 12–17 [DOI] [PubMed] [Google Scholar]
- 74. Bolignano D., Mattace-Raso F., Sijbrands E. J., and Zoccali C. (2014) The aging kidney revisited: a systematic review. Ageing Res. Rev. 14, 65–80 [DOI] [PubMed] [Google Scholar]
- 75. Pruijm M., Ponte B., Ackermann D., Paccaud F., Guessous I., Ehret G., Pechère-Bertschi A., Vogt B., Mohaupt M. G., Martin P. Y., Youhanna S. C., Nägele N., Vollenweider P., Waeber G., Burnier M, Devuyst O., and Bochud M. (2016) Associations of urinary uromodulin with clinical characteristics and markers of tubular function in the general population. Clin. J. Am. Soc. Nephrol. 11, 70–80 [DOI] [PMC free article] [PubMed] [Google Scholar]
Associated Data
This section collects any data citations, data availability statements, or supplementary materials included in this article.
Supplementary Materials
Data Availability Statement
All raw MS data are stored at the iProx (www.iprox.org) data repository (Project ID: IPX0001256000).