Figure 8.

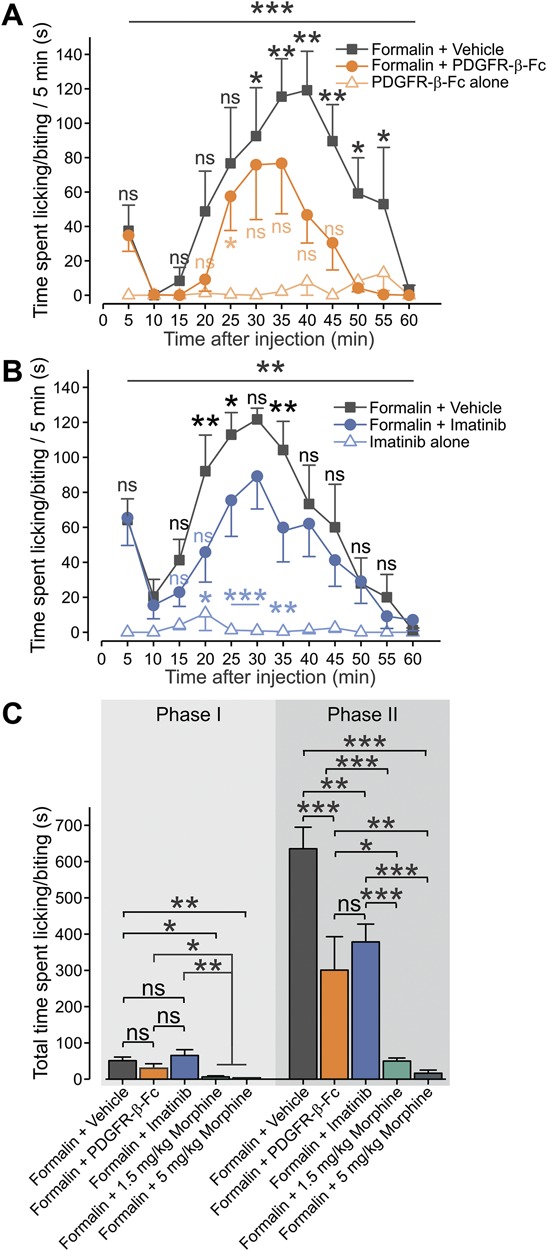
Platelet-derived growth factor scavenging and inhibition of PDGFR reduces formalin-induced inflammatory pain. (A) Mean ± SEM of duration of paw licking and biting per 5 minutes plotted vs time after injection of 2% formalin with vehicle (PBS, gray squares); 2% formalin with 500 ng/40 μL of PDGFR-β-Fc (orange circles) and 500 ng/40 μL of PDGFR-β-Fc alone (light orange triangles). RM two-way ANOVA with post hoc Bonferroni, n = 6 rats per group; black bar and asterisks—comparison between the “Formalin + vehicle” and the “Formalin + PDGFR-β-Fc” groups; light orange bar and asterisks—comparison between the “PDGFR-β-Fc alone” and the “Formalin + PDGFR-β-Fc” groups. (B) Mean ± SEM of duration of paw licking and biting per 5 minutes plotted vs time after injection (at time “0”) of 2% formalin (dark gray); 2% formalin together with 60 ng/g of imatinib (blue) and 60 ng/g of imatinib alone (light blue). RM 2-way ANOVA with post hoc Bonferroni; n = 6 rats per group, ns, not significant; *P < 0.05; **P < 0.01, ***P < 0.001 black bar and asterisks—comparison between the “Formalin + vehicle” and the “Formalin + imatinib” groups; light blue bar and asterisks—comparison between the “Imatinib alone” and the “Formalin + imatinib” groups. (C) Summary of mean ± SEM of total duration of time spent in licking and biting in phase I (0-10 minutes) and phase II (10-60 minutes) after injection of 2% formalin with vehicle (dark gray); 2% formalin together with 500 ng/40 μL of PDGFR-β-Fc (orange); 2% formalin together with 60 ng/g of imatinib (blue); 2% formalin together with 1.5 mg/kg (green) and 5 mg/kg of morphine (dark green) Student t-test; ns, not significant; *P < 0.05, **P < 0.01; ***P < 0.001; n = 6 animals in all groups apart from the “Formalin + vehicle” group containing n = 12 animals. ANOVA, analysis of variance; PDGF, platelet-derived growth factor; RM, repeated-measures.
