Abstract
Single-photon emission computed tomography/computed tomography (SPECT/CT) is an already established nuclear imaging modality. Co-registration of functional information (SPECT) with anatomical images (CT) paved the way to the wider application of SPECT. Recent advancements in quantitative SPECT/CT have made it possible to incorporate quantitative parameters, such as standardized uptake value (SUV) or %injected dose (%ID), in gamma camera imaging. This is indeed a paradigm shift in gamma camera imaging from qualitative to quantitative evaluation. In fact, such quantitative approaches of nuclear imaging have only been accomplished for positron emission tomography (PET) technology. Attenuation correction, scatter correction, and resolution recovery are the three main features that enabled quantitative SPECT/CT. Further technical improvements are being achieved for partial-volume correction, motion correction, and dead-time correction. The reported clinical applications for quantitative SPECT/CT are mainly related to Tc-99m-labeled radiopharmaceuticals: Tc-99m diphosphonate for bone/joint diseases, Tc-99m pertechnetate for thyroid function, and Tc-99m diethylenetriaminepentaacetic acid for measurement of glomerular filtration rate. Dosimetry before trans-arterial radio-embolization is also a promising application for Tc-99m macro-aggregated albumin. In this review, clinical applications of Tc-99m quantitative SPECT/CT will be discussed.
Keywords: Quantitation, Single-photon emission computed tomography, Computed tomography, Gamma camera, Tc-99m
Introduction
Nuclear medicine of gamma camera consists of two-dimensional planar imaging and three-dimensional single-photon emission computed tomography (SPECT). Planar imaging still comprises the major portion of current nuclear medicine practice: bone scintigraphy using Tc-99m diphosphonate is one of the most popular nuclear medicine practices. SPECT has been mainly used for perfusion studies of the myocardium or brain, or for organ-specific tomography studies (bone SPECT, kidney SPECT). Since the integration of SPECT with CT was introduced over two decades ago [1], SPECT/CT has been widely used in a variety of gamma camera imaging practices [2, 3].
When it comes to quantitation, it is only recently that SPECT/CT has been considered as a truly quantitative imaging modality. Quantitative nuclear imaging requires the voxel values in terms of radioactivity/volume (i.e., kBq/mL). PET was an inherently quantitative imaging modality, even before CT integration, mainly because of its unique co-incident dual-photon detection mechanism. The standardized uptake value (SUV) has been widely used as a useful quantitative parameter of disease activity while interpreting PET images [4, 5]. Recent advancements in quantitative SPECT/CT technology are highly dependent on an iterative SPECT reconstruction method, such as ordered-subset expectation maximization (OSEM), which incorporates radioactivity correction algorithms such as attenuation correction (AC), scatter correction (SC), and resolution recovery (RR) during image generation.
In this review, clinical applications of SPECT/CT using Tc-99m-labeled radiopharmaceuticals will be discussed. Technical advancements in quantitative SPECT/CT will also be covered, but for the readers who are more interested in technical aspects, recent review papers are recommended [6, 7].
Technical Advancements in Tc-99m Quantitative SPECT/CT
Attenuation Correction
Attenuation is a count-distorting phenomenon such as scattering, and attenuation effects often mimic the scatter-induced count loss. Good attenuation maps can also be used for better estimation of scattering. Therefore, correction of attenuation and scattering are highly related to each other, although both are distinctive interactions between photon and matter [8, 9]. AC is theoretically more complex for SPECT than for PET. Due to the dual-photon coincidence detection mechanism of PET, the degree of photon attenuation does not depend on the location of positron annihilation, but only on the line of response, enabling exact AC of PET. In contrast, the degree of photon attenuation in SPECT is severely affected by the location (practically, the distance between the photon emission source and the detector) and subsequently by the line integral of linear attenuation coefficients along the path of the photon [8]. In CT-based AC, linear attenuation coefficients are derived from the Hounsfield unit of CT: look-up tables that transform the CT values of Hounsfield unit into linear attenuation coefficients at the respective photon energy (i.e., 140 keV for Tc-99m) are installed in modern SPECT/CT scanners. Here, it is encouraging that although individual linear attenuation coefficients are affected by CT conditions, the line integral of those linear attenuation coefficients is less severely influenced. Therefore, variability in acquisition parameters of CT (e.g., tube current, tube voltage) may be allowed, to some extent, without serious effects on AC. Actually, AC by CT attenuation map is now widely employed in SPECT/CT scanners. CT dose reducing methods such as current modulation (AutoMA, GE; CareDose, Siemens) and/or iterative CT reconstruction (ASiR, GE) are generally welcome.
Scatter Correction
Compton scattering is the main form of scattering in nuclear medicine practice. Scattered photons would lose part of their original energy and trajectory. In the view point of collimated detectors with limited energy resolution, these deflected photons would affect quantitative efficacy and image quality. If original photons that are supposed to hit the detector are missed out of their trajectory due to Compton scattering, the apparent result is a count loss, which is hard to distinguish from photon absorption or attenuation. On the other hand, some random photons may happen to hit the detector as a result of Compton scattering. The contribution of extra photons to the main photo-peak window is estimated to be approximately 30–40% [10]. Therefore, SC will reduce apparent overestimation of true counts. Numerous SC methods have been suggested, ranging from the simplest narrowing of the photo-peak window to the most complex scatter simulation methods. As for Tc-99m, the dual-energy window (DEW) method seems to fit for SC of 140-keV photons. Typically, the main photo-peak is set around 140 keV with ± 10% window (126–154 keV) and the lower energy scatter window around 120 keV with ± 5% window (115–125 keV). Currently, SC is not simply a subtraction of the scatter counts from the main counts, but it is integrated into the OSEM reconstruction process with other radioactivity correction algorithms.
Correction of Collimator-Detector Response
Photons from patients differentially interact with the collimated detector, depending on the distance between the patients and the detector. In other words, the same amount of radioactivity may present to the detector differently, according to the following variables: geometric response, intrinsic response, scattering with collimator septum, and penetration through collimator septum [6]. These variables are essentially related to the detector properties that change mainly according to the distance from the patients. The effects of the four variables can be simulated in advance by scanner manufacturers. Subsequently, simulated data can be retrieved to correct for the radioactivity distortions due to the four variables. This correction algorithm is called point-spread function correction, high definition, depth-dependent resolution recovery, or simply resolution recovery [7]. In addition to the quantitative efficacy of SPECT, using the correction algorithm for the collimator-detector response, image resolution is also improved and partial-volume correction becomes more effective.
Other Corrections
The triad corrections (AC, SC, and RR) seem to be an absolute prerequisite of quantitative SPECT/CT and are easily applied during acquisition/reconstruction processes if gamma cameras have those options; however, corrections for partial volume effect, dead-time loss, and patient motions are conditionally required. Partial volume effects affect radioactivity quantitation in objects smaller than three times the spatial resolution of the imaging system [7]. If the spatial resolution of reconstructed SPECT is 10 mm, the partial volume effect would reduce the true radioactivity up to the lesion size of 30 mm. In this regard, large organs such as the lungs, liver, kidneys, parotid, and thyroid are better targets for quantitative SPECT/CT than small organs such as the lymph nodes, parathyroid, and small tumors. When it is hard to specifically define the target lesion in terms of disease involved area (i.e., bone SPECT/CT for joint evaluation), SUVmax is more useful than SUVmean because it is easier to exclude disease non-involved areas. Dead-time loss may seriously underestimate true radioactivity if the activity is highly concentrated in a small area, which is often observed for thyroid remnant activity after high-dose administration of radioactive iodine. However, usual doses of Tc-99m radiopharmaceuticals are relatively small, typically less than 20–30 mCi, and highly concentrated activity is hardly observed. Therefore, dead-time loss may not be significant for diagnostic quantitative SPECT/CT. Voluntary or involuntary patient motions also create problems in accurate quantitation, but they are not unique for SPECT/CT and are being actively investigated. Finally, decay correction (DC) is a rather straightforward correction, and a certain reference time should be determined for DC. Time of injection or time of image acquisition start can be used as the reference time.
Voxel Size Issues
If single voxel SUV, i.e., SUVmax or SUVmin, is to be used, the voxel size of SPECT should be carefully determined. Total radioactivity concentration, in a macro scale like an organ, would not change by the acquisition parameters. Even in a micro scale, if the radioactivity is homogeneously distributed in a water bath, the radioactivity concentration would be stable regardless of the location of measurement or the voxel size. On the other hand, in a given human SPECT/CT image with heterogeneous distribution of radioactivity, total radioactivity concentration would not be substantially affected, but the local radioactivity concentration would vary according to the size of the voxel. The volume of voxel is determined by the zoom factor during image acquisition, the matrix size, the size of field-of-view (FOV), and the slice thickness. Slice thickness is often automatically determined depending on other parameters.
Then, the highest or the lowest local radioactivity concentration per voxel cannot be the same for the different acquisition conditions, which requires careful selection of acquisition parameters for SPECT, if SUVmax or SUVmin is the main quantitative parameter for disease evaluation.
Clinical Applications for Tc-99m Quantitative SPECT/CT
Bone or Joint Disease
The initial clinical application for quantitative SPECT/CT was reported for the absolute radioactivity concentration in bones by Cachovan et al. [11]. In that report, the absolute radioactivity in 133 lumbar vertebral bodies was 48.15 ± 13.66 kBq/mL, which was obtained approximately 4.5 h post-injection of Tc-99m diphosphonopropanodicarboxylic acid (DPD) (~ 15 mCi) [11]. Almost similar results were observed in our institute: the absolute radioactivity concentration in 144 lumbar vertebral bodies was 48.2 ± 13.7 kBq/mL 2–3 h post-injection of Tc-99m hydroxymethylenediphosphonate (HMDP) (~ 20 mCi) (unpublished data). Considering many different parameters of bone SPECT/CT between Cachovan (Siemens system) and US (GE system), we could conclude that state-of-the-art SPECT/CT technology has reached the level of possible clinical applications.
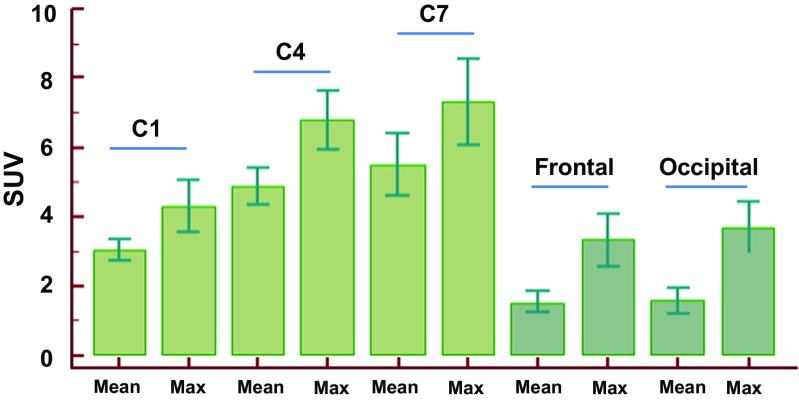
In terms of quantitative parameters, wide variations of SUV even in apparently normal bones were consistently observed, but, notably, there was a gradient of SUV from cervical spines to lumbar spines: the lowest SUV was observed in the highest vertebrae and the highest SUV in the lowest vertebrae [12]. We also found that the skull had lower SUV than the cervical spines, and within the cervical spines, higher vertebrae had lower SUV (Fig. 1). Age seems to be negatively correlated with SUV, whereas bone density as Hounsfield unit on CT may be positively correlated with SUV [11]. Still, however, it is safe to state that the SUV in normal bones has not been thoroughly investigated.
Fig. 1.
Standardized uptake value (SUV) of the cervical spine and the skull in 39 patients who underwent quantitative bone SPECT/CT. SUVmean and SUVmax were measured over cervical spines (C1, C4, and C7) and skull (frontal and occipital). There was a gradient of SUV over the skull and cervical spines: the skull had lower SUVs than the cervical spines and the lower cervical spines had greater SUVs than the upper ones. Data are mean ± standard deviation (unpublished data)
Identification of bone metastasis is a possible application for quantitative bone SPECT/CT and osteoblastic bone metastasis from prostate cancer, which usually shows high uptake of bone scan agents, may be distinguished from degenerative bone disease [12]. However, in other malignant diseases, bone metastasis may not show high uptake and some tumors are characteristically negative at the bone scan for bone metastatic lesions. Therefore, in general, a comprehensive review of all available imaging studies may be more critical than simply setting up SUV criteria for bone metastasis identification.
In this regard, non-malignant bone/joint diseases are promising targets for quantitative bone SPECT/CT. More specifically, joint diseases such as temporomandibular joint disorder (TMD) and degenerative knee joint have been successfully evaluated using SUVmax from quantitative bone SPECT/CT [13, 14]. Traditional lesion-to-background ratios of planar bone scan were less efficient than SUVmax to classify TMD [13], and disease severity was more reliably assessed with SUVmax than with subjective symptoms in patients with degenerative knee disease [14].
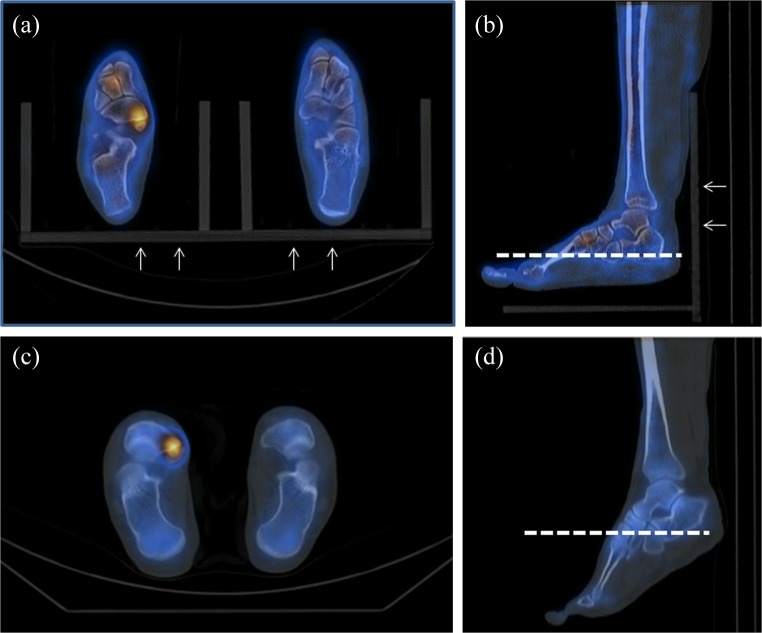
Accessory navicular bone (ANB) is an ossicle that may or may not elicit an orthopedic problem [15]. Symptomatic ANB often shows increased bone tracer uptake [16, 17] but a thorough investigation regarding the role of bone SPECT/CT has never been conducted probably because of lack of objective methods for the assessment of bone tracer uptake [18, 19]. We calculated the SUVmax over the ANB and correlated it with clinical outcomes [20]. As expected, higher SUVmax was correlated with aggressive type of ANB. Interestingly, ultimate surgical treatment was more frequently observed in patients with high SUVmax (i.e., greater than the SUVmax cut-off of 5.27). These findings suggest that SUVmax, a quantitative parameter for bone SPECT/CT, may serve as an objective criterion for surgical treatment decisions for ANB, a hypothesis that requires further studies. In case of foot SPECT/CT, the use of immobilization devices was reported to be useful for the reduction of mismatch between SPECT and CT [21]. For a multi-center study to be implemented, SPECT/CT protocols for acquisition and reconstruction should be harmonized. In case of foot SPECT/CT, the orthogonal position of foot/ankle achieved by using immobilization devices may enhance clarification of any bone lesions with increased uptake and thus facilitate proper communication between nuclear medicine physicians and clinicians (Fig. 2).
Fig. 2.
Foot SPECT/CT with (a, b) or without (c, d) an immobilization device. The immobilization device (white arrows) has the feet placed in orthogonal position, whereas, without any fixing device, the feet are unleashed to any configuration (c, e). The dashed lines highlight the orthogonal position of the feet that can be achieved using the immobilization device
Thyroid Disease
Tc-99m pertechnetate enters into thyroid follicular cells via the sodium-iodide symporter but is not retained within the thyrocytes due to lack of retention mechanisms [22, 23]. However, it is well known that the uptake of Tc-99m pertechnetate is relatively stable during 20–30 min after intravenous injection [24]. Thus, because we can assume that the distribution of Tc-99m pertechnetate does not substantially change during this period, quantitative SPECT will be possible if SPECT acquisition is fast. We attest that just 1-min SPECT acquisition should work for this purpose and modern SPECT/CT scanners show unprecedented accuracy in clinical studies of Tc-99m pertechnetate.
Conventional measurements of thyroid uptake of Tc-99m pertechnetate have been fulfilled with the thyroid uptake system (TUS). TUS consists of a two-dimensional scintillation detector and Tc-99m pertechnetate uptakes are counted over anterior neck (thyroid) and thigh muscle as background for 1 min each. Injected activity is calculated by deducting the counts of post-injection syringe from the counts of pre-injection syringe. This method has been widely adopted in many institutes but the accuracy of the TUS-based %uptake of Tc-99m pertechnetate has always been questioned. We elaborated in the following studies to prove that TUS can be replaced by quantitative SPECT/CT regarding the measurement of Tc-99m pertechnetate thyroid uptake.
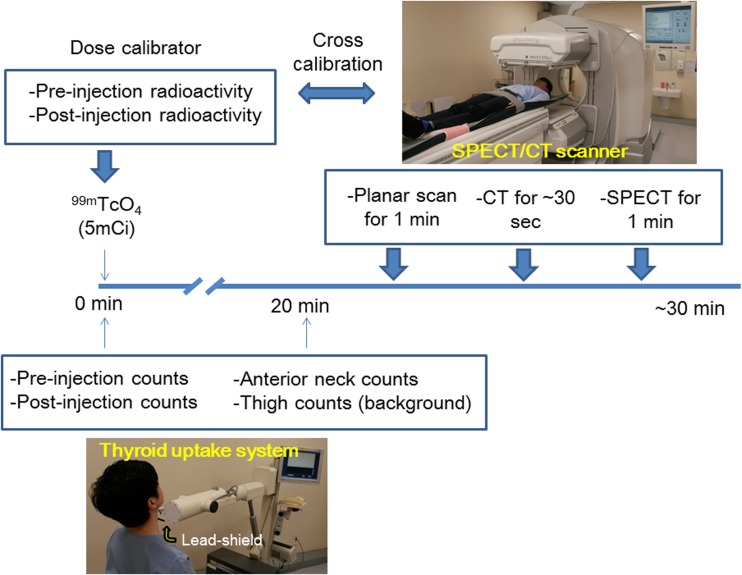
In order to prove the superiority of quantitative SPECT/CT compared to TUS, we performed two studies involving a short period of 20–30 min post-injection of Tc-99m pertechnetate (Fig. 3). The problem of this scheme was that usual radioactivity for TUS was less than 1 mCi, which was not sufficient for SPECT acquisition. Thus, we increased the dose of Tc-99m pertechnetate to 5 mCi and placed a lead-shield of 10th-value layer thickness (0.95 mm) at the aperture of TUS. Therefore, TUS encounters a low dose of Tc-99m pertechnetate (~ 0.5 mCi), while sufficient amounts of Tc-99m pertechnetate (5 mCi) are projected to the SPECT scanner, enabling fast serial measurement of TUS and SPECT/CT in a single imaging session during the stable retention time of Tc-99m pertechnetate (Fig. 3). The dose calibrator and the SPECT/CT scanner had been previously cross-calibrated.
Fig. 3.
Serial studies of Tc-99m pertechnetate thyroid uptake by conventional thyroid uptake system (TUS) and quantitative SPECT/CT. TUS had lead-shield of 10th-value layer thickness (0.95 mm) at the aperture in order to reduce actual radioactivity projecting to the TUS scintillation detector down to ~ 0.5 mCi, even though real injected radioactivity was 5 mCi. The %uptake of Tc-99m pertechnetate by TUS was calculated as 100 × (anterior neck counts − thigh counts)/(pre-injection counts − post-injection counts). The quantitative SPECT/CT was performed immediately after the TUS study. All measurements/imaging by TUS and SPECT/CT were performed 20–30 min post-injection of Tc-99m pertechnetate. (This figure was originally published by Lee et al. [25])
The results clearly showed the high accuracy of quantitative SPECT/CT, whereas TUS systematically overestimated the thyroid uptake of Tc-99m pertechnetate because two-dimensional TUS could not distinguish between extra-thyroid tissue uptake and genuine thyroid uptake [25]. This unparalleled accuracy of quantitative SPECT/CT resulted in a novel application for thyroid uptake of Tc-99m pertechnetate regarding the risk stratification of Graves’ disease: high thyroid uptake of Tc-99m pertechnetate by quantitative SPECT/CT (> 5%) was associated with poorer response to the anti-thyroid drug of methimazole [26]. Even chronic thyroiditis patients could be discriminated from euthyroid patients using quantitative SPECT/CT, which has never been reported before [27]. Autonomously functioning thyroid nodule (AFTN) has been qualitatively evaluated so far, and actually, the definition of hot nodule of thyroid is unclear until now. SUVmax may play an important role in the characterization of thyroid hot nodule and influence treatment decision [28].
Kidney Disease
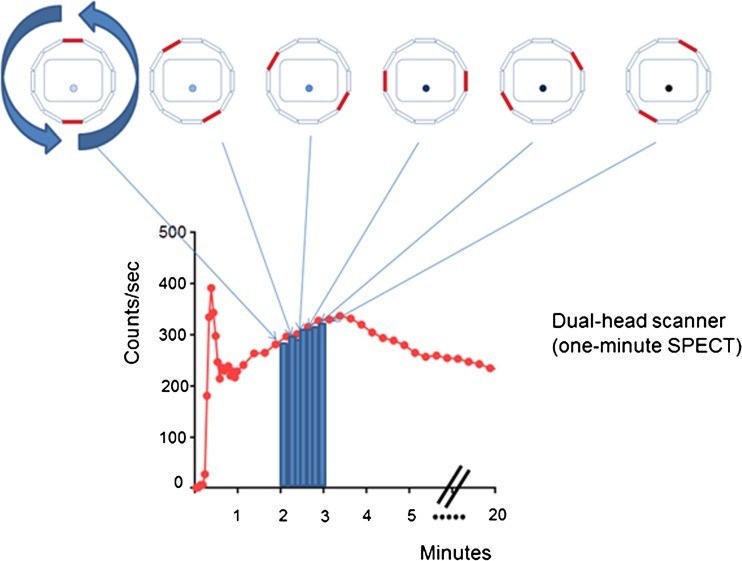
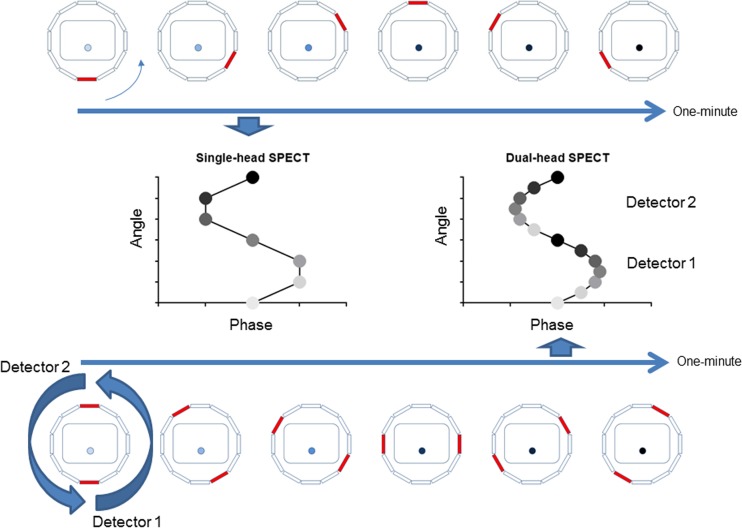
Renal scintigraphy has been performed in a dynamic mode, and SPECT/CT has rarely been attempted for functional evaluation of kidney diseases. Typical renal scintigraphy lasts for 20–30 min during which the Tc-99m-labeled radiopharmaceutical, such as Tc-99m diethylenetriamine pentaacetic acid (DTPA), rapidly moves from blood to renal parenchyma, and then to the urinary system. The most popular acquisition mode of renal scintigraphy is the dynamic planar scan with a detector positioned underneath the back of the patient. For the measurement of glomerular filtration rate (GFR), the 1-min period over 2–3 min post-injection of Tc-99m DTPA is used for calculation of the %injected dose (%ID). The %ID is then transformed to GFR using a formula derived from the 24-h urinary clearance of creatinine in Gates’ method [29, 30]. Focusing on this critical time period (2–3 min post-injection), we can apply quantitative SPECT/CT to Tc-99m DTPA imaging. One-minute SPECT during 2–3 min is performed with the two detectors positioned opposite to each other (Fig. 4), followed by CT. The disadvantage of this approach is that it is hard to assume any stable retention period that is ideal for SPECT image acquisition. In the 2–3-min period on the upslope of the renogram, activity in the initial minutes is always lower than in the last minutes. This problem may be ameliorated by increasing the number of detectors. The dual-head SPECT will reduce the coverage of each detector to half the singe-head SPECT and spread the end-to-end difference of activities, generating a kind of averaging effect, which can be observed over the sinogram (Fig. 5). Reproducibility of %ID measurement was better for dual-head SPECT than for planar dynamic renal scintigraphy [31].
Fig. 4.
Schematic display of 1-min SPECT for measurement of %ID and glomerular filtration rate using dual-head scanner. The time of SPECT acquisition falls upon the upward slope of the renogram of Tc-99m DTPA. Box indicates body contour, and the dot inside simulates a kidney with increasing radioactivity
Fig. 5.
Sinograms of 1-min SPECT during the dynamic phase of Tc-99m DTPA. The sinogram from single-head SPECT will show the minimum activity at the beginning (angle zero) and the maximum activity at the end (angle 360°). This activity difference will be tandemly repeated by the dual-head SPECT, but the coverage of each individual detector is reduced to half in the dual-head SPECT, shortening the span of activity difference. Box indicates body contour, and the dot inside simulates a kidney with increasing radioactivity. Circles over the sinogram are arbitrarily graded to highlight increasing radioactivity
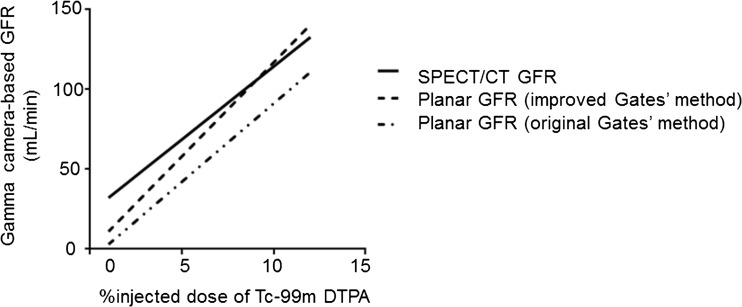
Subsequently, the obtained %ID is transformed to GFR (mL/min) using a formula. The original GFR equation by Gates (GFR (mL/min) = (%ID × 9.8127) – 6.82519) [30] has been criticized to yield relatively lower GFR values compared to other tests, such as serum creatinine-based estimated GFR. Using a better reference standard of Cr-51 EDTA plasma clearance, the planar %ID formula could be improved to generate higher GFR values in a given %ID, especially in the high GFR range (GFR (mL/min) = (%ID × 11.7773) – 0.7354) [32]. The most recent formula using the SPECT/CT-derived %ID (GFR (mL/min) = (%ID × 9.1462) + 23.0653) with the reference of Cr-51 EDTA test [31] overestimates GFR, particularly in the lower GFR range; therefore, it should be updated. However, it is interesting to appreciate the similar GFR values from %ID whether from planar or SPECT/CT imaging (Fig. 6). Using this SPECT/CT approach, GFR of renal tumor patients pre-/post-unilateral partial nephrectomy was successfully evaluated [31]. Urinary stone is also an interesting disease entity that can be effectively assessed using quantitative SPECT/CT because almost all urinary stones are calcium stones that can be well visualized without the use of iodine-contrast agents in SPECT/CT. The combination of functional evaluation for the GFR and anatomical assessment for the urinary stones seem to be a novel application for quantitative SPECT/CT using Tc-99m DTPA [].
Fig. 6.
Comparisons of gamma camera imaging based formulas for GFR. The linear relations between %injected dose (%ID) of Tc-99m DTPA at 2–3 min post-injection and the glomerular filtration rate are displayed. The original formula of Gates’ method (GFR (mL/min) = (%ID × 9.8127) − 6.82519), and the improved formula (GFR (mL/min) = (%ID × 11.7773) − 0.7354) were based on planar imaging. The SPECT/CT formula (GFR (mL/min) = (%ID × 9.1462) + 23.0653) yields GFR values equivalent to the improved Gates’ method in the high GFR range, but there is some overestimation of GFR in lower GFR range, which requires update in the future. (This figure was originally published by Kang et al. [31] and reused with permission of Springer Nature)
Lung Perfusion SPECT for Dosimetry of Trans-Arterial Radio-Embolization
Lung perfusion SPECT/CT is by itself a promising tomographic hybrid imaging tool with better functional evaluation than conventional planar lung perfusion scintigraphy [33]. In terms of quantitation of Tc-99m macro-aggregated albumin (MAA) uptake, quantitative SPECT/CT shows a huge potential for application during Y-90 microsphere trans-arterial radio-embolization (TARE) therapy for hematoma. Traditionally, the administration dose of Y-90 microspheres has been determined on the basis of lung-shunt fraction from planar lung perfusion scintigraphy. The lung-shunt fraction is the percentage of lung counts divided by the sum of lung and liver counts. The counts for the lungs and liver are calculated as the geometric mean of anterior and posterior planar images. More than 20% of lung-shunt fraction is considered as an absolute contraindication for TARE [34]. An absorbed dose over 30 Gy in a single TARE session or an accumulated absorbed dose over 50 Gy in multiple sessions are considered as contraindication for TARE [35, 36]. Undoubtedly, there is a limitation of planar image-based lung-shunt fraction measurement. High lung-shunt fraction over 20% in the planar scan may not elicit a serious adverse effect if the absolute lung absorbed dose is less than 30 Gy, or lung-shunt fraction below 20% may be unacceptable with absolutely high lung absorbed dose. In terms of dosimetry of angiographically administered Tc-99m MAA, biological decay is not considered but only physical decay should be incorporated to the calculation of the absorbed dose, which yields the following rather simple formula:
A0 is the radioactivity of the Y-90 microspheres and m is the mass of the organ of interest. Volume of organ is converted to mass using a conversion factor: 0.3 for the lungs and 1.03 for other soft tissues such as the liver or tumors.
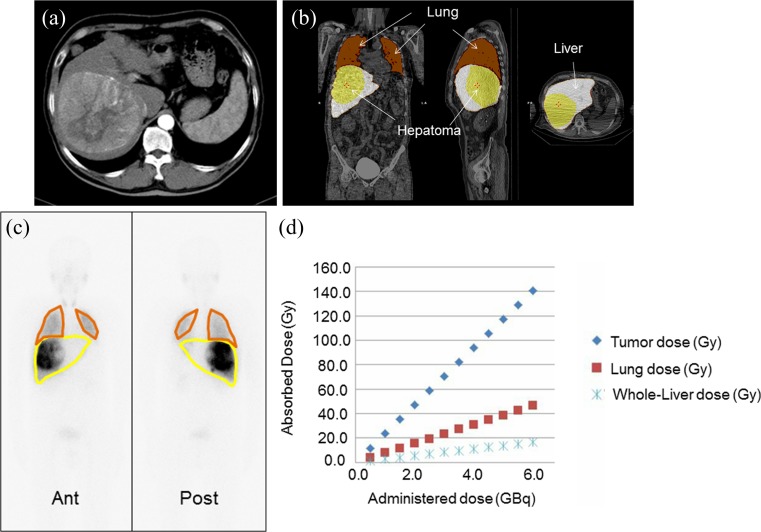
The %ID of Tc-99m MAA for an individual organ is a surrogate for %ID of Y-90 microspheres if the injection point during angiography is the same. Subsequently, the dosimetry for Y-90 microspheres can be simulated using the %ID of Tc-99m MAA. Because there is a linear relationship between Y-90 microsphere radioactivity (GBq) and absorbed dose (Gy) when the same mass is involved, the expected absorbed doses for each organ can be tabulated for variable radioactivity of Y-90 microspheres, which enables intuitive dosimetry for whole organs in variable scenarios (Fig. 7).
Fig. 7.
Dosimetry of Tc-99m MAA SPECT/CT for Y-90 microsphere TARE. Huge hepatoma is observed in abdominal CT (a). Segmentations of tumor, lung, and non-tumoral liver on CT of SPECT/CT. %injected doses were calculated over the segmented organs (b). Planar scintigraphy showing Tc-99m MAA uptake over the lung, tumor, and liver. The calculated lung-shunt fraction was 26% (c). The dosimetry graph reveals the linear relationship between Y-90 microsphere dose (GBq) and the expected absorbed dose (Gy). If 6.0 GBq is administered, the expected absorbed dose to tumor will be more than 120 Gy, but the expected lung dose will be over 40 Gy, which is unacceptable. If 2.0 GBq is delivered to the patient, the expected lung absorbed dose will be within the acceptable range of less than 20 Gy, but the expected tumor dose is merely 40 Gy, thus a therapeutic effect is not expected
For a typical condition of TARE, tumor absorbed dose should be higher than 120 Gy [37], while keeping the lung absorbed dose below 30 Gy. If the expected lung absorbed dose is reasonably low without any other extra-organ exposure, the therapeutic absorbed dose to tumors may be substantially elevated, resulting in better tumor control, a hypothesis that requires further study.
Compared to the pre-therapeutic dosimetry of Tc-99m MAA SPECT/CT, Y-90 PET/CT can play a role for a reference dosimetry post-TARE; Y-90 yields a small fraction of positron (~ 0.003%) that can be imaged using state-of-the-art PET scanners with time-of-flight capacity [34]. In ideal conditions (complete labeling of Tc-99m with MAA in vitro, no breakdown of Tc-99m MAA in vivo, exactly the same angiographic conditions, and accurate checkup of residual Y-90 microspheres post-injection), quantitative Tc-99m MAA SPECT/CT will be useful for highly sophisticated treatment planning, a hypothesis that warrants further investigation.
Conclusion
Tc-99m quantitative SPECT/CT holds promise in a variety of nuclear medicine practices. Conventional planar imaging studies including bone scan, renal scan, thyroid scan, and lung perfusion scan are being upgraded using the established quantitation technology. There are numerous other nuclear imaging studies that can be transformed to truly quantitative studies. Quantitative SPECT/CT may be realized in other radionuclides such Iodine-123, Iodine-131, and Iodine-111. Nuclear medicine may become really new clear medicine in terms of radioactivity quantitation thanks to the advancement of SPECT/CT technology.
Acknowledgement
This work was supported in part by the Basic Science Research Program through the National Research Foundation of Korea funded by the Ministry of Education (2018R1D1A1A09081961) and by the Korean Society of Nuclear Medicine Clinical Trial Network (KSNM CTN) working group funded by the Korean Society of Nuclear Medicine (KSNM-CTN-2017-01-01).
Compliance with Ethical Standards
Conflicts of Interest
Won Woo Lee declares that there is no conflict of interest.
Ethical Approval
This article does not contain any studies with human participants or animals performed by any of the authors.
Informed Consent
Not applicable.
Footnotes
Publisher’s Note
Springer Nature remains neutral with regard to jurisdictional claims in published maps and institutional affiliations.
References
- 1.Lang TF, Hasegawa BH, Liew SC, Brown JK, Blankespoor SC, Reilly SM, et al. Description of a prototype emission-transmission computed tomography imaging system. J Nucl Med. 1992;33:1881–1887. [PubMed] [Google Scholar]
- 2.Keidar Z, Israel O, Krausz Y. SPECT/CT in tumor imaging: technical aspects and clinical applications. Semin Nucl Med. 2003;33:205–218. doi: 10.1053/snuc.2003.127310. [DOI] [PubMed] [Google Scholar]
- 3.Na CJ, Kim J, Choi S, Han YH, Jeong HJ, Sohn MH, et al. The clinical value of hybrid sentinel lymphoscintigraphy to predict metastatic sentinel lymph nodes in breast cancer. Nucl Med Mol Imaging. 2015;49:26–32. doi: 10.1007/s13139-014-0298-9. [DOI] [PMC free article] [PubMed] [Google Scholar]
- 4.Boellaard R. Standards for PET image acquisition and quantitative data analysis. J Nucl Med. 2009;50(Suppl 1):11S–20S. doi: 10.2967/jnumed.108.057182. [DOI] [PubMed] [Google Scholar]
- 5.Yi HK, Park YJ, Bae JH, Lee JK, Lee KH, Choi SH, et al. Inverse prognostic relationships of (18)F-FDG PET/CT metabolic parameters in patients with distal bile duct cancer undergoing curative surgery. Nucl Med Mol Imaging. 2018;52:334–341. doi: 10.1007/s13139-018-0542-9. [DOI] [PMC free article] [PubMed] [Google Scholar]
- 6.Ritt P, Vija H, Hornegger J, Kuwert T. Absolute quantification in SPECT. Eur J Nucl Med Mol Imaging. 2011;38(Suppl 1):S69–S77. doi: 10.1007/s00259-011-1770-8. [DOI] [PubMed] [Google Scholar]
- 7.Bailey DL, Willowson KP. An evidence-based review of quantitative SPECT imaging and potential clinical applications. J Nucl Med. 2013;54:83–89. doi: 10.2967/jnumed.112.111476. [DOI] [PubMed] [Google Scholar]
- 8.Bailey DL. Transmission scanning in emission tomography. Eur J Nucl Med. 1998;25:774–787. doi: 10.1007/s002590050282. [DOI] [PubMed] [Google Scholar]
- 9.Vandervoort E, Celler A, Harrop R. Implementation of an iterative scatter correction, the influence of attenuation map quality and their effect on absolute quantitation in SPECT. Phys Med Biol. 2007;52:1527–1545. doi: 10.1088/0031-9155/52/5/020. [DOI] [PubMed] [Google Scholar]
- 10.Hutton BF, Buvat I, Beekman FJ. Review and current status of SPECT scatter correction. Phys Med Biol. 2011;56:R85–112. doi: 10.1088/0031-9155/56/14/R01. [DOI] [PubMed] [Google Scholar]
- 11.Cachovan M, Vija AH, Hornegger J, Kuwert T. Quantification of 99mTc-DPD concentration in the lumbar spine with SPECT/CT. EJNMMI Res. 2013;3:45. doi: 10.1186/2191-219X-3-45. [DOI] [PMC free article] [PubMed] [Google Scholar]
- 12.Kuji I, Yamane T, Seto A, Yasumizu Y, Shirotake S, Oyama M. Skeletal standardized uptake values obtained by quantitative SPECT/CT as an osteoblastic biomarker for the discrimination of active bone metastasis in prostate cancer. Eur J Hybrid Imaging. 2017;1:2. doi: 10.1186/s41824-017-0006-y. [DOI] [PMC free article] [PubMed] [Google Scholar]
- 13.Suh MS, Lee WW, Kim YK, Yun PY, Kim SE. Maximum standardized uptake value of (99m) Tc hydroxymethylene diphosphonate SPECT/CT for the evaluation of temporomandibular joint disorder. Radiology. 2016;280:890–896. doi: 10.1148/radiol.2016152294. [DOI] [PubMed] [Google Scholar]
- 14.Kim J, Lee HH, Kang Y, Kim TK, Lee SW, So Y, et al. Maximum standardised uptake value of quantitative bone SPECT/CT in patients with medial compartment osteoarthritis of the knee. Clin Radiol. 2017;72:580–589. doi: 10.1016/j.crad.2017.03.009. [DOI] [PubMed] [Google Scholar]
- 15.Miller TT, Staron RB, Feldman F, Parisien M, Glucksman WJ, Gandolfo LH. The symptomatic accessory tarsal navicular bone: assessment with MR imaging. Radiology. 1995;195:849–853. doi: 10.1148/radiology.195.3.7754020. [DOI] [PubMed] [Google Scholar]
- 16.Chiu NT, Jou IM, Lee BF, Yao WJ, Tu DG, Wu PS. Symptomatic and asymptomatic accessory navicular bones: findings of Tc-99m MDP bone scintigraphy. Clin Radiol. 2000;55:353–355. doi: 10.1053/crad.2000.0436. [DOI] [PubMed] [Google Scholar]
- 17.Chong A, Ha JM, Lee JY. Clinical meaning of hot uptake on bone scan in symptomatic accessory navicular bones. Nucl Med Mol Imaging. 2016;50:322–328. doi: 10.1007/s13139-016-0452-7. [DOI] [PMC free article] [PubMed] [Google Scholar]
- 18.Romanowski CA, Barrington NA. The accessory navicular—an important cause of medial foot pain. Clin Radiol. 1992;46:261–264. doi: 10.1016/S0009-9260(05)80167-9. [DOI] [PubMed] [Google Scholar]
- 19.Shah S, Achong DM. The painful accessory navicular bone: scintigraphic and radiographic correlation. Clin Nucl Med. 1999;24:125–126. doi: 10.1097/00003072-199902000-00012. [DOI] [PubMed] [Google Scholar]
- 20.Bae S. Kang Y, Song YS, Lee WW, K-SPECT Group Maximum standardized uptake value of foot SPECT/CT using Tc-99m HDP in patients with accessory navicular bone as a predictor of surgical treatment. Medicine (Baltimore) 2019;e14022:98. doi: 10.1097/MD.0000000000014022. [DOI] [PMC free article] [PubMed] [Google Scholar]
- 21.Machado Jdo M, Monteiro MS, Vieira VF, Collinot JA, Prior JO, Vieira L, et al. Value of a lower-limb immobilization device for optimization of SPECT/CT image fusion. J Nucl Med Technol. 2015;43:98–102. doi: 10.2967/jnmt.114.145771. [DOI] [PubMed] [Google Scholar]
- 22.Chung JK. Sodium iodide symporter: its role in nuclear medicine. J Nucl Med. 2002;43:1188–1200. [PubMed] [Google Scholar]
- 23.Chung JK, Youn HW, Kang JH, Lee HY, Kang KW. Sodium iodide symporter and the radioiodine treatment of thyroid carcinoma. Nucl Med Mol Imaging. 2010;44:4–14. doi: 10.1007/s13139-009-0016-1. [DOI] [PMC free article] [PubMed] [Google Scholar]
- 24.Meller J, Becker W. The continuing importance of thyroid scintigraphy in the era of high-resolution ultrasound. Eur J Nucl Med Mol Imaging. 2002;29(Suppl 2):S425–S438. doi: 10.1007/s00259-002-0811-8. [DOI] [PubMed] [Google Scholar]
- 25.Lee H, Kim JH, Kang YK, Moon JH, So Y, Lee WW. Quantitative single-photon emission computed tomography/computed tomography for technetium pertechnetate thyroid uptake measurement. Medicine (Baltimore) 2016;95:e4170. doi: 10.1097/MD.0000000000004170. [DOI] [PMC free article] [PubMed] [Google Scholar]
- 26.Kim HJ, Bang JI, Kim JY, Moon JH, So Y, Lee WW. Novel application of quantitative single-photon emission computed tomography/computed tomography to predict early response to methimazole in Graves’ disease. Korean J Radiol. 2017;18:543–550. doi: 10.3348/kjr.2017.18.3.543. [DOI] [PMC free article] [PubMed] [Google Scholar]
- 27.Kim JY, Kim JH, Moon JH, Kim KM, Oh TJ, Lee DH, et al. Utility of quantitative parameters from single-photon emission computed tomography/computed tomography in patients with destructive thyroiditis. Korean J Radiol. 2018;19:470–480. doi: 10.3348/kjr.2018.19.3.470. [DOI] [PMC free article] [PubMed] [Google Scholar]
- 28.Lee R, So Y, Song YS, Lee WW. Evaluation of hot nodules of thyroid gland using Tc-99m pertechnetate: a novel approach using quantitative single-photon emission computed tomography/computed tomography. Nucl Med Mol Imaging. 2018;52:468–472. doi: 10.1007/s13139-018-0554-5. [DOI] [PMC free article] [PubMed] [Google Scholar]
- 29.Gates GF. Glomerular filtration rate: estimation from fractional renal accumulation of 99mTc-DTPA (stannous) AJR Am J Roentgenol. 1982;138:565–570. doi: 10.2214/ajr.138.3.565. [DOI] [PubMed] [Google Scholar]
- 30.Gates GF. Computation of glomerular filtration rate with Tc-99m DTPA: an in-house computer program. J Nucl Med. 1984;25:613–618. [PubMed] [Google Scholar]
- 31.Kang YK, Park S, Suh MS, Byun SS, Chae DW, Lee WW. Quantitative single-photon emission computed tomography/computed tomography for glomerular filtration rate measurement. Nucl Med Mol Imaging. 2017;51:338–346. doi: 10.1007/s13139-017-0491-8. [DOI] [PMC free article] [PubMed] [Google Scholar]
- 32.Kim YI, Ha S, So Y, Lee WW, Byun SS, Kim SE. Improved measurement of the glomerular filtration rate from Tc-99m DTPA scintigraphy in patients following nephrectomy. Eur Radiol. 2014;24:413–422. doi: 10.1007/s00330-013-3039-z. [DOI] [PMC free article] [PubMed] [Google Scholar]
- 33.Suh M, Kang YK, Ha S, Kim YI, Paeng JC, Cheon GJ, et al. Comparison of two different segmentation methods on planar lung perfusion scan with reference to quantitative value on SPECT/CT. Nucl Med Mol Imaging. 2017;51:161–168. doi: 10.1007/s13139-016-0448-3. [DOI] [PMC free article] [PubMed] [Google Scholar]
- 34.Song YS, Paeng JC, Kim HC, Chung JW, Cheon GJ, Chung JK, et al. PET/CT-based dosimetry in 90Y-microsphere selective internal radiation therapy: single cohort comparison with pretreatment planning on (99m)Tc-MAA imaging and correlation with treatment efficacy. Medicine (Baltimore) 2015;94:e945. doi: 10.1097/MD.0000000000000945. [DOI] [PMC free article] [PubMed] [Google Scholar]
- 35.Lee EW, Alanis L, Cho SK, Saab S. Yttrium-90 selective internal radiation therapy with glass microspheres for hepatocellular carcinoma: current and updated literature review. Korean J Radiol. 2016;17:472–488. doi: 10.3348/kjr.2016.17.4.472. [DOI] [PMC free article] [PubMed] [Google Scholar]
- 36.Dittmann H, Kopp D, Kupferschlaeger J, Feil D, Groezinger G, Syha R, et al. A prospective study of quantitative SPECT/CT for evaluation of lung shunt fraction before SIRT of liver tumors. J Nucl Med. 2018;59:1366–1372. doi: 10.2967/jnumed.117.205203. [DOI] [PubMed] [Google Scholar]
- 37.Lau WY, Leung WT, Ho S, Leung NW, Chan M, Lin J, et al. Treatment of inoperable hepatocellular carcinoma with intrahepatic arterial yttrium-90 microspheres: a phase I and II study. Br J Cancer. 1994;70:994–999. doi: 10.1038/bjc.1994.436. [DOI] [PMC free article] [PubMed] [Google Scholar]


