



Long-term exposure to projected future CO2 levels has no effect on the aerobic performance of two tropical cephalopod species. The resting oxygen uptake rates, maximal oxygen uptake rates, aerobic scope, and recovery time of both bigfin reef squid and two-toned pygmy squid were unaltered by elevated CO2.
Keywords: Aerobic scope, cephalopod, CO2 respirometry, ocean acidification, oxygen uptake
Abstract
Squid and many other cephalopods live continuously on the threshold of their environmental oxygen limitations. If the abilities of squid to effectively take up oxygen are negatively affected by projected future carbon dioxide (CO2) levels in ways similar to those demonstrated in some fish and invertebrates, it could affect the success of squid in future oceans. While there is evidence that acute exposure to elevated CO2 has adverse effects on cephalopod respiratory performance, no studies have investigated this in an adult cephalopod after relatively prolonged exposure to elevated CO2 or determined any effects on aerobic scope. Here, we tested the effects of prolonged exposure (≥20% of lifespan) to elevated CO2 levels (~1000 μatm) on the routine and maximal oxygen uptake rates, aerobic scope and recovery time of two tropical cephalopod species, the two-toned pygmy squid, Idiosepius pygmaeus and the bigfin reef squid, Sepioteuthis lessoniana. Neither species exhibited evidence of altered aerobic performance after exposure to elevated CO2 when compared to individuals held at control conditions. The recovery time of I. pygmaeus under both control and elevated CO2 conditions was less than 1 hour, whereas S. lessoniana required approximately 8 hours to recover fully following maximal aerobic performance. This difference in recovery time may be due to the more sedentary behaviours of I. pygmaeus. The ability of these two cephalopod species to cope with prolonged exposure to elevated CO2 without detriment to their aerobic performance suggests some resilience to an increasingly high CO2 world.
Introduction
Atmospheric carbon dioxide (CO2) concentrations have increased from 280 ppm before the industrial revolution to over 400 ppm in the current day (Dlugokencky and Tans, 2018), a level that is higher than any time in the past 800 000 years (Lüthi et al., 2008). On the current emissions trajectory, it is projected that atmospheric CO2 will exceed 900 ppm by the end of this century (Collins et al., 2013), increasing at a rate at least an order of magnitude faster than at any time in the past million years (Doney and Schimel, 2007). The partial pressure of CO2 (pCO2) in the surface oceans is in approximate gas equilibrium with the atmosphere, meaning that CO2 concentrations in the oceans are increasing at approximately the same rate as the atmosphere (Doney, 2010). Furthermore, the oceans experience seasonal fluctuations in pCO2, and these fluctuations are projected to become amplified in the future due to the increased Revelle (buffer) factor of acidified seawater (McNeil and Sasse, 2016). The increase in average pCO2 along with the amplification of seasonal cycles of pCO2 indicates that marine organisms could experience CO2 levels >1000 μatm before the end of the century (McNeil and Sasse, 2016). This rapid increase of CO2 levels in the surface oceans could have a range of adverse effects on many marine species (Hoegh-Guldberg et al., 2007; Fabry et al., 2008; Doney et al., 2009; Kroeker et al., 2013; Clements and Hunt, 2015; Cattano et al., 2018).
The capacity to deliver sufficient oxygen to the tissues, in order to meet increasing demand, has been hypothesized to constrain the performance of marine species under climate change and ocean acidification (Fry and Hart, 1948; Pörtner and Farrell, 2008). Squid, the most active order of cephalopods, have high mass-specific oxygen consumption rates and blood with low oxygen-carrying capacity when compared to fishes (O’Dor and Webber, 1986; Shadwick et al., 1990). One of their most advantageous evolutionary adaptations, jet propulsion, allows them to rapidly escape predators and compete for food with carnivorous fishes (Hanlon and Messenger, 1996). However, this mode of locomotion is inherently inefficient, requiring a significant output of energy from their mantle muscles, which further increases their already high demand for oxygen (O’Dor, 1988a, 1988b). To satisfy such a high demand of oxygen, both at rest and during sustained swimming, squid must pump large amounts of blood and extract most (or all) of the oxygen from it during one cycle through the body, leaving little to no venous oxygen reserve (O’Dor and Webber, 1986; Wells et al., 1988; Rosa and Seibel, 2008). The combination of these factors contributes to many squid species living chronically at the threshold of their oxygen limitation (Pörtner, 2002). Furthermore, the oxygen-carrying capacity of cephalopod hemocyanin, which delivers the oxygen to tissues and cells, has been hypothesized to be highly sensitive to changes in pH (Bridges, 1995). These unique physiological traits may mean the respiratory capacity of squid is affected by rising CO2 levels in the ocean. However, models by Birk et al. (2018) suggest that climate change relevant CO2 levels may not alter squid blood oxygen binding to a degree that will affect aerobic performance. Whether the oxygen uptake capabilities of squid will be susceptible to elevated CO2 levels may depend on the level of sensitivity of their hemocyanin to changes in pH (e.g. Seibel, 2016; Birk et al., 2018).
The physiological performance of aquatic animals has often been linked to their aerobic scope, the difference between the routine oxygen uptake (ṀO2Routine) and maximal oxygen uptake (ṀO2Max) rates. Aerobic scope indicates the amount of oxygen available, beyond basal metabolic costs, for critical aerobic activities (Eliason et al., 2008; Pörtner and Farrell, 2008; Pörtner and Peck, 2010). The type of effect and magnitude of changes in aerobic scope resulting from elevated CO2 appear to be species specific. In fishes, for example, the effects of elevated CO2 on aerobic scope are highly variable, with different studies reporting a decrease (Munday et al., 2009), increase (Couturier et al., 2013; Rummer et al., 2013) or no effect on aerobic scope (Melzner et al., 2009a). Moreover, recent meta-analyses find no consistent effect of elevated CO2 on aerobic scope in marine fishes when all studies conducted to date are considered (Lefevre, 2016; Cattano et al., 2018; Hannan and Rummer, 2018). Although less studied, the reported effects of elevated CO2 on aerobic scope in molluscs are also variable. Elevated CO2 causes a reduced aerobic scope in the scallop, Pecten maximus (Schalkhausser et al., 2013), but no effect on the aerobic scope of the gastropod, Gibberulus gibberulus gibbosus (Watson et al., 2014; Lefevre et al., 2015). The effects of elevated CO2 on resting or routine oxygen consumption also varies among mollusc species. Elevated CO2 causes a depression in oxygen uptake rates in six bivalve species (Fernández-Reiriz et al., 2011; Wenguang and Maoxian, 2012; Navarro et al., 2013) and one gastropod species (Melatunan et al., 2011). However, other bivalve species respond to elevated CO2 with an increase in oxygen uptake rates (Beniash et al., 2010; Cummings et al., 2011). Given the variety of effects on respiratory performance observed in a range of mollusc taxa, most of those being sedentary species, it is difficult to predict how the more active cephalopod species will respond to elevated CO2.
In cephalopods, the effects of elevated CO2 on respiratory performance appear to be both species as well as life stage specific. Very high CO2 (~4000 μatm) had no effect on oxygen consumption in juvenile common cuttlefish, Sepia officinalis (Gutowska et al., 2008). In the same species, similarly high CO2 exposure (~3600 μatm) reduced oxygen uptake by ~ 20% during the late-stage embryo incubation period, although there was no effect at CO2 levels more closely resembling those that could occur in the ocean in the next 100 years (~1400 μatm) (Sigwart et al., 2016). Elevated CO2 (~1650 μatm) reduced oxygen uptake rates in late-stage embryos and newly hatched paralarvae of the squid Loligo vulgaris (Rosa et al., 2014). By contrast, ṀO2Routine of adult bigfin reef squid (Sepioteuthis lessoniana) was not altered by moderately high CO2 levels (1586 μatm) (Hu et al., 2014), yet oxygen uptake rates were depressed by 40% when they were exposed to very high CO2 levels (4134 μatm) for 7 days (Hu et al., 2014). Juvenile jumbo squid, Dosidicus gigas, showed suppressed ṀO2 at elevated CO2 levels (estimated at ~ 1000 μatm) (Rosa and Seibel, 2008); however, with a longer acclimation to CO2 and the use of intermittent-flow respirometry rather than flow-through respirometry, there was no effect of elevated CO2 (1410 μatm) on the species (Birk et al., 2018). These results indicate a range of possible effects of elevated CO2 on the respiratory capacity of cephalopods that may be dependent on species and life stage. However, it also appears that prolonged exposure to elevated CO2 and using appropriate respirometry techniques may be important in establishing the physiological effects of rising ocean CO2 levels on cephalopods.
In this study, we tested the effects of projected future CO2 levels on the respiratory performance of two tropical cephalopod species. The two-toned pygmy squid (Idiosepius pygmaeus) has an average body length of < 20 mm and inhabits shallow coastal waters from northern Australia to the South China Sea (Moynihan, 1983; Semmens et al., 1995). This species has a unique adhesive gland on the mantle, allowing it to attach to seagrass or flotsam where it can rest for extended periods (von Byern and Klepal, 2006). These seagrass habitats in which I. pygmaeus can be found have the potential for diel fluctuations in CO2 concentrations between ~ 80 and 700 μatm (Chou et al., 2018), indicating that the species may be able to tolerate periods of elevated CO2 conditions. The second species, the bigfin reef squid, is a larger and much more active species, found in tropical waters of up to 100 m, and individuals are often found feeding in coral reef habitats at night (Norman, 2003). These two species, while both commonly called `squid’, are in fact from two separate taxonomic orders. The bigfin reef squid is a true squid of the order Teuthida, whereas the pygmy squid is in the order Idiosepiida, which is more closely related to cuttlefish (Sepiida). The two species were subjected to a current-day control (396–440 μatm) or a projected future CO2 level (997–1039 μatm) for 18 (pygmy squid) or 75 (bigfin reef squid) days. Pygmy squid and bigfin reef squid live for ~90 and 210 days, respectively; therefore, the treatment period was ~20 and 36% of the total lifespan of each species. We hypothesized that elevated CO2 would reduce ṀO2Max and aerobic scope in both cephalopod species, possibly due to the pH sensitivity of blood oxygen binding in some active squids (Bridges, 1995). To test this, we measured ṀO2Max and ṀO2Routine via intermittent-flow respirometry and then calculated aerobic scope (ṀO2Max—ṀO2Routine) in both the pygmy squid and bigfin reef squid after prolonged exposure to global change relevant levels of elevated CO2.
Materials and methods
CO2 treatment systems
Experiments were conducted using 8000 l recirculating seawater systems at James Cook University’s research aquarium in Townsville, Australia. CO2 levels were set at (i) a current-day control (I. pygmaeus, 396 μatm; S. lessoniana, 440 μatm) and (ii) an upper end-of-century projection following RCP8.5 (elevated CO2: I. pygmaeus, 1039 μatm; S. lessoniana, 997 μatm) (Collins et al., 2013). A pH control system (AT Control; Aqua Medic, Germany) dosed CO2 into 3000 l sumps to achieve the desired pH level for each CO2 treatment. pH on the National Bureau of Standards (NBS) scale (pHNBS) was measured daily (Seven2Go Pro; Mettler Toledo, Switzerland), and dosing set points were adjusted as necessary to maintain the target pCO2 in each treatment. Equilibrated seawater from each system was delivered at a rate of 1.5 l min−1 to tanks containing squid. Temperature was measured daily in each tank (Comark C26; Norfolk, UK).
Water samples were taken weekly to determine pH on the total scale (pHT) by spectrophotometry (UVmini-1240; Shimadzu, Suzhou Instruments Co. Ltd, Kyoto, Japan) using m-cresol purple as an indicator dye (Dickson and Millero, 1987; Dickson et al., 2007). Comparison of pHNBS and pHT in the weekly sample were used to estimate daily pHT values. Total alkalinity was estimated weekly by Gran Titration (888 Titrando; Metrohm AG, Switzerland) ensuring titration calibrations remained within 1% of certified reference material from Dr A.G. Dickson (Scripps Institution of Oceanography, batch #135). Salinity was measured weekly using a conductivity sensor (HQ15d; Hach, Loveland, CO, USA). Carbonate chemistry parameters (Table 1) were calculated in CO2SYS (Pierrot et al., 2006) using the constants K1 and K2 from Mehrbach et al. (1973) refit by Dickson and Millero (1987) and Dickson et al. (2007) for KHSO4.
Table 1.
Mean seawater data (± SD) for each species; total alkalinity and salinity values are from weekly measurements
| Species | CO2 treatment | Temperature (°C) | Salinity | pH(T) | Total alkalinity (μmol/kg SW) | pCO2 (μatm) |
|---|---|---|---|---|---|---|
| I. pygmaeus | Control | 28.1 (±0.3) | 36.7 (±1.1) | 8.05 (±0.07) | 2373 (±55) | 396 (±76) |
| Elevated | 28.1 (±0.4) | 36.4 (±0.9) | 7.67 (±0.05) | 2228 (±63) | 1039 (±118) | |
| S. lessoniana | Control | 28.2 (±0.4) | 36.3 (±0.4) | 7.99 (±0.05) | 2229 (±67) | 440(±60) |
| Elevated | 28.5 (±0.4) | 36.0 (±0.7) | 7.69 (±0.04) | 2212 (±130) | 997 (±110) |
Experimental animals
Two-toned pygmy squid (wet mass, 0.25 ± 0.09 g; mantle length, 11.2 ± 1.7 mm; means ± SD) were collected by dip net (500 μm mesh) in March 2017 from Cleveland Bay in Townsville, Queensland, Australia (19°24′S, 146°82′E) and immediately transported to James Cook University, Townsville. Squid were maintained in round tanks (47Ø × 51H cm) filled with seawater to 67 l, at a maximum of five individuals per tank. Animals were provided with PVC pipe structures in the tanks as shelter. Animals were maintained at control conditions for 24 hours in holding tanks before being transferred to separate tanks of the same size that received a continuous flow of either control or elevated CO2 treatment water. Glass shrimp (Acetes sibogae australis) were provided ad libitum to squid every morning. Squid were observed regularly feeding throughout the day, but food was withheld for 24 hours prior to experimentation to ensure a post-absorptive state that would maximize energy available for performance (Niimi and Beamish, 1974). Pygmy squid remained in either control (n = 8) or elevated CO2 (n = 10) treatment for 18 days before respirometry trials. A treatment duration of 18 days was chosen for pygmy squid because their brief lifespans mean that mature animals could only be expected to live a maximum of 30 (females) to 45 (males) days post-capture (Jackson, 1988). This treatment duration represents ~20% of the total pygmy squid lifespan.
Bigfin reef squid (wet mass, 181.2 ± 39.9 g; mantle length, 148.7 ± 13.7 mm; means ± SD) were collected in June 2016 from the Townsville breakwater, Queensland, Australia. Animals were captured at night with a 2.5 cm mesh, round frame dip net and transported immediately to James Cook University, Townsville. Squid were kept individually in round tanks (47Ø × 51H cm) filled to 67 l. Individuals were kept at control conditions for 21 days before they were transferred to separate tanks of the same size that received a continuous flow of either control or elevated CO2 treatment water. Bigfin reef squid were fed a variety of live food, including locally caught estuary glassfish (Ambassis marianus), juvenile flathead grey mullet (Mugil cephalus), as well as spiny chromis damselfish (Acanthochromis polyacanthus), twice daily. Feeder fish were maintained under control CO2 conditions prior to being offered to the squid. Bigfin reef squid remained in either control (n = 9) or elevated CO2 (n = 7) treatment for 75 days before their respirometry trials. In comparison to the pygmy squid, we chose a longer treatment duration for the bigfin reef squid because of their greater longevity. This treatment duration represents ~35% of their average 208-day lifespan in the wild (Walsh et al., 2002).
Maximal and routine oxygen uptake measurements
Intermittent-flow respirometry (Clark et al., 2013) was used to determine both routine oxygen uptake (ṀO2Routine) and maximal oxygen uptake (ṀO2Max) for both cephalopod species. The ṀO2Max was established by using a standard exercise challenge immediately before placing the animal in the respirometry chamber. The use of a swim chamber would not have proved effective in determining ṀO2Max for either species. Pygmy squid tend to attach to the sides of the chamber with their unique adhesive mantle gland rather than swimming against the flow within a swimming chamber. Bigfin reef squid can unpredictably switch locomotory modes from fin undulations to jet propulsion, which can result in self-injury if they propel themselves against the chamber while swimming actively. Therefore, to achieve ṀO2Max for pygmy squid, animals were chased with a dip net in a small circular tank for 3 minutes, followed by a 15 second air exposure period (Roche et al., 2013; Rummer et al., 2016) immediately prior to introduction to the respirometry chamber. Pygmy squid (all individuals) were unable to continue jet escaping the dip net before the end of the 3-minute period due to exhaustion. The number of jets and ink discharges from each animal during the chase period were recorded. For the bigfin reef squid, however, due to potential injury reasons mentioned above, a different method was used to elicit ṀO2Max. Instead, bigfin reef squid were held in a large dip net and periodically lifted in and out of the water (10 seconds in/5 seconds out) for 3 minutes. On re-immersions into the water, squid would attempt to jet escape 0–4 times within the safety of the net. All squid ceased jetting before the end of the 3 minutes of periodic emersions. Bigfin reef squid were then subjected to a further 30-second air exposure period before being placed into respirometry chambers. The number of jets and ink discharges were also recorded.
The measurement period for intermittent-flow respirometry (time during which the flush pump was off) was determined as the minimum time required to ensure a steady slope representing the decline in O2 concentration of the chamber down to 75–80% air saturation over time (O2 uptake rate of the squid). The flush period (time during which the flush pump was on) was sufficient time for the O2 concentration of the chambers to be sufficiently replenished back to ~ 100%. Pygmy squid were tested in 20 ml chambers submerged in an aquarium with continuous delivery of water from their CO2 treatment system, with both flushing and recirculation pumps submerged and providing flow at 21.6 l h−1. Preliminary experiments determined that ṀO2Routine of pygmy squid was reached in under 2 hours, so total trial time was set at 4 hours (Fig. S1). The measurement period was set at 150 seconds followed by a 60-second flushing period. Bigfin reef squid were tested in 6840 ml chambers also submerged in continuously replenished water from the CO2 treatment system of the squid being tested. The flush and recirculation pumps for these chambers delivered water at 400 l h−1. Measurement periods for bigfin reef squid lasted 85 seconds, followed by a 300-second flush period; this cycle continued for a total 22-hour trial period. The squid to chamber volume ratio was between 1:20 and 1:50 for all animals and the O2 concentration did not fall below 80% air saturation during measurement periods in any of the chambers for either species (Svendsen et al., 2016).
Temperature-compensated O2 concentration was continuously recorded (0.5 Hz) using oxygen-sensitive REDFLASH dye on contactless spots (2 mm) adhered to the inside of a cut glass pipette tube set within the recirculation pump loop and linked to a Firesting Optical Oxygen Meter (Pyro Science e.K., Aachen, Germany) via fibre-optic cables. Data were analysed in LabChart version 8.1.3 (ADInstruments, Colorado Springs, CO, USA), and ṀO2 (in milligrammes O2 per kilogramme of animal per hour) was calculated as the slope of the linear regression of oxygen concentration decline over time during the measurement period using the following equation:
 |
where S is the slope (in milligrammes of O2 per litre per second), Vresp is the volume of the respirometer minus the volume of the squid (in litres) and M is the mass of the squid (in kilogrammes). The volume of respirometry chambers included the volume of the chamber as well as that of the recirculation tubing and pump. The value of ṀO2Routine was calculated by taking the average of the lowest 10% of ṀO2, minus the background O2 uptake, which was measured before and after each trial (assumed linear) (Rummer et al., 2016). The ṀO2Max was calculated by isolating the first five slopes into segments (each segment being 20% of the total measurement period) and selecting the highest rate of change found therein and ensuring that the R2 of slopes was above 0.95. Aerobic scope for each individual was calculated by subtracting the ṀO2Routine value from the ṀO2Max value. Recovery time was defined as the amount of time, from introduction to the chamber, for ṀO2 to first reach an equal or lesser value of the ṀO2Routine value for that individual. To restrict background respiration to <5% of a squid’s ṀO2Routine, chambers and pumps were rinsed with fresh water and 10% bleach solution after each trial and left to dry for 12 hours before being used again.
Statistical analyses
Generalized linear mixed models with Gaussian distributions were used to compare response variables (ṀO2Routine, ṀO2Max, aerobic scope and recovery time) for pygmy squid between CO2 treatments, with the number of jets and number of inks included as fixed factors and holding tank included as a random effect. Linear models with log-transformed data were used to compare the same response variables of bigfin reef squid between CO2 treatments, with number of jets and inks included as fixed factors. A tank effect was not applicable for bigfin reef squid as they were always housed individually. A linear model with square root transformed data tested for differences in recovery times between the two squid species.
Statistical analyses were performed with R statistical software (R Development Core Team, 2018). Residual analysis indicated that data met the assumptions of normality and homogeneity of variance. Power analyses were performed to determine the probability of finding a significant difference in aerobic scope given the sample size and effect size.
Results
Pygmy squid
Elevated CO2 did not affect any of the traits measured for pygmy squid. Pygmy squid had a mean average ṀO2Max of 1164 ± 57 mg kg−1 h−1 (mean ± SE) under control and 1117 ± 35 mg kg−1 h−1 under elevated CO2 (x2 = 0.112, df = 14, P = 0.738) conditions. The ṀO2Routine was 341 ± 33 mg kg−1 h−1 under control and 418 ± 47 mg kg−1 h−1 under elevated CO2 and was not significantly different between treatments (x2 = 2.667, df = 14, P = 0.102) (Fig. 1A). The aerobic scope of pygmy squid was similar between CO2 treatments, with an average of 746 ± 52 mg kg−1 h−1 at control compared to 776 ± 49 mg kg−1 h−1 under elevated CO2 (x2 = 0.929, df = 14, P = 0.335) (Fig. 2A). Recovery time of pygmy squid under both control and elevated CO2 conditions lasted for just under 1 hour, averaging 55 minutes and 12 seconds (±10 minutes and 42 seconds) under control CO2 and 53 minutes and 9 seconds (±11 minutes and 48 seconds) under elevated CO2 conditions (x2 = 0.006, df = 14, P = 0.936) (Fig. 3A). A power analysis revealed a power of 0.067 on the comparisons of aerobic scope in pygmy squid between CO2 treatments.
Figure 1.
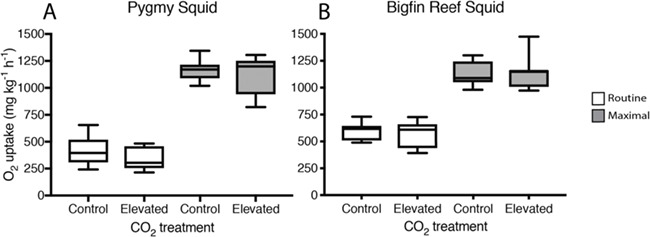
Routine (white boxes) and maximal oxygen uptake (grey boxes) of pygmy squid (A) and bigfin reef squid (B) from current day control and elevated CO2 treatments; boxplots show the median and interquartile range and the minimum and maximum range of the data.
Figure 2.
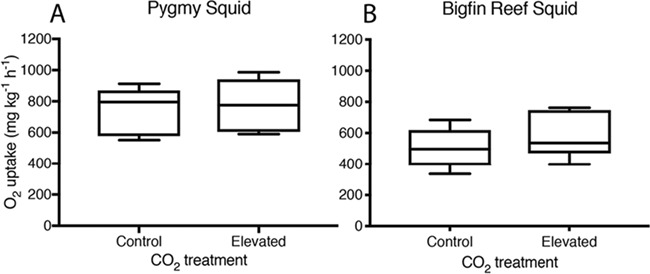
Absolute aerobic scope of pygmy squid (A) and bigfin reef squid (B) from current day control and elevated CO2 treatments; boxplots show the median and interquartile range and the minimum and maximum range of the data.
Figure 3.
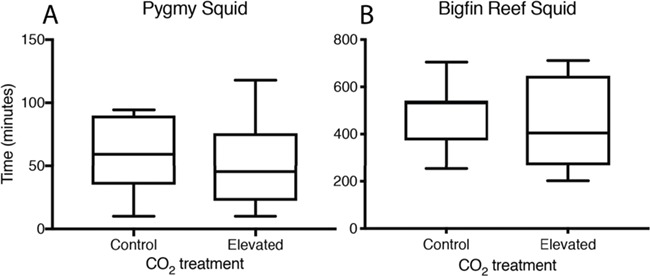
Recovery time that pygmy squid (A) and bigfin reef squid (B) required to reach a stable routine oxygen uptake rate following exhaustive exercise at current-day control and elevated CO2 treatment levels; boxplots show the median and interquartile range and the minimum and maximum range of the data (Note: the y-axis for pygmy squid ranges from 0–150 minutes while the y-axis for bigfin reef squid ranges from 0–800 minutes).
Bigfin reef squid
As observed in pygmy squid, elevated CO2 did not affect any of the traits measured for bigfin reef squid. The average ṀO2Max of bigfin reef squid under both control and elevated CO2 treatment levels were very similar at 1133 ± 36 mg kg−1 h−1 and 1139 ± 63 mg kg−1 h−1, respectively (x2 = 0.011, df = 14, P = 0.918). Average ṀO2Routine measurements between treatments were also similar at 596 ± 27 mg kg−1 h−1 in the control and 565 ± 46 mg kg−1 h−1 in elevated CO2 (x2 = 0.588, df = 14, P = 0.443) (Fig. 1B). The aerobic scope of bigfin reef squid averaged 509 ± 41 mg kg−1 h−1 under control and 574 ± 53 mg kg−1 h−1 under elevated CO2 conditions (x2 = 1.083, df = 14, P = 0.298) (Fig. 2B). Recovery time in bigfin reef squid was very similar between treatments, lasting an average of 8 hours and 8 minutes (±47 minutes) under control and 7 hours and 43 minutes (±1 hour and 13 minutes) under elevated CO2 conditions (x2 = 0.144, df = 14, P = 0.704) (Fig. 3B). The individual with the lowest aerobic scope (342 mg kg−1 h−1) also performed the fewest number of jets during the exercise protocol (11 jets). It is possible this individual, from the control treatment, did not achieve a true ṀO2Max resulting in the lowest aerobic scope. The recovery time of bigfin reef squid was significantly longer than that of pygmy squid by an average of 7 hours (x2 = 113.080, df = 31, P < 0.001). A power analysis revealed a power of 0.146 on the comparisons of aerobic scope in bigfin reef squid between CO2 treatments.
Discussion
After extended exposure to elevated CO2 levels, we found no significant changes to any measures of oxygen consumption in either the two-toned pygmy squid (I. pygmaeus) or the bigfin reef squid (S. lessoniana) when compared with current-day control CO2 conditions. The responses observed here under elevated CO2 differ from the reduction in ṀO2Max and ṀO2Routine observed in the jumbo squid (Rosa and Seibel, 2008) and the decrease in oxygen uptake rates observed in the common cuttlefish and European squid during late-stage embryo incubation (Rosa et al., 2014; Sigwart et al., 2016). However, these results are consistent with those of juvenile common cuttlefish (Gutowska et al., 2008) and experiments by Hu et al. (2014) in which bigfin reef squid showed no changes in ṀO2Routine under CO2 levels of 1585 μatm after a 7 day exposure period. We predicted that elevated CO2 would interfere with oxygen extraction causing a decrease in the ṀO2Max, reducing aerobic scope. However, the recent estimation that CO2 levels of ~ 1000 μatm would cause a drop in squid hemocyanin-O2 saturation by no more than 1.6% (Birk et al., 2018) suggests that squid may be able to cope with elevated CO2 without costs to their oxygen uptake capabilities. Our results indicate that the respiratory physiology of the two species of tropical cephalopod studied here are likely to be resilient to realistic future CO2 levels in the habitats they currently inhabit.
Based on our results and from studies previously conducted on other cephalopod species, it appears that elevated CO2 elicits a range of aerobic responses in cephalopods, which may be life stage dependent. The reduced oxygen uptake observed during the embryonic period in some cephalopods at elevated CO2 (Rosa et al., 2014; Sigwart et al., 2016) might be expected, as acid–base regulatory mechanisms in cephalopods often remain rudimentary until respiration switches from cutaneous (via skin) to branchial (via gills) (Hu et al., 2011b). Although little is known about the acid–base regulatory capabilities of pygmy squid, those of bigfin reef squid have been thoroughly investigated. Bigfin reef squid, among other cephalopods, have evolved ion regulatory epithelia in both the gills (Hu et al., 2011a, 2014) and skin cells (Hu et al., 2011b, 2013), which are effective in coping with acid-base disturbances.
Acid–base regulatory abilities are an indispensable trait in cephalopods, as well as in all animals, as there is a continuous natural confrontation with respiratory CO2 that can cause extra- and intra-cellular pH disturbances (Robertson, 1949; Hu et al., 2013). Some cephalopods have been shown to have advanced acid–base regulatory machinery, comparable to that of fishes, and can effectively regulate their acid–base balance at high levels of CO2 without compromising aerobic capacities (Gutowska et al., 2008, 2010). It appears that this may also be the case for both pygmy squid and bigfin reef squid, as ṀO2 remains unchanged at CO2 levels (~1000 μatm) projected for the end of the century under the business as usual CO2 emissions scenario. There could be changes in the allocation of resources at elevated CO2, such as towards acid–base regulation, but this does not appear to affect the aerobic performance of squids. However, there may still be energetic costs at much higher CO2 levels, because the extreme CO2 treatment (4134 μatm) used by Hu et al. (2014) resulted in a 40% reduction in ṀO2Routine in bigfin reef squid.
The recovery times of pygmy squid and bigfin reef squid observed under control CO2 conditions were noticeably different between species. While pygmy squid recovered in an average recovery time of less than 1 hour, bigfin reef squid took an average of ~8 hours to return to their ṀO2Routine. During trials, all pygmy squid were observed to use the adhesive gland on their mantle to remain attached to the wall of the respirometry chamber throughout the duration of the measurement period. In contrast, bigfin reef squid lack this gland and maintained a suspended position by the use of their undulating fins throughout the trials. This unique mechanism in pygmy squid grants the species a much greater capacity for rest than in the continuously swimming bigfin reef squid. This may help to explain why pygmy squid, under control conditions, overcame excess post-exercise oxygen consumption more rapidly than bigfin reef squid. Furthermore, the ṀO2Routine values measured for pygmy squid are likely closer to true standard metabolic rates, i.e. maintenance costs, than those of bigfin reef squid due to their mode of life.
Most squid are negatively buoyant, and the requirements of being `at rest’ while remaining suspended in the water column still have considerable aerobic costs (Bartol et al., 2001). As bigfin reef squid recover from exercise, they remain relatively active in order to remain suspended in the water column. The species has large fins that run the full length of the mantle that can be used to maintain neutral buoyancy without the use of jetting. This allows them to spend, perhaps, a smaller fraction of their energy budget to maintain neutral buoyancy when compared to other squid species with proportionally much smaller fins, requiring fin use to be coupled with jetting (Hu et al. 2014). While this decoupled option of swimming with fin undulations alone in bigfin reef squid is more efficient than in more powerfully swimming pelagic squid species, pygmy squid can attach to a piece of seagrass or other benthic structure where they may truly rest, thus avoiding spending extra energy during recovery. This mode of rest could also be very beneficial to pygmy squid because lower mantle ventilation pressures in squid, such as those during rest, as opposed to those during active swimming, lead to higher oxygen extraction rates (Melzner et al. 2006).
It is worth noting that the average values of ṀO2Routine values in bigfin reef squid under control CO2 levels observed by Hu et al. (2014) were markedly higher, by ~70%, than those observed here. The ṀO2Routine values in this experiment were determined during a 22-hour trial period, whereas the previous experiment determined ṀO2Routine during a 20–30 minute measurement period. The results from this experiment indicate that bigfin reef squid experience excess post-exercise oxygen consumption for ~8 hours after exhaustive exercise. While Hu et al. (2014) did not exercise the squid in their experiments, it is likely that a measurement period of 20–30 minutes may not have allowed for a true ṀO2Routine measurement due to the handling stress and introduction to the respirometry chamber (Keys, 1930; Svendsen et al., 2018). Nevertheless, considering all animals were handled and introduced to the chambers in the same way, the comparisons among CO2 treatments from the previous experiment are still useful. Furthermore, there were comparable results upon exposure to similar elevated CO2 levels, causing unaltered ṀO2 in both the former experiments and in those that were performed here.
In this study, we used a relatively prolonged exposure to elevated CO2 (>20% of the animals lifespan) along with intermittent-flow respirometry to determine the effects of elevated CO2 on cephalopod ṀO2. In juvenile jumbo squid, D. gigas, elevated CO2 levels (estimated at ~ 1000 μatm) suppressed ṀO2Max by ~ 30% and ṀO2Routine by ~ 20% (Rosa and Seibel, 2008). However, with a longer acclimation to CO2 and the use of intermittent-flow respirometry rather than flow-through respirometry, there was no effect of elevated CO2 (1410 μatm) on this species (Birk et al., 2018). Furthermore, Hu et al. (2014) found different effects of elevated CO2 on S. lessoniana depending on the length of exposure. This suggests that future studies should use exposure times that are long enough for individuals to overcome any short-term effects of elevated CO2 as well as consider intermittent-flow respirometry methods (e.g. Steffensen, 1989). Future studies should also consider additional environmental changes, such as elevated temperature, which could potentially interact with elevated CO2 to affect oxygen consumption in unexpected ways. Multifactorial experiments will be important to gain a more complete understanding of the effects of climate change and ocean acidification on cephalopod physiology. Furthermore, power analyses revealed that the sample size of this study was low considering the variation among individuals. A larger sample size would be needed to investigate more subtle effects of elevated CO2 that may not have been detected in this study.
Our findings contribute to increasing evidence suggesting a level of tolerance to elevated CO2 in adult cephalopods, both among species and among the traits being tested. It has been suggested that the active, high-energetic lifestyle, along with occurrences of natural hypercapnia during the course of embryonic development, constitutes factors that pre-adapt cephalopods to cope with elevated CO2 levels (Melzner et al., 2009b). While elevated CO2 has been shown to illicit negative physiological responses in some cephalopod species (e.g. Kaplan et al., 2013; Sigwart et al., 2016), other studies have observed no adverse effects of elevated CO2 on the same traits in other species (e.g. Gutowska et al., 2010; Birk et al., 2018). Physiological stress from elevated CO2 during the early ontogeny of animals has been described as the `true bottleneck’ through which species must pass in order to successfully tolerate future elevated CO2 oceans, even for species that demonstrate tolerance in other traits (Melzner et al., 2009b). Therefore, it will be important for future studies to investigate the effects of elevated CO2 on cephalopods during their embryonic and paralarval development, especially in species that show no adverse effects of elevated CO2 in other physiological traits as adults, such as those studied here.
Conclusions
This study shows that ṀO2Max, ṀO2Routine, aerobic scope and recovery time of two tropical cephalopod species are unaltered following prolonged exposure to elevated CO2. In warmer tropical latitudes, where the energy requirements of cephalopods are higher, altered aerobic performance could be particularly consequential. However, it appears that CO2 levels projected for the end of this century will not adversely affect the respiratory performance of either the two-toned pygmy squid or bigfin reef squid. The unaltered aerobic performance of these ecologically distinct cephalopod species, from separate taxonomic orders, after prolonged exposure to elevated CO2 indicates that a wide range of cephalopod species may have the aerobic capacity to cope with an increasingly CO2-rich ocean. However, as some previous studies have observed negative effects of elevated CO2 on respiratory performance of some cephalopod species, it will be important to understand the potentially species-specific and life stage-specific effects, which can have critical implications for the structure of marine ecosystems in the future.
Supplementary Material
Acknowledgements
This study followed animal ethics guidelines at James Cook University (JCU Animal Ethics Number: A2189). Collection permits from the Queensland Department of Agriculture, Fisheries and Forestry were obtained to collect all species used in this study (Permit Number: 170251). The authors thank the technical staff at James Cook University Marine and Aquaculture Facilities Unit (Ben Lawes, Andrew Thompson and Simon Wever) for logistical support and assistance. Thanks to Shannon McMahon and Donald Warren for help with animal capture as well as the Munday Lab group for general help and advice. The assistance of Erin Weir was also greatly appreciated during this study.
Authors’ contributions
All authors contributed towards writing the manuscript. B.L.S., S.-A.W. and T.J.N. designed the experiments. B.L.S. conducted the experiments, maintained experimental facilities and animals and conducted the carbonate chemistry analysis. B.L.S. analysed and interpreted the data. All authors have read and approved of the final manuscript.
Funding
This work was supported by funding from the Australian Research Council (ARC) (P.L.M.); the ARC Centre of Excellence for Coral Reef Studies (P.L.M. and S.-A.W.); and the PADI Foundation (21445 to B.L.S.).
References
- Bartol IK, Mann R, Patterson MR (2001) Aerobic respiratory costs of swimming in the negatively buoyant brief squid Lolliguncula brevis. J Exp Biol 204: 3639–3653. [DOI] [PubMed] [Google Scholar]
- Beniash E, Ivanina A, Lieb NS, Kurochkin I, Sokolova IM (2010) Elevated level of carbon dioxide affects metabolism and shell formation in oysters Crassostrea virginica. Mar Ecol Prog Ser 419: 95–108. [Google Scholar]
- Birk MA, McLean EL, Seibel BA (2018) Ocean acidification does not limit squid metabolism via blood oxygen supply. J Exp Biol 221: jeb187443. [DOI] [PubMed] [Google Scholar]
- Bridges CR. (1995) Bohr and root effects in cephalopod haemocyanins—paradox or pressure in Sepia officinalis? Mar Freshw Behav Physiol 25: 121–130. [Google Scholar]
- Cattano C, Claudet J, Domenici P, Milazzo M (2018) Living in a high CO2 world: a global meta-analysis shows multiple trait-mediated fish responses to ocean acidification. Ecol Monogr 88: 320–335. [Google Scholar]
- Chou W-C, Chu H-C, Chen Y-H, Syu R-W, Hung C-C, Soong K (2018) Short-term variability of carbon chemistry in two contrasting seagrass meadows at Dongsha Island: implications for pH buffering and CO2 sequestration. Estuar Coast Mar Sci 210: 36–44. [Google Scholar]
- Clark TD, Sandblom E, Jutfelt F (2013) Aerobic scope measurements of fishes in an era of climate change: respirometry, relevance and recommendations. J Exp Biol 216: 2771–2782. [DOI] [PubMed] [Google Scholar]
- Clements JC, Hunt HL (2015) Marine animal behaviour in a high CO2 ocean. Mar Ecol Prog Ser 536: 259–279. [Google Scholar]
- Collins M, Knutti R, Arblaster J, Dufresne J-L, Fichefet T, Friedlingstein P, Gao X, Gutowski WJ, Johns T, Krinner G et al. (2013) Long-term climate change: projections, commitments and irreversibility. In Stocker TF, Qin D, Plattner G-K, Tignor M, Allen SK, Boschung J, Nauels A, Xia Y, Bex V, Midgley PM, eds, Climate Change 2013: The Physical Science Basis. Working Group I Contribution to the Fifth Assessment Report of the Intergovernmental Panel on Climate Change. Cambridge University Press, Cambridge: and New York, pp 1029–1136. [Google Scholar]
- Couturier CS, Stecyk JAW, Rummer JL, Munday PL, Nilsson GE (2013) Species-specific effects of near-future CO2 on the respiratory performance of two tropical prey fish and their predator. Comp Biochem Physiol A Mol Integr Physiol 166: 482–489. [DOI] [PMC free article] [PubMed] [Google Scholar]
- Cummings V, et al. (2011) Ocean acidification at high latitudes: potential effects on functioning of the antarctic bivalve Laternula elliptica. PLoS One 6: e16069. [DOI] [PMC free article] [PubMed] [Google Scholar]
- Dickson AG, Millero FJ (1987) A comparison of the equilibrium constants for the dissociation of carbonic acid in seawater media. Deep Sea Res A 34: 1733–1743. [Google Scholar]
- Dickson AG, Sabine CL, Christian JR (2007) Guide to Best Practices for Ocean CO2 Measurements In Vol Vol 3 North Pacific Marine Science Organization, Sidney, p. 191. [Google Scholar]
- Dlugokencky E, Tans P (2018) Trends in atmospheric carbon dioxide. Retrieved from NOAA/ESRL http://www.esrl.noaa.gov/gmd/ccgg/trends/global.html.
- Doney SC. (2010) The growing human footprint on coastal and open-ocean biogeochemistry. Science 328: 1512–1516. [DOI] [PubMed] [Google Scholar]
- Doney SC, Balch W, Fabry V, Feely R (2009) Ocean acidification: a critical emerging problem for the ocean sciences. Oceanography 22: 16–25. [Google Scholar]
- Doney SC, Schimel DS (2007) Carbon and climate system coupling on timescales from the Precambrian to the Anthropocene. Annu Rev Environ Resour 32: 31–66. [Google Scholar]
- Eliason EJ, Clark TD, Hague MJ, Hanson LM, Gallagher ZS, Jeffries KM, Gale MK, Patterson DA, Hinch SG, Farrell AP (2008) Differences in thermal tolerance among sockeye salmon populations. Science 1861: 1–4. [DOI] [PubMed] [Google Scholar]
- Fabry V, Seibel BA, Feely RA, Orr J (2008) Impacts of ocean acidification on marine fauna and ecosystem processes. ICES J Mar Sci 65: 414–432. [Google Scholar]
- Fernández-Reiriz MJ, Range P, Álvarez-Salgado XA, Labarta U (2011) Physiological energetics of juvenile clams Ruditapes decussatus in a high CO2 coastal ocean. Mar Ecol Prog Ser 433: 97–105. [Google Scholar]
- Fry FEJ, Hart JS (1948) The relation of temperature to oxygen consumption in the goldfish. Biol Bull 94: 66–77. [PubMed] [Google Scholar]
- Gutowska MA, Melzner F, Langenbuch M, Bock C, Claireaux G, Pörtner HO (2010) Acid-base regulatory ability of the cephalopod (Sepia officinalis) in response to environmental hypercapnia. J Comp Physiol B 180: 323–335. [DOI] [PubMed] [Google Scholar]
- Gutowska MA, Pörtner HO, Melzner F (2008) Growth and calcification in the cephalopod Sepia officinalis under elevated seawater pCO2. Mar Ecol Prog Ser 373: 303–309. [Google Scholar]
- Hanlon RT, Messenger JB (1996) Cephalopod Behaviour. Cambridge University Press, New York [Google Scholar]
- Hannan KD, Rummer JL (2018) Aquatic acidification: a mechanism underpinning maintained oxygen transport and performance in fish experiencing elevated carbon dioxide conditions. J Exp Biol 221: jeb154559. [DOI] [PubMed] [Google Scholar]
- Hoegh-Guldberg O, et al. (2007) Coral reefs under rapid climate change and ocean acidification. Science 318: 1737–1742. [DOI] [PubMed] [Google Scholar]
- Hu MY, Guh Y, Stumpp M, Lee J, Chen R, Sung P, Chen Y (2014) Branchial NH4+-dependent acid–base transport mechanisms and energy metabolism of squid (Sepioteuthis lessoniana) affected by seawater acidification. Front Zool 11: 55. [Google Scholar]
- Hu MY, Lee JR, Lin LY, Shih TH, Stumpp M, Lee MF, Hwang PP, Tseng YC (2013) Development in a naturally acidified environment: Na+/H+-exchanger 3-based proton secretion leads to CO2 tolerance in cephalopod embryos. Front Zool 10: 51. [DOI] [PMC free article] [PubMed] [Google Scholar]
- Hu MY, Tseng Y-C, Stumpp M, Gutowska MA, Kiko R, Lucassen M, Melzner F (2011a) Elevated seawater PCO2 differentially affects branchial acid-base transporters over the course of development in the cephalopod Sepia officinalis. Am J Physiol Regul Integr Comp Physiol 300: R1100–R1114. [DOI] [PubMed] [Google Scholar]
- Hu MY, Tseng Y, Lin L, Chen P, Charmantier-daures M, Hwang P, Melzner F (2011b) New insights into ion regulation of cephalopod molluscs: a role of epidermal ionocytes in acid-base regulation during embryogenesis. Am J Physiol Regul Inter Comp Physiol 301: R1700–R1709. [DOI] [PubMed] [Google Scholar]
- Jackson GD. (1988) The use of statolith microstructures to analyse life-history events in the small tropical cephalopod Idiosepius pygmaeus. Fish Bull 87: 265–272. [Google Scholar]
- Kaplan MB, Mooney TA, McCorkle DC, Cohen AL (2013) Adverse effects of ocean acidification on early development of squid (Doryteuthis pealeii). PLoS One 8: e63714. [DOI] [PMC free article] [PubMed] [Google Scholar]
- Keys AB. (1930) The measurement of the respiratory exchange of aquatic animals. Biol Bull 59: 187–188. [Google Scholar]
- Kroeker KJ, Kordas RL, Crim R, Hendriks IE, Ramajo L, Singh GS, Duarte CM, Gattuso JP (2013) Impacts of ocean acidification on marine organisms: quantifying sensitivities and interaction with warming. Glob Chang Biol 19: 1884–1896. [DOI] [PMC free article] [PubMed] [Google Scholar]
- Lefevre S. (2016) Are global warming and ocean acidification conspiring against marine ectotherms? A meta-analysis of the respiratory effects of elevated temperature, high CO2 and their interaction. Conserv Physiol 4: doi: 10.1093/conphys/cow009. [DOI] [PMC free article] [PubMed] [Google Scholar]
- Lefevre S, Watson S-A, Munday PL, Nilsson GE (2015) Will jumping snails prevail? Influence of near-future CO2, temperature and hypoxia on respiratory performance in the tropical conch Gibberulus gibberulus gibbosus. J Exp Biol 218: 2991–3001. [DOI] [PubMed] [Google Scholar]
- Lüthi D, et al. (2008) High-resolution carbon dioxide concentration record 650,000–800,000 years before present. Nature 453: 379–382. [DOI] [PubMed] [Google Scholar]
- McNeil BI, Sasse TP (2016) Future ocean hypercapnia driven by anthropogenic amplification of the natural CO2 cycle. Nature 529: 383–386. [DOI] [PubMed] [Google Scholar]
- Mehrbach C, Culberson CH, Hawley JE, Pytkowicz RN (1973) Measurement of the apparent dissociation constants of carbonic acid in seawater at atmospheric pressure. Limnol Oceanogr 18: 897–907. [Google Scholar]
- Melatunan S, Calosi P, Rundle SD, Moody AJ, Widdicombe S (2011) Exposure to elevated temperature and PCO2 reduces respiration rate and energy status in the periwinkle Littorina littorea. Physiol Biochem Zool 84: 583–594. [DOI] [PubMed] [Google Scholar]
- Melzner F, Bock C, Pörtner HO (2006) Temperature-dependent oxygen extraction from the ventilatory current and the costs of ventilation in the cephalopod Sepia officinalis. J Comp Physiol B 176: 607–621. [DOI] [PubMed] [Google Scholar]
- Melzner F, Göbel S, Langenbuch M, Gutowska MA, Pörtner HO, Lucassen M (2009a) Swimming performance in Atlantic Cod (Gadus morhua) following long-term (4–12 months) acclimation to elevated seawater PCO2. Aquat Toxicol 92: 30–37. [DOI] [PubMed] [Google Scholar]
- Melzner F, Gutowska MA, Langenbuch M, Dupont S, Lucassen M, Thorndyke MC, Bleich M (2009b) Physiological basis for high CO2 tolerance in marine ectothermic animals: pre-adaptation through lifestyle and ontogeny? Biogeosciences 6: 2313–2331. [Google Scholar]
- Moynihan M. (1983) Notes on the behavior of Idiosepius pygmaeus (Cephalopoda; Idioespiidae). Behaviour 85: 42–57. [Google Scholar]
- Munday PL, Crawley NE, Nilsson GE (2009) Interacting effects of elevated temperature and ocean acidification on the aerobic performance of coral reef fishes. Mar Ecol Prog Ser 388: 235–242. [Google Scholar]
- Navarro JM, Torres R, Acuña K, Duarte C, Manriquez PH, Lardies M, Lagos NA, Vargas C, Aguilera V (2013) Impact of medium-term exposure to elevated pCO2 levels on the physiological energetics of the mussel Mytilus chilensis. Chemosphere 90: 1242–1248. [DOI] [PubMed] [Google Scholar]
- Niimi AJ, Beamish FWH (1974) Bioenergetics and growth of largemouth bass (Micropterus salmoides) in relation to body weight and temperature. Can J Zool 52: 447–456. [DOI] [PubMed] [Google Scholar]
- Norman MD. (2003) Cephalopods: A World Guide. ConchBooks, Hackenheim. [Google Scholar]
- O’Dor RK. (1988a) Limitations on locomotor performance in squid. J Appl Physiol (1985) 64: 128–134. [DOI] [PubMed] [Google Scholar]
- O’Dor RK. (1988b) The forces acting on swimming squid. J Exp Biol 137: 421–442. [Google Scholar]
- O’Dor RK, Webber DM (1986) The constraints on cephalopods: why squid aren’t fish. Can J Zool 64: 1591–1605. [Google Scholar]
- Pierrot D, Lewis E, Wallace DWR (2006) MS Excel program developed for CO2 system calculations. (Oak Ridge, TN, USA, ORNL/CDIAC-105a: Carbon Dioxide Information Analysis Center) Oak Ridge National Laboratory, U.S. Department of Energy.
- Pörtner HO. (2002) Environmental and functional limits to muscular exercise and body size in marine invertebrate athletes. Comp Biochem Physiol A Mol Integr Physiol 133: 303–321. [DOI] [PubMed] [Google Scholar]
- Pörtner HO, Farrell AP (2008) Physiology and climate change. Science 322: 690–692. [DOI] [PubMed] [Google Scholar]
- Pörtner HO, Peck MA (2010) Climate change effects on fishes and fisheries: towards a cause-and-effect understanding. J Fish Biol 77: 1745–1779. [DOI] [PubMed] [Google Scholar]
- R Development Core Team (2018) R: a language and environment for statistical computing. Vienna, Austria http://www.R-project.org/.
- Robertson JD. (1949) Ionic regulation in some marine invertebrates. J Exp Biol 26: 182–200. [DOI] [PubMed] [Google Scholar]
- Roche DG, Binning SA, Bosiger Y, Johansen JL, Rummer JL (2013) Finding the best estimates of metabolic rates in a coral reef fish. J Exp Biol 216: 2103–2110. [DOI] [PubMed] [Google Scholar]
- Rosa R, Seibel BA (2008) Synergistic effects of climate-related variables suggest future physiological impairment in a top oceanic predator. Proc Natl Acad Sci U S A 105: 20776–20780. [DOI] [PMC free article] [PubMed] [Google Scholar]
- Rosa R, Trübenbach K, Pimentel MS, Boavida-Portugal J, Faleiro F, Baptista M, Dionísio G, Calado R, Pörtner HO, Repolho T (2014) Differential impacts of ocean acidification and warming on winter and summer progeny of a coastal squid (Loligo vulgaris). J Exp Biol 217: 518–525. [DOI] [PubMed] [Google Scholar]
- Rummer JL, Binning SA, Roche DG, Johansen JL (2016) Methods matter: considering locomotory mode and respirometry technique when estimating metabolic rates of fishes. Conserv Physiol 4: doi: 10.1093/conphys/cow008 . [DOI] [PMC free article] [PubMed] [Google Scholar]
- Rummer JL, Stecyk JAW, Couturier CS, Watson S-A, Nilsson GE, Munday PL (2013) Elevated CO2 enhances aerobic scope of a coral reef fish. Conserv Physiol 1: doi: 10.1093/conphys/cot023. [DOI] [PMC free article] [PubMed] [Google Scholar]
- Schalkhausser B, Bock C, Stemmer K, Brey T, Pörtner HO, Lannig G (2013) Impact of ocean acidification on escape performance of the king scallop, Pecten maximus, from Norway. Mar Biol 160: 1995–2006. [Google Scholar]
- Seibel BA. (2016) Cephalopod susceptibility to asphyxiation via ocean incalescence, deoxygenation, and acidification. Physiol 31: 418–429. [DOI] [PubMed] [Google Scholar]
- Semmens JM, Moltschaniwskyj NA, Alexander CG (1995) Effect of feeding on the structure of the digestive gland of the tropical sepioid Idiosepius pygmaeus. J Mar Biol Assoc UK 75: 885–897. [Google Scholar]
- Shadwick RE, Dor KO, Gosline JM (1990) Respiratory and cardiac function during exercise in squid. Can J Zool 68: 792–798. [Google Scholar]
- Sigwart JD, Lyons G, Fink A, Gutowska MA, Murray D, Melzner F, Houghton JDR, Hu MY (2016) Elevated pCO2 drives lower growth and yet increased calcification in the early life history of the cuttlefish Sepia officinalis (Mollusca: Cephalopoda). ICES J Mar Sci 73: 970–980. [Google Scholar]
- Steffensen JF. (1989) Some errors in respirometry of aquatic breathers: how to avoid and correct for them. Fish Physiol Biochem 6: 49–59. [DOI] [PubMed] [Google Scholar]
- Svendsen MBS, Bushnell PG, Steffensen JF (2016) Design and setup of intermittent-flow respirometry system for aquatic organisms. J Fish Biol 88: 26–50. [DOI] [PubMed] [Google Scholar]
- Svendsen MBS, Johansen JL, Bushnell PG, Skov PV, Norin T, Domenici P, Steffensen JF, Abe A (2018) Are all bony fishes oxygen regulators? Evidence for oxygen regulation in a putative oxygen conformer, the swamp eel Synbranchus marmoratus. J Fish Biol 94: 178–182. [DOI] [PubMed] [Google Scholar]
- von Byern J, Klepal W (2006) Adhesive mechanisms in cephalopods: a review. Biofouling 22: 329–338. [DOI] [PubMed] [Google Scholar]
- Walsh LS, Turk PE, Forsythe JW, Lee PG (2002) Mariculture of the loliginid squid Sepioteuthis lessoniana through seven successive generations. Aquaculture 212: 245–262. [Google Scholar]
- Watson S-A, Lefevre S, McCormick MI, Domenici P, Nilsson GE, Munday PL (2014) Marine mollusc predator-escape behaviour altered by near-future carbon dioxide levels. Proc Biol Sci 281: 1–8. [DOI] [PMC free article] [PubMed] [Google Scholar]
- Wells MJ, Hanlon RT, Lee PG, DiMarco FP (1988) Respiratory and cardiac performance in Lolliguncula brevis (Cephalopoda, Myopsida): the effects of activity, temperature and hypoxia. J Exp Biol 36: 17–36. [Google Scholar]
- Wenguang L, Maoxian H (2012) Effects of ocean acidification on the metabolic rates of three species of bivalve from southern coast of China. Chinese J Oceanol Limnol 30: 206–211. [Google Scholar]
Associated Data
This section collects any data citations, data availability statements, or supplementary materials included in this article.