Abstract
We describe a unique flow cytometer (TDI-SFC) for the immunophenotyping of low-abundance cells, particularly when cell counts are sample-limited and operationally difficult for analysis by fluorescence microscopy (>100 cells) or multiparameter flow cytometry (MFC, <10 000 cells). TDI-SFC combines the high spectral resolution of spectral flow cytometry (SFC) with a CCD operated in time-delayed integration (TDI) for improved duty cycle and sensitivity. Cells were focused with a 1D-sheathing microfluidic device, and fluorescence emission generated from a 488 nm laser was collected by epi-illumination and dispersed along one axis of a CCD by a spectrograph. Along the other axis, the CCD’s shift rate was clocked at a rate that closely matched the cells’ velocity through the field of view. This TDI-SFC format allowed the CCD shutter to remain open during signal acquisition, providing a duty cycle ~100% and assurance that ~95% cells were interrogated. We used fluorescent beads to optimize synchronization of TDI clocking with the sheathed-cell velocity and to improve sensitivity via the excitation intensity, epi-illumination numerical aperture, and integration time. TDI achieved integrated signals of 106 counts at a signal-to-noise ratio (SNR) of 610 for beads corresponding to a load of 4 × 10⁵ antibodies. We also evaluated multiplexing capabilities by spectral deconvolution and undertook a proof-of-concept application to immunophenotype low-abundance cells; the demonstration consisted of immunophenotyping a model cell line, in this case SUP-B15 cells representing B-cell acute lymphoblastic leukemia (B-ALL). The B-ALL cell line was stained against a leukemic marker (terminal deoxynucleotidyl transferase, TdT), and we successfully used spectral unmixing to discriminate TdT(+) cells from TdT(−) cells even at low cell counts (~100 cells). The TDI-SFC could potentially be used in any application requiring the immunophenotyping of low-abundance cells, such as in monitoring measurable residual disease in acute leukemias following affinity enrichment of circulating leukemia cells from peripheral blood.
Graphical Abstract
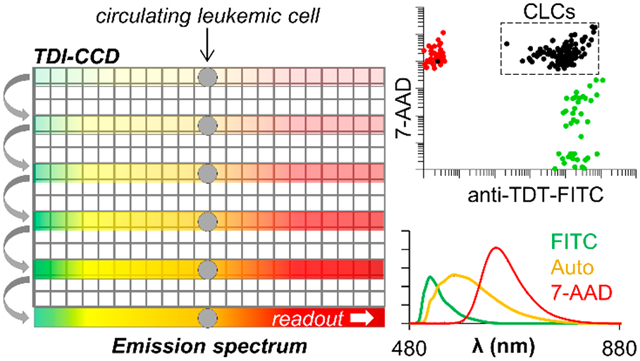
Multiparameter flow cytometry (MFC) is used to characterize biological cells for size, granularity, and protein expression as well as other cellular characteristics. MFCs typically use sheath flow to hydrodynamically align immunolabeled cells into a single-file line through excitation laser beams. Optical-bandpass filters spectrally sort fluorescence into relatively wide wavelength ranges (channels) that are transduced by photomultiplier tubes (PMTs). Modern MFCs can analyze 104 to 105 cells per second across several fluorescence channels and process large numbers of cells to identify unique subpopulations.1
MFC requires >10 000 cells to establish proper gating thresholds and compensate for channel cross-talk before identifying clusters of cells with similar fluorescence intensities. Thus, MFC is difficult to use for low-abundance-cell analyses when the total available cell count is sample-limited (<10 000) and a suitable matrix is unavailable for initial optimization. Further, the poor spectral resolution from the bandpass filters yields an inherent risk that biological “noise”, such as abnormal autofluorescence from apoptotic cells,2,3 can cause misclassification.1 Fluorescence microscopy obviates such misclassification by using morphological localization of fluorescence signatures but requires lengthy manual cell counting, limiting clinical throughput for samples with >100 cells. Imaging flow cytometers (IFCs), such as the ImageStream, can acquire high-resolution, multispectral images of flowing cells.4-7 However, IFCs are costly and routine clinical processing remains limited by semiautomated data analysis.
Herein, we detail an SFC technology that can analyze cells within a range of 100–10 000 cells/sample, which can be problematic for microscopy and MFC, and provides absolute quantitation of immunofluorescence and autofluorescence signatures. SFC shares the hydrodynamic-sheathing and laser-excitation strategy with MFC, but fluorescence is spectrally dispersed onto a multichannel detector. This yields higher spectral resolution (0.7 nm/pixel herein) that can be deconvoluted, enabling the use of multiple fluorophores with considerable spectral overlap while also discriminating contributions from autofluorescence.3,8-12 Commercial SFC instruments from Cytek (Aurora) and Sony (SP6800) are available with the highest resolution provided by Sony, where a series of prisms disperses fluorescence onto a 32-channel PMT array (500–800 nm, 9.4 nm resolution).3,9,13 Nolan’s lab pioneered the use of a diffraction-grating spectrograph and CCD with high resolution (0.4 nm/pixel),12 but this resolution was countered by the operating mode of the CCD (snapshot mode).10-12 The CCD’s duty cycle, the percent of time the sensor was actively imaging, was low (~0.1%) because of the short exposure times (~10 μs) and extended readout times (~10 ms).12 Thus, there is high probability that cells would not be detected while the shutter is closed, which can be problematic for applications requiring the analysis of low-abundance cells.14
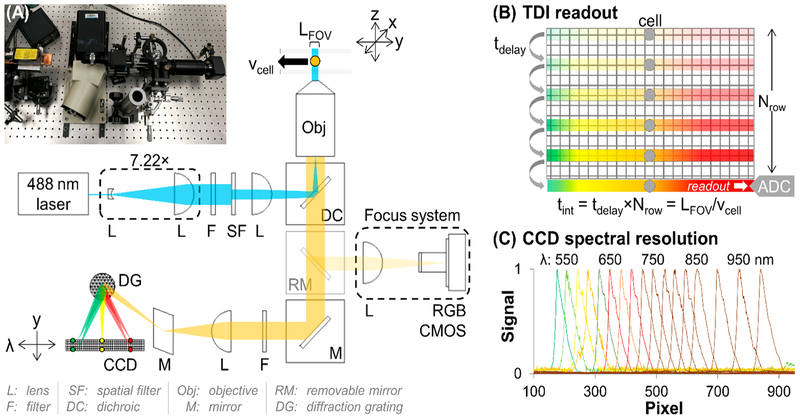
Our SFC system operates the CCD sensor in time-delayed-integration mode (TDI-SFC).7,15 TDI-SFC utilizes microfluidic cell sheathing, 488 nm laser epi-illumination, and a spectrograph that disperses fluorescence along the columns of a CCD pixel array, providing an image of the cell’s emission spectrum that is confined to a few rows of the CCD (Figure 1). As the cell moves through the field of view, the spectrum is shifted toward the serial register at a rate matching the cell’s linear velocity (i.e., synchronization). When the cell exits the field of view, the integrated emission spectrum is delivered to the CCD’s serial register for readout. As such, the CCD’s shutter is never closed, and the duty cycle is limited by the time required to shuttle photoelectrons between rows of the CCD array (30 μs duty cycle = 99%).
Figure 1.
(A) Picture and optical diagram of the TDI-SFC. A beam expander and epi-illumination lens produced widefield excitation in the flow cell from the 488 nm laser. Fluorescence emission was filtered and passed to a spectrograph that spectrally dispersed and focused the emission onto a back-illuminated CCD. If engaged, a removable mirror provided imaging for system focusing using a CMOS camera. (B) Illustration of TDI mode. The CCD’s delay time, which sets the shift rate, is matched with the cell’s velocity through the flow cell, providing integrated readout of the cell’s fluorescence. (C) Cell’s fluorescence spectrally resolved via the spectrograph.
The coupling of SFC with TDI provides three main advantages: (i) signal integration along N rows of the CCD improves the SNR by compared with a full-frame readout;15 (ii) the CCD’s shutter is never closed, with a duty cycle approaching 100%; and (iii) multiple cells occupying the field of view can be resolved by the TDI readout. TDI-SFC uses TDI to ensure that moving cells are detected with high sensitivity but trades morphological resolution for high spectral resolution and automated analysis by spectral unmixing.3,8-12 Because of its simplicity, multiplexing capabilities, and high duty cycle, TDI-SFC is amenable to high-volume clinical sampling of low-abundance cells, such as circulating tumor cells16-19 and circulating leukemia cells (CLCs)20 enriched from blood-based liquid biopsies.14
As an example of the need for immunophenotyping low-abundance cells, acute leukemias are characterized by patients in remission that may harbor drug resistance. The disease can progress from low MRD (i.e., measurable residual disease) to lethal levels in weeks to months.21,22 MFC is commonly implemented for MRD analysis and identifies leukemic cells in bone-marrow aspirates23 by abnormal expression of hematopoietic membrane proteins.24 MFC’s clinical sensitivity (10−3 to 10−4) suffers when attempting to analyze leukemia cells in peripheral blood for MRD monitoring because of the high background of blood cells and low abundance of CLCs.25 Thus, standard-of-care MRD monitoring requires invasive biopsies of the bone marrow, where leukemic cells are more concentrated, and is limited to testing once every few months. However, rapid relapse in acute leukemias requires weekly sampling to begin therapeutic intervention early and potentially improve patient outcome.22
We recently demonstrated a microfluidic assay to affinity-enrich CLCs from the peripheral blood of patients with acute myeloid leukemia (AML).20 CLCs share surface markers with normal cells, but they differ by abnormal coexpression of leukemia-associated antigens. For AML, we coated microfluidic surfaces with antibodies that enriched myeloid cells from blood, and we then interrogated the entire fraction against abnormal secondary markers to identify CLCs.20 Depending on the patient’s disease state, we detected a wide range of CLC frequencies (0.3–98.3%), with total cell counts ranging from 10 to 100 000 cells/sample,20 which made the assay problematic for immunophenotyping via MFC. Thus, we released cells from the microfluidic device for immunophenotyping by semiautomated fluorescence microscopy. This process required computer-automated imaging (>2 h per sample) and lengthy manual cell counting (10 min to >6 h, depending on cell number) to discriminate cytosolic autofluorescence signatures from immunostaining fluorescence localized to the cell membrane.20
In this manuscript, we report the analytical figures of merit of this unique TDI-SFC system to determine its potential for immunophenotyping low-abundance cells.14 This was accomplished using fluorescent beads to evaluate the ability to clock the CCD at a rate that was synchronized to the beads’ flow velocities. Several routes (Table 1) were then investigated to improve fluorescence sensitivity and achieve high SNR readout even for dim fluorescence signals. Finally, as a demonstration, the TDI-SFC was used to immunophenotype a B-ALL cell line (SUP-B15) immunostained against terminal deoxynucleotidyl transferase (TdT), an immature marker observed in 95.8% of B-ALL patients.26-28 These results provided proof-of-concept support for CLC enumeration by TDI-SFC immunophenotyping, even when cell numbers were well below 10 000.
Table 1.
Variables Tested for TDI-SFC to Improve TDI Synchronization and Fluorescence Sensitivity
| TDI-SFC variable |
range | improvement | figure |
|---|---|---|---|
| cell focusing | none → 1D focusing | synchronization:4.5 × Speak,0.8× Δt | 3 |
| cell velocity | 1.41 → 1.83 ← 2.11 mm/s | synchronization: 2.3 × Speak, 0.5× Δt | 4 |
| excitation power | 4 → 21 mW | sensitivity: >9× Sint | 5A |
| objective NA | 0.5 → 0.75 NA | sensitivity: 8–10× Sint, 4× SNR | 5B,C |
| TDI-integration time | 200 → 400 ms | sensitivity: 2× Sint, 1 × SNR | 5D |
■ EXPERIMENTAL SECTION
Reagents and Materials.
Microfluidic devices were fabricated in poly(methyl methacrylate) (PMMA, Plaskolite). Connections between syringe pumps (PicoPlus, Harvard Apparatus) and microfluidic devices used PEEK Tubing (0.007–0.020” i.d., 1/32” o.d.; Idex Health and Science), Inner-Lok union capillary connectors (Polymicro Technologies), and barbed socket Luer Lock fittings (3/32” i.d., McMaster-Carr). Reagents included formaldehyde (37%); phosphate-buffered saline (PBS, pH 7.4); fluorescein isothiocyanate (FITC); 7-aminoactinomycin D (7-AAD); In-Speck Green fluorescent calibration beads (505/515, 6 μm; smaller beads were not tested because the cells of interest are >6 μm in diameter) from Thermo Fisher Scientific; PE-, PE-Cy5-, PE-Cy7-, and PerCP-Cy5.5-conjugated streptavidin from Biolegend; FITC-labeled mouse anti-human-TdT Ab from BD (clone E17-1519); sucrose from Fluka; Histopaque-1119; Triton X-100; Micro-90; reagent-grade isopropanol (IPA) from Sigma-Aldrich; and anti-mouse-Fc-specific Ab-binding-capacity (ABC) beads from Bangs Lab.
TDI-SFC Optics.
A 488 nm solid-state laser (54 mW, TEM00, 1/e2 = 1.3 mm, Vortran Laser Technology) served as the excitation source. The laser was expanded using a 21.2× Keplerian beam expander (planoconvex lenses, f = 3 mm and f = 63.5 mm; VIS 0° coated; Edmund Optics) or a 7.1 × Galilean beam expander (biconcave lens, f = −9 mm, and planoconvex lens, f = 63.5 mm; −A and VIS 0° coated; Thorlabs and Edmund Optics). The beam was filtered using a 488/6 nm BrightLine bandpass filter (Semrock), and the beam wings were cut using an adjustable diaphragm (4.7 mm, Thorlabs). The filtered beam was focused (planoconvex lens, f = 105 mm; −A coated; Thorlabs) to the back focal plane of a microscope objective (10× Fluar, NA = 0.50, or 20× Fluar, NA = 0.75; Zeiss). Emission was collected via epi-illumination, filtered through a 495 nm BrightLine dichroic beamsplitter and a 496/LP BrightLine edge filter (Semrock), and diverted to a CP200 spectrograph (Jovin Yvon) via silver mirrors (Thorlabs). Fluorescence spectra were transduced with a Spec 10-100B back-illuminated CCD (1340 × 100 pixels, 20 μm, 16-bit; Princeton Instruments) controlled via the Scientific Instrument Tool Kit for LabVIEW (R-Cubed Software). A focusing camera (MU503 RGB CMOS camera, AmScope) was inserted into the optical train via a kinematic mirror and a tube lens (f = 165 mm, −A coated; Thorlabs). All optics were assembled and mounted using cage cubes, lens tubes, and micrometer translational stages (Thorlabs) and were enclosed in a light-tight box. Power measurements were made with a S170C sensor (Thorlabs).
TDI-SFC Data Processing.
Spectral data were streamed from LabVIEW to TDMS files, and a custom MATLAB code converted the TDMS data, reconstructed spectral frames, and performed background subtraction with a smoothing spline fit to an average of ~2000 consecutive background frames. Frames without events were eliminated on the basis of a signal-to-background-noise threshold of 20 (beads) or 10 (cells). For multiplexed staining, emission spectra were unmixed by nonlinear curve-fitting from singly stained cells and autofluorescence in unstained cells (see the SI).
Microfluidic-Flow-Cell Fabrication.
A brass master mold was fabricated by high-precision micromilling (KERN 44, KERN Micro- and Feinwerktechnik) with carbide bits (Performance Micro Tool). Microfluidic devices were hot-embossed (P3H-15-CLX press, Wabash) into PMMA (upper platen, 155 °C; lower platen, 80 °C; pressure, 1250 psi; 3 min molding; 102 °C demolding). Axel Plastics kindly gifted mold-release agent (MoldWiz F57-NC). Embossed devices were diced with a bandsaw; ports were drilled; and devices were cleaned with 10% Micro-90, IPA, and nanopure water. Microfluidic channels were enclosed with a cover plate (PMMA, 250 μm thick) using thermal-fusion bonding (105 °C, 2 h), and PEEK tubing was epoxied into the fluidic ports. Microchannel dimensions were measured before and after bonding by rapid laser-scanning confocal profilometry (VK-X250, Keyence). The flow cell was mounted to the TDI-SFC via a three-axis micrometer translational stage (Thorlabs) and connected to two syringe pumps, one driving sample (100 μL SGE syringe, 1.46 mm i.d.) and another driving sheath flows (two 250 μL SGE syringes, 2.3 mm i.d.). Sample was introduced using a two-position, six-port, manual-injection valve with a 20 μL PEEK injection loop (Idex).
TDI-SFC Optimization.
For data without flow focusing, we processed InSpeck Green calibration beads (100% intensity) at 0.675μL/min (average 2 mm/s) in a square glass capillary (75 μm i.d., Polymicro) mounted to the TDI-SFC with a section burned to expose the imaged field of view. For all other data, we infused beads (~800 beads/μL in 15% sucrose/PBS) into the microfluidic device with 15% sucrose/PBS sheathing buffer.
Cell Culturing and Immunostaining.
SUP-B15 ALL cells (ATCC CRL-1929) were cultured at 37 °C with 5% CO2 in Iscove’s modified Dulbecco’s medium with 20% fetal-bovine serum (Gibco Laboratories) and 0.02 μL/mL 2-mercaptoethanol (MP Biomedicals). Before and after staining, cells were washed with PBS (300g, 7 min) twice followed by resuspension in Histopaque-1119. For nuclear staining, cells were fixed with buffered 2% formaldehyde (15 min), permeabilized with 0.1% Triton X-100 (10 min), and stained (40 min) with anti-TdT-FITC (10 μL per 106 cells in 200 μL) and/or 7-AAD (4 μM). Unstained cells were fixed and permeabilized.
Commercial MFC.
Cells and beads were processed at 35 μL/min (16 μm core) with an Accuri C6 Plus MFC (BD, 488 nm excitation). To measure bead concentrations, 30 μL of bead suspensions were diluted 10× with water, vortexed, and immediately processed with intersample water measurements to confirm no carryover. Beads were gated on SFC–FSC and FITC before quantification.
Simulations.
Velocity profiles were simulated using COMSOL Multiphysics 5.2a. We simulated TDI readout with a custom simulation coded in Fortran 90 and compiled with GFortran (MinGW). See the SI for further details.
Statistical Analysis.
Data sets were non-normal (Shapiro–Wilk normality testing) and were compared by Wilcoxon rank sums and signed rank testing with R Studio v1.0.153 and R v3.5.1. Reported medians include all data. Box plot outliers were outside the upper and lower quartiles ± interquartile ranges.
■RESULTS AND DISCUSSION
Optical Design of TDI-SFC.
For excitation (Figure 1A, blue), we expanded a 488 nm laser beam (54 mW, spectrally filtered 488/6 nm) and focused it to the back focal plane of an infinity-corrected microscope objective (10×, 0.50 NA, or 20×, 0.75 NA) for widefield epi-illumination. Two different beam expanders were evaluated (21.2× and 7.1×) to determine optimal illumination. In either case, we eliminated the wings of the laser’s Gaussian intensity profile with a circular aperture to provide uniform illumination in the sensor’s field of view (FOV, Köhler epi-illumination). With the 21.2× beam expander, we measured 4 mW (10.7 mW/cm2) excitation through the microscope objective. The 7.1× expander increased the power to 21 mW (56.1 mW/cm2) but with less-uniform flux (the power-density relative standard deviation, RSD, increased from 2 to 15%, Figure S1).
The fluorescence emission (Figure 1A, yellow) was collected using the same microscope objective and was split from the excitation path via a dichroic mirror (DC). The emission was filtered (496 LP) before an f-matched lens was used to focus the image onto a spectrograph’s diffraction grating, which projected the dispersed emission along one axis of a back-illuminated CCD (spectral axis, 1340 pixels; spatial axis, 100 pixels; Figure 1B). We verified the spectrograph’s resolution (0.7 nm/pixel) over a wide wavelength range (500–1000 nm) by feeding light from a monochromator into the TDI-SFC with a fiber-optic cable (Figure 1C). We also included a removable mirror to bypass the TDI-SFC emission optics and reconstruct the image onto a CMOS camera via a tube lens (Figure 1A, focus system). After alignment, the mirror was removed to enable TDI-SFC.
Principle of TDI Synchronization.
Cells were hydrodynamically focused with velocity vcell through the FOV, which spanned a distance of LFOV. During the transit time (tcell = LFOV/vcell), the cell’s fluorescence spectrum moved along Nrows of the CCD (Figure 1B). In tandem with the cell’s movement, the transduced-pixel-photogenerated charges were shifted down the CCD’s rows and toward the serial register. A delay time (tdelay) between each shift was clocked to synchronize the integration time (tint) with the cell’s transit time: tint = tdelay × Nrows = tcell.
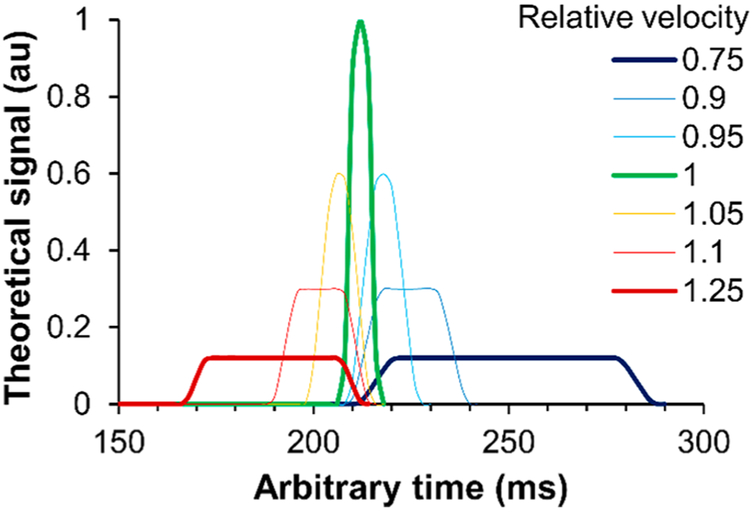
When synchronized, the cell velocity matches the CCD’s clocking rate, and the fluorescence spectrum is confined to a few serial register reads. If the image resolution is 6 μm/pixel and a perfectly tracked cell (6 μm) enters the FOV exactly when the register shift starts, only one serial register read will produce the resultant cell or bead spectrum. However, if a cell does not enter the FOV exactly when the shift occurs, the collected signal will be contained in a few readouts, and if a cell moves faster or slower than the CCD’s clocking rate, the spectrum will “slur” over multiple readouts. We show this effect in Figures 2 and S2. Mismatching between cell velocity and the TDI clocking rate causes the CCD to readout fluorescence over longer time durations. Rather than showing a peak in the signal, the signal decreases in amplitude and broadens in time.
Figure 2.
Theoretical TDI-peak shapes for varying synchronization between cell velocity and CCD delay time. A relative velocity of 1 represents perfect synchronization.
Critical to synchronization of the CCD’s TDI clocking rate, cell velocity must be constant throughout the flow cell’s cross-section. The maximum clocking rate is determined by the serial-register-readout time. We measured the readout time for the analogue-to-digital conversion of a serial register read using our CCD, which set a minimum tdelay of 2 ms. Therefore, the minimum integration time was 200 ms over the CCD’s 100 rows. We also measured the length of the TDI-CCD’s FOV with a 10μm objective (393 μm, 3.93 μm/pixel). Thus, the maximum linear velocity of a cell we could properly synchronize to the CCD would be 393 μm/200 ms ≈ 2 mm/s at 10× magnification and 197 μm/200 ms ≈ 1 mm/s at 20× magnification. For slower velocities, we could increase the delay time for longer integration times and increase the signal but also lower the throughput. Alternatively, a CCD with a faster readout (<2 ms) could enable higher velocities and, thus, higher throughput but with decreased integration times and signals.
Metrics for TDI-SFC Optimization.
We optimized the analytical figures of merit of the TDI-SFC using calibration beads (d = 6 μm) with relative fluorescence intensities from 0.3 to 100%. Comparing the fluorescence of these beads to the fluorescence intensities of the Ab-binding-capacity (ABC) beads, we found that 0.3 to 100% intensity corresponded to loads of 3.8 ± 0.2 × 10⁵ to 1.3 ± 0.1 × 10⁸ fluorescent Abs (Figure S3). Because immunolabeled surface antigens typically yield 103 to 107 Abs per biological cell, we aimed to achieve high sensitivity for the dimmest beads (0.3% intensity). Next, we will describe sequential improvements made to the TDI-SFC (Table 1) before we applied the optimized system to immunophenotyping biological cells.
A cell or bead will generate a TDI signal S(λ, t) that is a fluorescence spectrum (λ) read over a certain time duration (Δt). With high synchronization between cell velocity and CCD clocking, the fluorescence peak signal will be maximized, and Δt will be minimized (Figure S2). Thus, for variables affecting TDI synchronization, we monitored Δt and the peak signal, Speak, at the maximum emission wavelength, λmax:
| (1) |
For variables affecting the system’s fluorescence sensitivity, we integrated the signal (Sint) across Δt and all λ values:
| (2) |
To calculate the SNR for each event, we divided Sint by the signal noise. We accounted for dark noise, read noise, and shot noise by fitting the time-integrated spectrum with a smoothing spline function, Ffit(λ) (Figure S4), and calculated noise from the square root of the residual’s sum of squared errors (SSE). The SNR was thus determined using
| (3) |
1D Microfluidic Focusing for Improved TDI Synchronization.
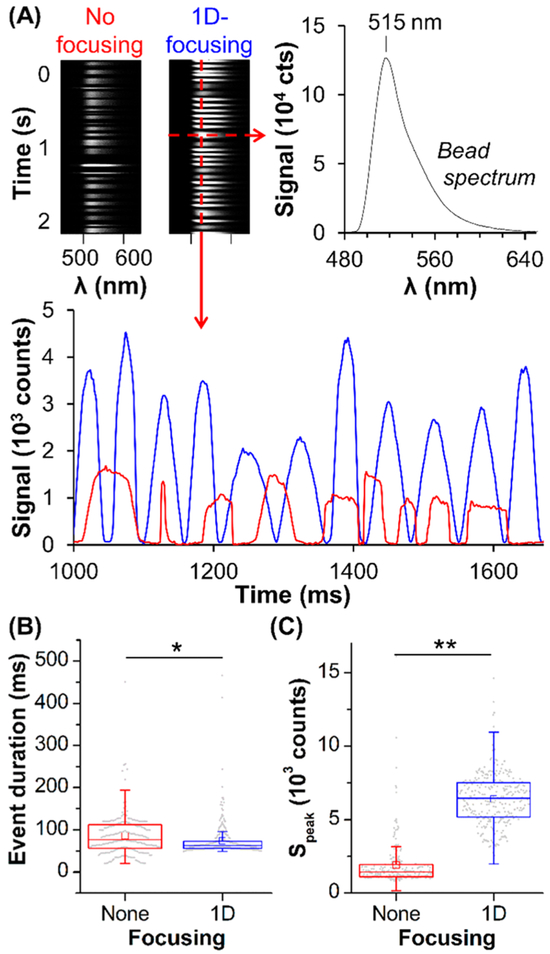
Hydrodynamic flow through a capillary or microchannel yields a laminar flow profile with nonuniform velocities, which can cause variable TDI synchronization from cell-to-cell. We observed this effect by flowing fluorescent beads through a 75 μm glass capillary at 2 mm/s (200 ms integration). In all cases, we verified the TDI-SFC focal plane was at the center of the capillary or microchannel using the focusing system and a micrometer sample mount. We counted TDI signals when Speak increased 20× above background noise and analyzed events for Δt and Speak at the bead’s λmax (515 nm). In unfocused flow, TDI signals ranged from 56 to 112 ms in duration (interquartile range, median of 77 ms), and many events exhibited flat and non-Gaussian signal shapes (Figure 3A).
Figure 3.
(A) TDI imaging of fluorescent beads (100% intensity) without focusing (red) and with 1D microfluidic focusing (blue): spectra acquired over 2 s with background data between events removed, a bead spectrum, and the signal at λmax (515 nm) over time. (B,C) Box plots of (B) Δt and (C) Speak. The middle line shows the median; box edges show the lower and upper quartiles; the bars show minima and maxima, excluding outliers; the squares show averages; and the dots represent all the data. Statistical analyses demonstrated significance at p < 10−2 (*) and p < 10−4 (**). Sample and sheath flow rates were 0.178 and 0.217 μL/min, respectively, with the 10× objective and 4 mW excitation.
To improve velocity uniformity, we introduced the sample into a microfluidic flow cell with a T-junction, where merging of sheath buffer on either side of the sample provided 1D focusing along the x-direction of the flow cell. This restricted the sample’s lateral position, improving velocity uniformity in the sample stream’s cross-section (Figure S5). Without synchronizing CCD clocking to bead velocity (maximum of 2.4 mm/s), we observed more uniform event durations between 56 and 72 ms (interquartile range, median of 62 ms, Figure 3B) with peak shapes characteristic of TDI synchronization (Figure 3A). Indeed, the median Speak increased by 4.6× with 1D focusing (Figure 3C).
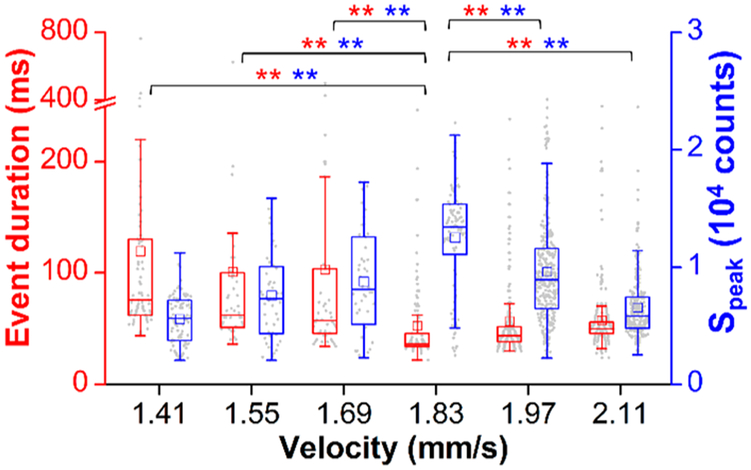
We optimized flow conditions for 1D focusing by maintaining sample flow rate and increasing sheathing flow rate. The maximum velocity in the sample stream increased from 1.41 to 2.11 mm/s, whereas the sample stream width decreased from 24 to 16.4 μm (Figure S5). A constant integration time of 200 ms was maintained, and we observed an optimal velocity of 1.83 mm/s that maximized Speak (median = 13 430 counts) and minimized Δt (median = 36 ms) with statistically significant differences (p < 10−4, Figure 4). These trends agreed within 10% of the theoretical calculations above and illustrated improvements in TDI synchronization with 1D focusing.
Figure 4.
Optimization of TDI synchronization in the 1D microfluidic flow cell, showing box plots of Δt (red) and Speak (blue) values at varying maximum velocities. Data were acquired with a 10× objective and 4 mW excitation. Statistical analyses showed p < 10−4 (**).
We note that the TDI-SFC optics do not include a confocal pinhole to block out-of-focus fluorescence. Cells not focused along the microchannel’s 92 μm depth can be detected but with a decreased, out-of-focus signal (Figure S6) and variable velocity and synchronization. In future work, we will employ 2D focusing to improve upon the gains made by 1D microfluidic focusing herein.
Improved TDI-SFC Sensitivity for Weak Fluorescence Signals.
The above experiments to optimize TDI synchronization used 100% relative intensity beads corresponding to a load of 108 fluorescent Abs (Figure S3). For dimmer beads, we sought to increase TDI-SFC sensitivity.
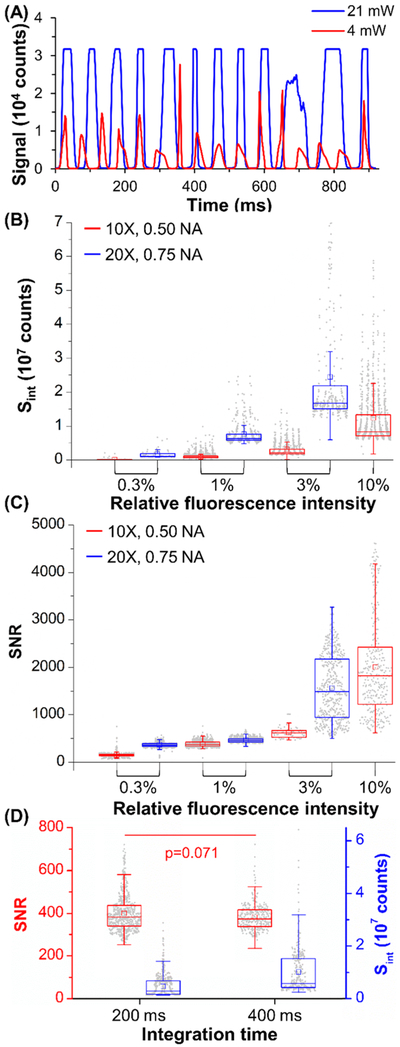
We first increased the excitation power from 4 to 21 mW. The signal from the 100% intensity beads at λmax increased beyond the CCD’s dynamic range (Figure 5A). Hence, we evaluated Sint at 550 nm, where the CCD was not saturated. We observed a 9.8× increase in Sint (5.2 × 10⁶ to 4.7 × 10⁷counts for 4 to 21 mW).
Figure 5.
(A) Signals for 100% intensity beads at 4–21 mW excitation. (B,C) Box plots of (B) Sint and (C) SNR for 0.3–10% beads at 10× (0.50 NA) or 20× (0.75 NA) and 21 mW. (D) Box plots for 400 ms integration of 3% beads at 10×. Unless noted otherwise, statistical analysis showed p < 10−6.
With increased excitation power, we analyzed Sint for dimmer beads with relative intensities of 0.3 to 10% (corresponding to 3.8 × 10⁵ to 5.0 × 10⁶ Abs) using the 10× objective (0.50 NA). We observed a linear increase (R2 = 0.99) in the median Sint from 1.0 × 10⁵ to 8.3 × 10⁶ counts for 0.3 to 10% intensities (Figure 5B) and a 152 SNR (median) for the dimmest (0.3% intensity) beads (Figure 5C).
We repeated these experiments using the 20× objective with higher NA (0.75) to increase the amount of fluorescence emission collected. We observed a substantial increase in signal (Figure S7A) and could not analyze the 10% intensity beads because of CCD saturation. For 0.3–3% intensity beads, the median Sint and SNR values increased by 7.5–10.2× and 4.0–4.8×, respectively (Figure 5B). The dimmest (0.3%) beads produced a median Sint of 1.1 × 10⁶ counts at an SNR of 610 (Figure 5C), and Sint increased linearly with intensity (R2 = 0.99) to 1820 SNR for the 3% intensity beads.
The data showed substantial gains in sensitivity using a higher NA objective for the fluorescent beads but at a reduced sample processing rate (i.e., throughput). Increasing the NA of the collection optics reduced the length of the FOV by a factor of 2. Given a constant integration time (200 ms), we reduced all flow rates by 1/2 (0.92 mm/s) to maintain an optimal velocity for TDI synchronization. In a similar manner, we halved bead velocity as we doubled the integration time to 400 ms (Figures 4D and S7B), but the 1.97× increase in Sint resulted in only a minimal change in SNR (p = 0.071). Thus, to immunophenotype cells in later experiments, we chose to use the 20× objective (0.75 NA), 200 ms of integration time, and 21 mW excitation power.
TDI-SFC Detection Efficiency and Throughput.
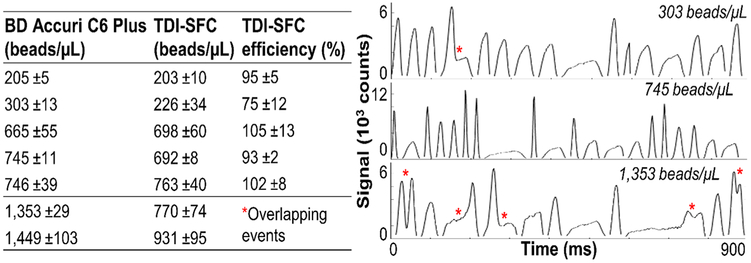
To evaluate detection efficiency, we processed different concentrations of fluorescent beads ranging between 200 and 1500 beads/μL (3% intensity beads). We measured bead concentration via the number of beads detected and the sample volume processed and correlated results to a commercial MFC (BD Accuri C6 Plus). From 200 to 750 beads/μL, we observed high concordance (R2 = 0.97) between the two systems with an average detection efficiency of 95% for TDI-SFC (Figure 6). We note there is no inherent limit for lower bead concentrations; we designed these experiments to test the upper limit of throughput.
Figure 6.
TDI-SFC measurement of bead concentration (3% intensity, 10× objective, 21 mW, 200 ms integration) compared with that of a commercial MFC instrument. TDI-SFC detection efficiency compared with that of commercial MFC (left). Coincident beads not resolved (red stars) at high bead concentrations (right).
At concentrations above 750 beads/μL, TDI-SFC detection efficiency decreased, and the number of detected events plateaued. Upon inspection of TDI signals, many events contained multiple, unresolved beads overlapping in time (Figure 6). This indicated a throughput of 90 beads/min (750 beads/μL) for the current TDI-SFC system, which was limited by the maximum clocking rate of our CCD sensor.
As TDI should be capable of resolving coincident events, we aimed to estimate multiple occupancy in the TDI-SFC detection volume. On the basis of Poisson statistics, we calculated the probability of coincident events (Figure S8) to be 1, 10, and 27% for 200, 750, and 1500 beads/μL, respectively. Above 10% occupancy, beads with varying velocities can produce slurring from imperfect synchronization and can overlap (Figure 6), highlighting that the current 1D-microfluidic-focusing strategy does not focus events along the z-direction (Figure 1A). Variability in the focal position also affects the consistency in beads’ fluorescence intensities (Figure S6). This can increase the coefficient of variation (CV) for a single bead population. The mean fluorescence intensity (MFI) divided by the standard deviation indicated a 6.1% CV for the commercial MFC. For TDI-SFC, the CV was calculated using the interquartile range divided by the median, which compensated for non-Gaussian statistics due to slurring. Slurring can skew Sint because slower beads reside in the FOV longer and yield higher time-integrated signals despite lower peak signals (Figure S2B). By this definition, MFC had a 7.4% CV compared with a 27.8% CV in Sint for TDI-SFC (Figure S9).
Multiplexed Detection of a Model B-ALL Cell Line (SUP-B15).
To monitor MRD for B-ALL, we can use microfluidic enrichment20 to purify and release CD19(+) B-cells; then identify all B-cells by a nuclear stain; and differentiate CLCs by positive immunostaining for TdT, a nontemplated polymerase found in the nuclei of CLCs from B-cells of patients with a leukemic phenotype.26 Although we used TdT as a leukemia-cell identifier in this demonstration, other markers can be used as well to identify leukemia cells in B-ALL, such as CD10 and CD34. Toward these efforts, we sought to evaluate the spectral properties of the B-ALL cell line (SUP-B15) immunostained with TdT and a nuclear marker and determine the magnitude of TDI-SFC signals and SNR values for biological-cell identification.
We chose 7-AAD as a nuclear stain for TDI-SFC because of its large Stokes shift (λmax = 647 nm), which enables multiplexing with dyes such as FITC, PE, or tandem dyes. Figure S10 demonstrates the multiplexing capabilities of TDI-SFC by analyzing mixtures of FITC and streptavidin conjugated with PE, PE-Cy5, PE-Cy7, or PerCP-Cy5.5. Classic-least-squares (CLS) unmixing8 deconvoluted the resultant spectra into individual components, and we correctly identified 11 different dye mixtures (100% identification efficiency).
As surrogates for CLCs, we stained a model B-ALL cell line (SUP-B15) with the 7-AAD nuclear stain and a FITC-conjugated anti-TdT Ab. A third autofluorescent component was seen in this cell line, which we consistently observed in ~6% of SUP-B15 cells throughout normal culture, even in unstained cells (Figure S11). Previously, we differentiated such cells, which are likely apoptotic,2 by localization of the fluorescence signal; strong autofluorescence was observed throughout the cell cytoplasm rather than being confined to the nucleus or membrane.20 Rather than morphological examination by microscopy or IFC,5 TDI-SFC can use high spectral resolution to differentiate FITC and 7-AAD emission from this autofluorescent signal.
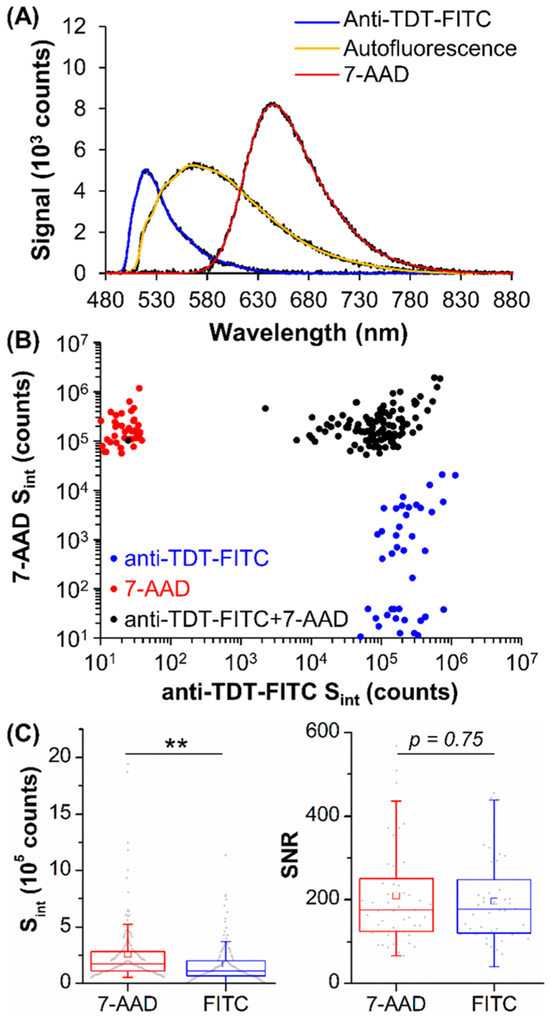
To evaluate the spectral properties of the fluorescent components, we processed SUP-B15 cells that were fixed, permeabilized, and either unstained (autofluorescence) or stained with 7-AAD or anti-TdT-FITC Abs (Figure 7A). The experimental TDI-SFC emission spectra from singly stained cells matched reference spectra (Figure S12) and formed an initial training set for spectral unmixing, which did not need to be repeated as the fluorescent dye’s spectral properties remained constant. CLS unmixing8 could not compensate for slight shifting of the emission spectra with variation in the cells’ x-axis lateral positions (Figure S5C). Thus, we fit each emission spectrum with multiple Gaussian functions and used a nonlinear-least-squares solver with strict constraints (Table S2) to discern multiplexed fluorescence components.
Figure 7.
(A) Integrated spectra of unstained (autofluorescence) SUP-B15 cells or cells stained with anti-TdT-FITC or 7-AAD. Fit curves (color lines) are overlaid on data (black lines). (B) Multiplexed unmixing of SUP-B15 cells stained with anti-TdT-FITC only, 7-AAD only (model B-cells), or both markers (model CLCs). Data without signal was expanded near the axis for illustration purposes only. (C) Box plots of Sint and SNR for 7-AAD and anti-TdT-FITC staining. Statistical analysis showed p < 10−4 (**).
We excluded highly autofluorescent SUP-B15 cells (Figure S13) and differentiated model normal B-cells (SUP-B15 cells stained with 7-AAD only) from model CLCs (SUP-B15 cells stained positive for both 7-AAD and anti-TdT-FITC Abs). Because classification was based on multiplexed unmixing of each cell’s unique fluorescence spectrum, TDI-SFC achieved high accuracy in classifying cells, even at low cell numbers (46–111 cells per group) that would be prohibitive for traditional MFC. TDI-SFC identified 100% of cells as singly stained and correctly identified 99.1% of the model CLCs as positive for both markers (Figure 7B). These results were obtained with high median Sint signals for 7-AAD (1.7 × 10⁵ counts) and anti-TdT-FITC Abs (1.1 × 10⁵ counts) with equal SNR (175, Figure 7C). However, we did observe some SUP-B15 cells stained only with anti-TdT-FITC that exhibited 7-AAD signal (Pearson’s correlation coefficient, r = 0.65) but not vice versa (r = 0.06). Manual inspection of these events suggested that either slight errors in the FITC reference spectrum or too-relaxed fitting constraints led the unmixing algorithm to minimize error by assigning some FITC signal to 7-AAD. This demonstrates the importance of improving lateral focusing (Figure S5) in addition to providing 2-D focusing with future TDI-SFC microfluidic flow cells. These future efforts will further enable simpler CLS unmixing that can be conducted in real time.
■ CONCLUSIONS
We report a unique TDI-SFC system for the immunophenotyping of low-abundance biological cells. CCD readout of high-resolution fluorescence spectra was conducted in TDI mode with the sensor duty cycle approaching 100% and a high SNR readout, even for weak fluorescence signals. These attributes ensure that low-abundance cells were detected with 95% efficiency, and for each cell, TDI-SFC acquired the entire fluorescence spectrum. This allowed for spectral unmixing and quantitative analysis of fluorescence signatures, which led to automated signal processing and obviated the need for thresholding, gating, and cluster analysis, as are typically done in conventional MFC and requires >10 000 events.
TDI-SFC will be particularly attractive for enumerating low-abundance cells, such as CLCs for acute-leukemia-MRD monitoring, via immunophenotyping. Because the affinity agent used to enrich CLCs from peripheral blood also selects cells that are not leukemic, immunophenotyping is critical for positively identifying CLCs. The workflow for MRD studies that enrich CLCs from leukemia patients’ blood has been challenged by the total number of cells enriched (spanning 100–100 000 cells).20 The range of total cell counts and CLC frequencies (0.3–98.3%), varying with the patient’s disease state, makes MFC and fluorescence microscopy operationally difficult in clinical settings because of the low number of target cells and the semiautomated nature of the enumeration process, respectively. An additional advantage of TDI-SFC or any flow cytometer for that matter is that it can include a flow-sorter unit to allow collection of the immunophenotyped CLCs. This negates the need for laser-capture microdissection or single-cell picking for recovery of CLCs, as would be required for microscopy.
We demonstrated the utility of TDI-SFC with ~100% classification accuracy for a B-ALL cell line stained with a nuclear dye (7-AAD) and a leukemic marker (anti-TdT-FITC). This was achieved by reading spectra with high signals (~106 integrated counts) and SNR (~175) generated by a TDI operation followed by SFC deconvolution for CLC identification even at low cell numbers (46–111 cells) that would be problematic for traditional MFC. Critical to these achievements were gains in TDI synchronization using a 1D microfluidic flow cell and in the fluorescence sensitivity by increasing excitation power and the epi-illumination objective’s NA.
There were some limitations associated with the current TDI-SFC system. The relatively modest throughput, 90 events/min, was a result of the limited readout rate of the CCD; faster serial-register-readout rates can improve this as long as integration times provide sufficiently high SNR readout. Second, the CV of TDI-SFC was 27.8% (using only 1D flow focusing) compared with 6.1% for commercial MFC. Future renditions of the TDI-SFC will seek to use 2D microfluidic focusing to reproducibly position cells in the focal plane of the epi-illumination objective for more uniform velocity and fluorescence-collection efficiency, which will significantly lower the CV. These improvements in flow focusing can also be made to more precisely align cells laterally, minimizing shifts in the emission spectra from cell to cell and enabling traditional, real-time, classical-least-squares unmixing.
After further optimization of the TD-SFC system as noted above, we will seek to integrate the TDI-SFC system with a microfluidic for the affinity purification of CLCs directly from peripheral blood for monitoring MRD in pediatric B-ALL patients.20 Specifically, we will seek to enrich CD19+ cells from blood and evaluate multiplexed immunostaining against TdT as well as CD10 and CD34 markers to identify the CLCs from the enriched CD19+ cell population. We will compare TDI-SFC analysis with those of conventional microscopy and MFC systems, where TDI-SFC’s enhanced spectral resolution will provide additional confidence in calling low-abundance cells when total cell counts are sample-limited. Further, the microfluidic approach for flow focusing presented herein will enable direct integration18 of affinity-purification devices with the TDI-SFC system. This will help to eliminate transfer losses of low-abundance cells, including circulating tumor cells and other low-abundance-cell types, such as CLCs.16-19
Supplementary Material
ACKNOWLEDGMENTS
The authors thank Harshani Wijerathne at KU for culturing SUP-B15 cells, Dr. Nicholas Larkey at KUMC for assistance with immunostaining and the B-ALL application, Matthew Verber at the Electronics Design Facility, University of North Carolina—Chapel Hill for coding the LabView software, and the Adams Microfabrication Facility at KU (NIH COBRE: P20GM103638). Funding was supported through the NIH (NIBIB: P41-EB020594, NCI IMAT: R21-CA173279, and NCI: P30CA168524).
Footnotes
Supporting Information
The Supporting Information is available free of charge on the ACS Publications website at DOI: 10.1021/acs.analchem.9b00021.
Excitation power and nonuniformity for different beam expanders, simulation results for TDI synchronization, Fortran TDI-simulation code, correlation plot between calibration beads and antibody-binding beads, SNR for TDI fluorescence spectra, COMSOL simulations of the 1D flow cell, out-of-focus fluorescence signals, multiple-bead occupancy in the TDI-SFC field of view, TDI signals as a function of NA and integration times, CVs for commercial and TDI-SFC processing of single beads, least-squares unmixing of dyes, autofluorescence from SUP-B15 cells, and Gaussian unmixing of fluorescence spectra (PDF)
Notes
The authors declare no competing financial interest.
REFERENCES
- (1).Roederer M Cytometry, Part A 2008, 73A, 384–385. [DOI] [PubMed] [Google Scholar]
- (2).Surre J; Saint-Ruf C; Collin V; Orenga S; Ramjeet M; Matic I Sci. Rep 2018, 8, 12088. [DOI] [PMC free article] [PubMed] [Google Scholar]
- (3).Futamura K; Sekino M; Hata A; Ikebuchi R; Nakanishi Y; Egawa G; Kabashima K; Watanabe T; Furuki M; Tomura M Cytometry, Part A 2015, 87, 830–42. [DOI] [PMC free article] [PubMed] [Google Scholar]
- (4).Basiji D; Ortyn WE; George TC; Brawley J; Hall BE; Morrissey P Cytometry, Part A 2004, 59A, 87. [Google Scholar]
- (5).Basiji DA; Ortyn WE; Liang L; Venkatachalam V; Morrissey P Clin. Lab. Med 2007, 27, 653–670. [DOI] [PMC free article] [PubMed] [Google Scholar]
- (6).George TC; Hall BE; Zimmerman CA; Frost K; Seo M; Ortyn WE; Basiji D; Morrissey P Cytometry, Part A 2004, 59A, 118. [DOI] [PubMed] [Google Scholar]
- (7).Basiji DA; Ortyn WE U.S. Patent 6249341, 2001. [Google Scholar]
- (8).Nolan JP; Condello D Curr. Protoc. Cytom 2013, 63, 1.27.1–1.27.13. [DOI] [PMC free article] [PubMed] [Google Scholar]
- (9).Telford WG; Shcherbakova DM; Buschke D; Hawley TS; Verkhusha VV PLoS One 2015, 10, e0122342. [DOI] [PMC free article] [PubMed] [Google Scholar]
- (10).Watson DA; Gaskill DF; Brown LO; Doorn SK; Nolan JP Cytometry, Part A 2009, 75A, 460–464. [DOI] [PMC free article] [PubMed] [Google Scholar]
- (11).Hauer P; Le Ru EC; Willmott GR Biomicrofluidics 2015, 9, 014110. [DOI] [PMC free article] [PubMed] [Google Scholar]
- (12).Goddard G; Martin JC; Naivar M; Goodwin PM; Graves SW; Habbersett R; Nolan JP; Jett JH Cytometry, Part A 2006, 69A, 842–851. [DOI] [PubMed] [Google Scholar]
- (13).Robinson JP; Rajwa B; Gregori G; Jones J; Patsekin V Proc. SPIE 2005, 5692, 7. [Google Scholar]
- (14).Jackson JM; Witek MA; Kamande JW; Soper SA Chem. Soc. Rev 2017, 46, 4245–4280. [DOI] [PMC free article] [PubMed] [Google Scholar]
- (15).Emory JM; Soper SA Anal. Chem 2008, 80, 3897–3903. [DOI] [PubMed] [Google Scholar]
- (16).Jackson JM; Witek MA; Hupert ML; Brady C; Pullagurla S; Kamande J; Aufforth RD; Tignanelli CJ; Torphy RJ; Yeh JJ; Soper SA Lab Chip 2014, 14, 106–117. [DOI] [PMC free article] [PubMed] [Google Scholar]
- (17).Witek MA; Aufforth RD; Wang H; Kamande JW; Jackson JM; Pullagurla SR; Hupert ML; Usary J; Wysham WZ; Hilliard D; Montgomery S; Bae-Jump V; Carey LA; Gehrig PA; Milowsky MI; Perou CM; Soper JT; Whang YE; Yeh JJ; Martin G; Soper SA npj Precis. Oncol 2017, 1, 24. [DOI] [PMC free article] [PubMed] [Google Scholar]
- (18).Kamande JW; Hupert ML; Witek MA; Wang H; Torphy RJ; Dharmasiri U; Njoroge SK; Jackson JM; Aufforth RD; Snavely A; Yeh JJ; Soper SA Anal. Chem 2013, 85, 9092–9100. [DOI] [PMC free article] [PubMed] [Google Scholar]
- (19).Nair SV; Witek MA; Jackson JM; Lindell MAM; Hunsucker SA; Sapp T; Perry E; Hupert ML; Bae-Jump V; Gehrig PA; Wysham WZ; Armistead PM; Voorhees P; Soper SA Chem. Commun 2015, 51, 3266–3269. [DOI] [PMC free article] [PubMed] [Google Scholar]
- (20).Jackson JM; Taylor JB; Witek MA; Hunsucker SA; Waugh JP; Fedoriw Y; Shea TC; Soper SA; Armistead PM Analyst 2016, 141, 640–651. [DOI] [PMC free article] [PubMed] [Google Scholar]
- (21).Ryan DH; Van Dongen JJM In Immunologic Approaches to the Classification and Management of Lymphomas and Leukemias; Bennett JM, Foon KA, Eds.; Kluwer Academic: Dordrecht, The Netherlands, 1988; pp 173–208. [Google Scholar]
- (22).Schuurhuis GJ; Ossenkoppele G Expert Rev. Hematol 2010, 3, 1–5. [DOI] [PubMed] [Google Scholar]
- (23).Wood BL Cytometry, Part B 2016, 90, 47–53. [DOI] [PubMed] [Google Scholar]
- (24).Wood BL J. Hematop 2015, 8, 191–199. [Google Scholar]
- (25).Paietta E Hematology Am. Soc. Hematol. Educ. Program 2012, 2012, 35–42. [DOI] [PubMed] [Google Scholar]
- (26).Seegmiller AC; Kroft SH; Karandikar NJ; McKenna RW Am. J. Clin. Pathol 2009, 132, 940–949. [DOI] [PubMed] [Google Scholar]
- (27).Zhou Y; Fan X; Routbort M; Cameron Yin C; Singh R; Bueso-Ramos C; Thomas DA; Milton DR; Medeiros LJ; Lin P Mod. Pathol 2013, 26, 1338–45. [DOI] [PubMed] [Google Scholar]
- (28).Chiaretti S; Zini G; Bassan R Mediterr J. Hematol Infect Dis 2014, 6, No. e2014073. [DOI] [PMC free article] [PubMed] [Google Scholar]
Associated Data
This section collects any data citations, data availability statements, or supplementary materials included in this article.


