

Abstract
Background:
Higher mortality experienced by socially disadvantaged groups and/or racial/ethnic minorities is hypothesized to be, at least in part, due to an acceleration of the aging process. Using a new epigenetic aging measure, Levine DNAmAge, this study aimed to investigate whether epigenetic aging accounts for mortality disparities by race/ethnicity and education in a sample of U.S. postmenopausal women.
Methods:
1,834 participants from an ancillary study (BA23) in the Women’s Health Initiative, a national study that recruited postmenopausal women (50–79 years) were included. Over the 22 years of follow-up, 551 women died, and 31,946 person-years were observed. Levine DNAmAge (unit in years) was calculated based on an equation that we previously developed in an independent sample, which incorporates methylation levels at 513 CpG sites.
Results:
As previously reported, non-Hispanic blacks and Hispanics were epigenetically older than non-Hispanic whites of the same chronological age. Similarly, those with less education had older epigenetic ages than expected in the full sample, as well as among non-Hispanic whites and Hispanics, but not among non-Hispanic blacks. Non-Hispanic blacks and those with low education exhibited the greatest risk of mortality. However, this association was partially attenuated when accounting for differences in DNAmAge. Furthermore, formal mediation analysis suggested that DNAmAge partially mediated the mortality increase among non-Hispanic blacks, compared to non-Hispanic whites (proportion mediated, 15.8%, P =0.002), as well as the mortality increase for those with less than high school education, compared to college educated (proportion mediated, 11.6%, P <2E-16).
Conclusions:
Among a group of postmenopausal women, non-Hispanic blacks and those with less education exhibit higher epigenetic aging, which partially accounts for their shorter life expectancies.
Keywords: race/ethnicity, education, mortality, epigenetic aging, mediation
1. Introduction
Health disparities in the U.S. has been a major societal, economic, and humanitarian problem (Murray et al., 2006). Recent mortality data from the National Vital Statistics System shows that the life expectancy (LE) for non-Hispanic blacks in 2015 was only 75.1 years—more than three and a-half years lower than it was for non-Hispanic whites (National Center for Health Statistics). Further, death rates are substantially higher among persons with only a high school (HS) degree or less, compared to those with at least some college education (National Center for Health Statistics). In response to this health crisis, the National Institutes of Health (NIH) requested that each Institute and Center at NIH develop a strategic plan for reducing health disparities, complying with the mission of the National Institute on Minority Health and Health Disparities (NIMHD) founded in 2000. This mission has also been consistent with the research goal E of the National Institute on Aging (National Institute on Aging).
Research has suggested that differential LE stems from broad, complex, and multifaceted circumstances over the life course, that, at least in part, via an acceleration of the biological aging process (Adams and White, 2004; Crimmins et al., 2009; Levine et al., 2015a; Puterman et al., 2016). It is thought that both racial minority status and education operate as proxies for a number of determinants, which have a direct effect on the biological basis that influences aging and pathogenesis of disease. These include repeated experiences of disadvantage and discrimination leading to chronic psychosocial stress, poorer health behaviors and neighborhood environments, and increased environmental exposure to pollutants and toxins (Institute of Medicine 2013). Experiences of chronic stress or deprivation cause continual “wear and tear” (McEwen, 2012; Seeman et al., 2001), eventually manifesting as vulnerability to disease and death. The “weathering” hypothesis (Geronimus et al., 2006) posits that the higher psychosocial stress levels and relative lack of resources experienced by blacks result in higher rates of chronic illness and shorter LE in the U.S.
While higher mortality experienced by socially disadvantaged groups have been well documented, the underlying biology accounting for how these factors “get under the skin” and contribute to pathogenesis is not well mapped. When it comes to aging, studies in both animal models and humans have highlighted molecular hallmarks hypothesized to contribute to age-related increases in morbidity and mortality. One such hallmark centers around epigenetic alterations. Epigenetics refers to the chemical alterations to the genome that cause conformational shifts in chromatin structure, influencing potential gene activation. One form of epigenetic modification, DNA methylation of CpG sites, has been shown to strongly relate to chronological age. As a result, a number of “epigenetic clocks” have been developed (e.g., see (Hannum et al., 2013; Horvath, 2013)). Epigenetic clocks are meant to estimate the biological age of a sample based on composite measures of methylation at various sites across the genome. When contrasted with chronological age, they provide insights into whether a person is aging faster or slower than expected. We recently developed a novel epigenetic clock, Levine DNAmAge, which when estimated in blood has been shown to robustly predict multiple age-related mortality and morbidity outcomes (Levine et al., 2018).
Although epigenetic clocks are assumed to be measuring the same latent concept—epigenetic aging—work by us and others is beginning to suggest that these measures are inherently different. Therefore, in most instances work exploring associations between epigenetic aging and either outcomes and/or contributors should consider multiple clocks. However, not all epigenetic clocks can be suitable in terms of a specific study aim, e.g., testing whether epigenetic aging mediated mortality disparities in this study, as an epigenetic clock should meet with at least two criteria for further consideration as a mediator. First, the epigenetic clock should reflect differences in the exposure variables (i.e., race/ethnicity and education) in the same direction as the outcome variable. Second, the epigenetic clock had to exhibit a significant main effect for all-cause mortality. Our previous comparisons between the Levine DNAmAge and others (i.e., the Horvath and Hannum clocks) suggest that the Levine DNAmAge is the only one of the three measures for which differences in DNAmAge mirror LE disparities—higher epigenetic age and lower LE among non-Hispanic blacks, compared to non-Hispanic whites (Levine et al., 2018), providing a better reflection of differences in the race/ethnicity and/or socioeconomic status (SES). Also, the Levine DNAmAge is a stronger predictor of multiple age-related mortality and morbidity outcomes across several datasets compared to the two commonly used clocks ((Levine et al., 2018), more details in Discussion).
Given the hypothesis, disadvantage→ accelerated aging → shorter LE, and building on previous research on the links between stress, SES, and epigenetic aging (Dhingra et al., 2018; Gassen et al., 2017), this study used this new epigenetic aging measure−Levine DNAmAge, to determine whether higher epigenetic aging among less educated or minority persons accounts for observed shorter LE in a sample of U.S. postmenopausal women.
2. Materials and methods
2.1. Study participants
Participants are from an ancillary study (BA23, Integrative genomics for risk of coronary heart disease [CHD] and related phenotypes) in the Women’s Health Initiative (WHI), a national study that began in 1993 and recruited postmenopausal women (50–79 years) (The Women’s Health Initiative Study Group, 1998). The WHI is a multi-center longitudinal study consisting of an observational study and randomized clinical trial components and the details on the study design and recruitment methodologies have been previously described (Hays et al., 2003; The Women’s Health Initiative Study Group, 1998). The major goals of the WHI were to assess the health associated effects such as hormonal therapy, dietary modification, and calcium plus vitamin D supplementation in postmenopausal women. Institutional review board approval was obtained at each center and all participants provided written informed consent. To primarily identify novel genomic determinants of CHD, the WHI ancillary study−BA23 adopted a case-control sampling design (n=1,070 for case and control group, respectively), with an overrepresentation of racial/ethnic minorities (i.e., non-Hispanic blacks and Hispanics). About half of the samples developed CHD between the baseline measurement and 2011. All incident cases and controls were required to have already undergone genome wide genotyping at baseline as well as profiling of seven cardiovascular biomarkers, as dictated by the aims of other ancillary WHI studies. The current analytic sample included 1,834 participants who had complete data on Levine DNAmAge, mortality, race/ethnicity, and education.
2.2. Race/ethnicity and education
In the self-administered questionnaires at baseline, participants identified their race/ethnicity by selecting from among six categories listed on the U.S. Census at the time of the initiation of the study including: white, black/African American, Hispanic, American Indian/Alaskan Native (Native American), Asian/Pacific Islander, or other. However, the BA23 sample only included women who identified as either non-Hispanic white, non-Hispanic black, or Hispanic. The WHI education variable was collapsed into four categories given the low sample size in some of the initial categories. In our analysis, participants were categorized as: 1, < HS; 2, HS/general educational development (GED); 3, some college (having attended college but not receiving at least a Bachelor’s degree); or 4, college (i.e., having a Bachelor’s degree or higher).
2.3. Mortality
In the WHI cohort study, deaths were identified by semiannual or annual follow-up with the participants’ family, friends, and medical care providers, as well as through the National Death Index and obituaries. Participants in this study were followed up through 2016.
2.4. Levine DNAmAge and Levine DNAmAgeAccel
2.4.1. DNA methylation data from blood
The methylation analysis of the BA23 sample has been described previously (Levine et al., 2015b). The dataset is available at dbGaP under the accession numbers phs000200.v10.p3. In brief, the Illumina Infinium Human-Methylation450 BeadChip was used to measure bisulfite-conversion-based, single-CpG resolution DNA methylation levels of whole blood at 485,577 CpG sites in the human genome at HudsonAlpha Institute of Biotechnology. The data were then generated by following the standard protocol of Illumina methylation assays, which quantifies methylation levels by the β value using the ratio of intensities between methylated and un-methylated alleles. Specifically, the β value is calculated from the intensity of the methylated (M corresponding to signal A) and un-methylated (U corresponding to signal B) alleles, as the ratio of fluorescent signals β = Max M,0 / [Max M,0 + Max U,0 + 100]. Thus, β values of these CpG sites range from 0 (completely un-methylated) to 1 (completely methylated).
2.4.2. Levine DNAmAge and Levine DNAmAgeAccel
Levine DNAmAge (unit in years) was calculated in accordance with our previously described method, that incorporates methylation levels at 513 CpG sites (Levine et al., 2018). In brief, in our original paper we described how we developed this measure using a two-step method. First, a measure of Phenotypic Age was derived based on clinical biomarkers using data from the third National Health and Nutrition Examination Survey NHANES III (Levine et al., 2018; Liu et al., 2018). Phenotypic Age represents the expected age within the population that corresponds to a person’s estimated hazard of mortality as a function of his/her biological profile (Levine et al., 2018; Liu et al., 2018). In contrast to previous epigenetic clocks, which train epigenetic predictors of chronological age, we used data from the Invecchiare in Chianti (InCHIANTI) to train an epigenetic predictor of clinically-based Phenotypic Age. This second step resulted in an epigenetic age predictor, that was a weighted sum of DNA methyalation (DNAm) levels at 513 CpGs (coefficients for 513 CpGs were available in Supplement 2 in our previous publication (Levine et al., 2018) or upon requests), which was used in the current study and that we referred to as Levine DNAmAge.
For the current study, we also calculated a measure of “age acceleration” (i.e., Levine DNAmAgeAccel), defined as the residual resulting from a linear model when regressing Levine DNAmAge on chronological age. Therefore, Levine DNAmAgeAccel represents biological aging after accounting for chronological age (i.e. whether a person’s biological age was older [positive value] or younger [negative value] than expected). By definition, DNAmAgeAccel has a r=0.0 correlation with chronological age.
2.5. Other covariates
Body mass index (BMI) smoking status, and moderate exercise were considered in this analysis as potential confounders between race/ethnicity or education and epigenetic aging. BMI was calculated as weight/height (kg/m2) using anthropometric measurements and had six categories: <18.5, 18.5–24.9, 25.0–29.9, 30.0–34.9, 35.0–39.9, and >40.0. Smoking status was assessed at baseline from self-reports. Participants were asked whether or not they had smoked at least 100 cigarettes in their lifetime. Those reporting ‘no’ to this question were classified as never smokers. Those who answered ‘yes’ were classified as former smokers if they reported that they no longer smoked. Those reporting that they still smoked were classified as current smokers. Six categories for moderate exercise were considered based on responses to one question “how often each week 7 days do you usually do the exercises below? (e.g., biking outdoors, using an exercise machine (like a stationary bike or treadmill), calisthenics, easy swimming, and popular or folk dancing)”: none, 1 day per week, 2 days per week, 3 days per week, 4 days per week, or 5 and more days per week.
2.6. Statistical Analyses
We presented the mean ± standardized deviation (SD) or percentages of characteristics of study population. Differences in DNAmAgeAccel between racial/ethnic and education groups were compared using a KruskalWallis test. Three Cox proportional hazard models were used to assess the mortality associations for race/ethnicity and education. Model 1 included chorological age, race/ethnicity, and education. Model 2 additionally adjusted for smoking, BMI, and exercise, and Model 3 additionally adjusted for Levine DNAmAge. To formally test the possible mediation effect of Levine DNAmAge on the association of race/ethnicity and education with mortality, we used the R package “mediation” developed by Tingley and colleagues (Tingley et al., 2014). This package estimates effects of causal mediation based on either linear and nonlinear relationships, within parametric or nonparametric models, and contains both continuous and discrete mediators of various types of outcomes—including time-to-event. We used 1,000 simulations to calculate the uncertainty estimates, based on quasi-Bayesian Monte Carlo method from normal approximation (Imai et al., 2010; King et al., 2000). All analyses were performed using R version 3.4.1 2017-06-30 and STATA version 14.0 software (Stata Corporation, College Station, TX).
3. Results
Table 1 in Appendix A presents the characteristics of study population. On average, they were 65.5 years old (SD: 7.1) at baseline. Nearly half of the participants were non-Hispanic white (n=865, 47.2%); one-third were non-Hispanic black (n=605, 33.0%); and under 20% were Hispanic (n=364, 19.9%). Of the 1834 women, 531 (29.0%) had a college degree, 467 (25.5%) had some college education, 614 (33.5%) had a high school education, and 222 (12.1%) had not graduated from high school or received a GED. About half sample (n=873, 47.6%) were former or current smokers. One third (n=625, 34.1%) was overweight and 44% (n=807) had BMI over 30 kg/m2. For moderate exercise, 61.2% (n=1,115) reported doing no exercise per week, about ten percent exercised 1 (n=184), 2 (n=175), or 3 (n=196) days per week, respectively, and less than ten percent (n=152) reported exercising 4 or more days week. Over the possible 22 years of follow-up, 551 (30.0%) women died, and 31,946 person-years were observed.
As previously reported (Levine et al., 2018), we observed significant differences in DNAmAgeAccel between the three racial/ethnic groups (P=5.1E-5, Fig. 1A in Appendix B). For instance, non-Hispanic whites were 0.6 year younger than what was expected based on their chronological ages. Conversely, non-Hispanic blacks and Hispanics were 0.6 year and 0.4 year older, respectively, compared to what was expected (Fig. S5A, (Levine et al., 2018)). Higher education was related to lower DNAmAgeAccel (epigenetically younger, Fig. 1B in Appendix B). This also appeared to exhibit a dose response, with the worst-off being women with less than a HS education, whom appeared 1.4 years older than expected, epigenetically, and the best-off being women with a college education who appeared 1.0 years younger than expected. This pattern remained for non-Hispanic whites and Hispanics when stratifying by race/ethnicity (Fig. 1). For example, in the non-Hispanic white participants, those with less than HS were 1.1 year older, epigenetically, than expected, those with HS/GED had DNAmAges similar to what would be expected based on their chronological age (i.e., Levine DNAmAgeAccel = 0), those with some college appeared 0.9 years younger than expected, and those with college degrees had epigenetic ages that were 1.6 years. However, among non-Hispanic blacks, we did not observe a drop in epigenetic age with increasing education.
Fig. 1. Levine DNAmAgeAccel by race/ethnicity and education.
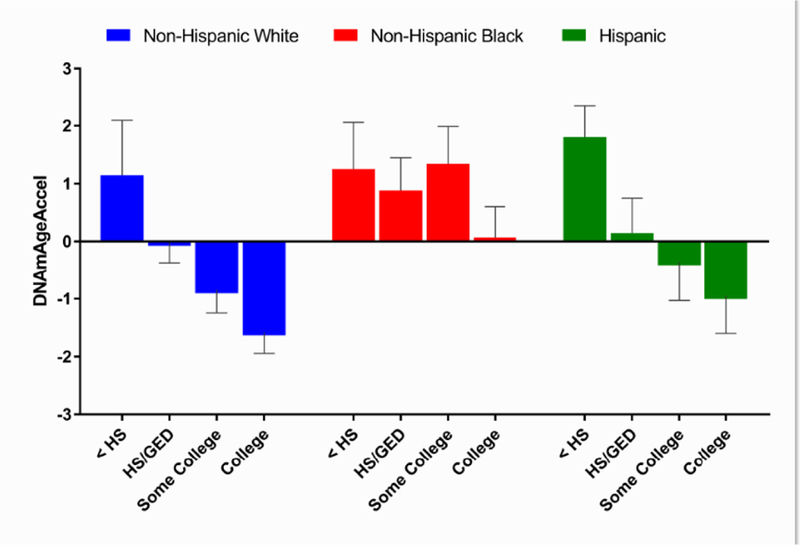
HS, high school; GED, general educational development. As previously reported (Levine et al., 2018) significant differences in DNAmAgeAccel between the three racial/ethnic groups (P=5.1E-5) were observed (also presented in Fig. 1A in Appendix B in this manuscript). On average, non-Hispanic whites were 0.6 year younger than what was expected based on their chronological ages. Conversely, non-Hispanic blacks and Hispanics were 0.6 year and 0.4 year older, respectively, compared to what was expected (Levine et al., 2018). In full sample, higher education was related to lower DNAmAgeAccel (epigenetically younger, P=3.8E-6, Fig. 1B in Appendix B). This also appeared to exhibit a dose response, with the worst-off, being women with less than a HS education, whom appeared 1.4 years older than expected, epigenetically, and the best-off being women with a college education who appeared 1.0 years younger than expected.
Table 1 presents the results for Cox models of all-cause mortality. We found that compared to non-Hispanic whites, non-Hispanic blacks had a 43% increased risk of death (hazard ratio [HR]=1.43, 95% confidence interval [CI]:1.17–1.74), while the Hispanic did not exhibit any difference in mortality risk (HR=0.87, 95%CI:0.66–1.16). Compared to those with a college education, women with less than a HS, with HS degree, with some college, had 82%, 29%, and 12% increased risk of death, respectively. Adjusting for smoking, BMI, and exercise marginally decreased the mortality risk associated with being non-Hispanic black or having lower education. We additionally adjusted for DNAmAge and observed that the HR for mortality was 1.33 when comparing non-Hispanic blacks to non-Hispanic whites, and 1.64 and 1.25, respectively, when comparing those with less than HS education and those with HS/GED to those with college degree.
Table 1.
Associations with All-Cause
| Model 1 | Model 2 | Model 3 | ||||
|---|---|---|---|---|---|---|
| HR (95% CI) | P Value | HR (95% CI) | P Value | HR (95% CI) | P Value | |
| Age | 1.11 (1.09–1.12) | <2E-16 | 1.11 (1.10–1.13) | <2E-16 | 1.08(1.06–1.10) | <2E-16 |
| Race/Ethmcity | ||||||
| Non-Hispanic White | Ref. | – | Ref. | – | Ref. | – |
| Non-Hispanic Black | 1.43 (1.17–1.74) | 5.1E-4 | 1.39(1.14–1.71) | 0.001 | 1.33 (1.09–1.63) | 0.006 |
| Hispanic | 0.87 (0.66–1.16) | 0.339 | 0.93 (0.70–1.23) | 0.612 | 0.89 (0.67–1.19) | 0.439 |
| Education | ||||||
| <HS | 1.82(1.36–2.44) | 5.3E-5 | 1.73 (1.29–2.33) | 2.8E-4 | 1.64(1.22–2.21) | 0.001 |
| HS/GED | 1.29(1.04–1.60) | 0.020 | 1.29(1.04–1.60) | 0.019 | 1.25 (1.01–1.55) | 0.044 |
| Some college | 1.12(0.89–1.41) | 0.346 | 1.10(0.87–1.40) | 0.408 | 1.09 (0.86–1.37) | 0.496 |
| College | Ref. | – | Ref. | – | Ref. | – |
| Levine DNAmAge | 1.03 (1.02–1.05) | 5.1E-7 | ||||
Note: HS, high school; GED, general educational development; HR, hazard ratio; CI, confidence interval. Model 1 adjusted for chronological age, race/ethnicity, and education. Model 2 additionally adjusted for smoking, body mass index, and moderate exercise. Model 3 additionally adjusted for Levine DNAmAge.
Fig. 2 represents predicted Kaplan-Meier survival curves by race/ethnicity and education as a function of chronological age, DNAmAge, and covariates. Overall, when setting DNAmAgeAccel=0, median LE was increased among non-Hispanic blacks and persons with lower education, while simultaneously, median LE decreased among non-Hispanic whites and person with higher education. More interestingly, the increase among disadvantaged groups tended to take place among those with early mortality, and the decrease for advantage groups tended to be focused among the longest-lived person. In general, there were only moderate shifts in median LE between the two predictions. This suggests that non-Hispanic blacks and those with low education (especially those with early mortality) would gain years of life if DNAmAgeAccel were made equal for everyone. Conversely, much of the extended LE of advantaged groups is accounted for by their lower DNAmAgeAccel.
Fig. 2. Kaplan-Meier survival estimates by race/ethnicity (A) and education (B).
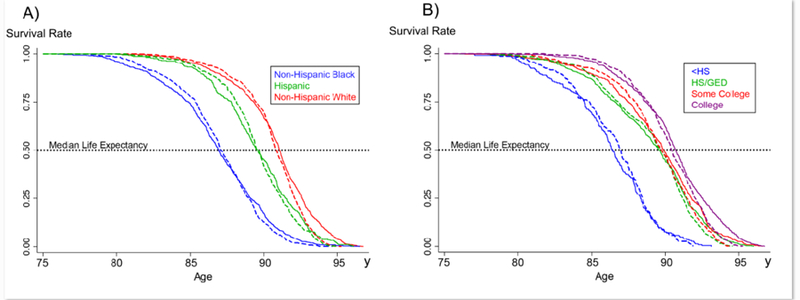
The solid line is based on observed DNAmAgeAccel and the dashed line is estimated by setting DNAmAgeAccel=0 for everyone—assumes that everyone has DNAmAgeAccel that is equivalent to what would be expected based on their chronological age.
The results for formal mediation analysis are presented in Table 2. When comparing mortality for non-Hispanic blacks and non-Hispanic whites (ref.), we observed an average direct effect (ADE) of −4.94 (p=0.008) and an average causal mediation effect (ACME) of −0.93 (p<2E-16). Overall, the results suggested that 15.8% (p=0.002) of the mortality difference between non-Hispanic blacks and non-Hispanic whites was mediated by DNAmAge. Similarly, when comparing those with college education to those with less than a HS education, ADE=−8.47 (p<2E-16) and ACME=−1.15 (p<2E-16), suggesting that 11.6% (p<2E-16) of the mortality difference was mediated by DNAmAge.
Table 2.
Mediation analysis for the effect of Levine DNAinAge on associations of race/ethnicity and education with all-cause mortality
| Estimate (95% confidence interval) | P Value | |
|---|---|---|
| Race/ethmeity (Black vs. White) | ||
| ACME (average) | −0.927 (−1.533, −0.40) | <2E-16 |
| ADE (average) | −4.940 (−8.773,−1.50) | 0.008 |
| Prop. Mediated (average) | 0.158 (0.058, 0.40) | 0.002 |
| Education (<HS v. College) | ||
| ACME (average) | −1.146 (−1.952,−0.48) | <2E-16 |
| ADE (average) | −8.465 (−13.691,−3.04) | <2E-16 |
| Prop. Mediated (average) | 0.116(0.047, 0.30) | <2E-16 |
Note: ACME, average causal mediation effect; ADE, average direct effect; HS, high school. The model mcluded chronological age, race/ethmeity, education, smokmg, body mass mdex, moderate exercise, and Levine DNAmAge. Whites or participants with college degree were used as reference group for comparisons. The number of participants mcluded in this analysis was 1,822 due to missing data on exercise (n=12).
4. Discussion
Using a newly developed aging measure−Levine DNAmAge, this study aimed to determine whether epigenetic aging acounts for mortality disparities as a function of race/ethnicity and/or education. In our sample of U.S. postmenopausal women, we found that on average, blacks and those with less education exhibited higher epigenetic ages, compared to whites and or highly educated women. Furthermore, this accelerated epigenetic aging partially accounted for the differential LEs between these groups. The findings are in accordance with the “weathering” hypothesis, which suggests that socioenvironmental circumstances “get under the skin”, accelerating epigenetic aging process, and eventually resulting in health disparities—including years of life lost.
The findings that Levine DNAmAge differed by race/ethnicity and education are more or less consistent with results using other aging measures (Fiorito et al., 2017; Horvath et al., 2016; Quach et al., 2017; Zhang et al., 2011). For instance, differences in epigenetic aging by race/ethnicity and/or education have been observed for the Horvath and Hannum epigenetic clocks (Horvath et al., 2016; Quach et al., 2017). However, in contrast to what we observed for the Levine DNAmAge, non-Hispanic blacks were found to have lower epigenetic aging (younger) compared to non-Hispanic whites when using the Hannum clock, and no difference was found between these two groups when using the Horvath clock—although Hispanics were found to have lower epigenetic aging using the Horvath clock (Horvath et al., 2016). Overall, this suggests that mirrored racial differences in LE and epigenetic aging between blacks and whites are only observed for the Levine DNAmAge. However, we do not observe differences between non-Hispanic whites and Hispanics, as have been observed for the Horvath clock in agreement with the Hispanic Paradox (Horvath et al., 2016). When it comes to education, the Hannum, but not the Horvath clock has been shown to exhibit SES gradients similar to those observed here for the Levine DNAmAge—with higher education being associated with lower epigenetic aging in blood, as expected (Quach et al., 2017).
Nevertheless, as mentioned before, in the current analysis we chose not to explore potential mediation by either the Hannum or Horvath clocks for the following a priori reasons. While, the Hannum clock is also associated with mortality risk—although to a lesser extent than Levine—the differences by race/ethnicity are in the opposing direction. Thus, it is unlikely that differences in Hannum clock account for blackwhite mortality disparities, given that non-Hispanic blacks have been shown to be about two years younger epigenetically, when using the Hannum clock (Quach et al., 2017). Conversely, the Horvath clock is both not a robust mortality predictor (See Table 2, Appendix A) and does not reflect disparities between non-Hispanic blacks and non-Hispanic whites. Finally, we also decided to focus on the Levine clock to avid multiple comparisons bias.
When considering the potential safety-net of increased education for minorities, interestingly, we did not observe any protective effects for accelerated epigenetic aging by education among non-Hispanic blacks. This may be explained by the low quality of education for blacks corresponding to their self-reported education attainment (Albert and Teresi, 1999; Manly et al., 2002), or the increasing discrimination and/or psychosocial stressors, and social resources for persons with higher education in the subpopulation (Davis, 1994). Taking together, the observed accelerated epigenetic aging for these subpopulations including blacks and those with less education is concerning, given that an increased Levine DNAmAge of 1.6 years would increase mortality risk by 7.3% (Levine et al., 2018). Therefore, targeting these disadvantaged groups might be a priority when it comes to developing/implementing health policies and preventive programs (Brody et al., 2016a).
Our results more or less, reflect some of the findings for leukocyte telomere length (LTL) (Diez Roux et al., 2009; Geronimus et al., 2015; Hunt et al., 2008; Rewak et al., 2014; Robertson et al., 2013). Although there is evidence that blacks have longer LTL at birth, previous studies suggest that they experience more rapid shortening with age (Rewak et al., 2014). Additionally, persons with low education, or low parental education (an indicator of childhood SES), appear to have shorter LTL and/or faster LTL attrition with age (Adler et al., 2013; Wojcicki et al., 2016). Interestingly, of the three clocks, Levine DNAmAge has the strongest association to LTL (Horvath and Raj, 2018; Levine et al., 2018). The consistent findings between LTL and Levine DNAmAge, when it comes to educational or racial/ethnic differences, may reflect shared pathways involving biological responses to psychosocial stress (Brody et al., 2016c; Dhingra et al., 2018; Gassen et al., 2017; Zannas et al., 2015), deprivation of socioeconomic resources (Dhingra et al., 2018), or the internalization of negative racial bias (Chae et al., 2014). For instance, poor neighborhood conditions, which historically have characterized those occupied by blacks or less educated persons, likely predispose one to stressful life events, or shape exposure and vulnerability to stress (Diez Roux and Mair, 2010), resulting in accelerated aging (Epel and Lithgow, 2014; Razzoli et al., 2018).
In addition to illustrating both the social and racial gradients in Levine DNAmAge, our results also suggest that the accelerated epigenetic aging partially accounted for shorter LE among non-Hispanic blacks and those with low education. For instance, we found that Levine DNAmAge accounted for almost 16% of the black-white mortality differences, and 12% of mortality disparities between college educated versus those with less than a high school education. Further, Kaplan-Meier curves suggest that Levine DNAmAge was not necessarily contributing to the differences in median LE but was differentiating very short LE and high longevity. For instance, we show that the worstoff persons (i.e., with lowest LE persons) were those for whom the high accelerated epigenetic aging is having the most drastic impact on mortality. Similarly, some of the increased LE among advantaged groups (those with the highest LE, even among whites or those with high education) was partially driven by decelerated epigenetic aging.
Finally, our results suggest that our epigenetic aging measure may capture heterogeneity in vulnerability versus resilience (Brody et al., 2016b). For example, even among minorities with low education, differences in epigenetic aging translated to differences in LE. In other words, DNAmAge may be useful for identifying the most vulnerable persons who may require earlier preventative interventions and/or screening. On the other hand, it may also help identify resilient person—those who do not experience accelerated aging and reduced LE despite having characteristics we typically thought of as disadvantaged. In doing so, this may enable researchers to identify factors which confer resilience and/or vulnerability. The strengths of this study include the application of the new aging measure that incorporates DNA methylation and clinical chemistry measures, and the formal mediation analysis with a long follow-up period. However, this study has limitations that should be acknowledged. First, the lack of longitudinal data on DNA methylation prevented us from distinguishing the effects for 1) the rate of change in epigenetic aging (true acceleration), vs. 2) baseline level of epigenetic ages, relative to chronological age. Second, the analysis on postmenopausal women limits the generalizability of the findings to women of other ages, and/or men of all ages. It may be the case that postmenopausal epigenetic age has a different signature than epigenetic age prior to menopause (Levine et al., 2016). Third, we only focused on mortality as a health outcome, given the small number of cases when considering specific disease incidences. However, it is likely that disease, disability, frailty, and/or physiological dysregulation are mediators either on the pathway between DNAmAge and mortality and/or on a separate pathway between sociodemographic characteristics and mortality. For this reason, we did not consider disease and/or functioning as confounders in our models. However, in moving forward, it will be informative to test larger causal models in longitudinal studies with greater sample sizes. Finally, while we observe differences in DNAmAge by race/ethnicity and education, that likely translate into differences in mortality risk, the effect sizes are not large enough to be clinically significant. This likely reflects the fact that we only observed a partial, rather than an entire mediation of mortality by DNAmAge. As mentioned before, DNAm is only one of many hallmarks of aging. Thus, we hypothesize that incorporation of other molecular aging measures that reflect distinct systems/mechanisms (e.g., genomic instability, cellular senescence, stem cell exhaustion) may enable us to better capture the biological consequences of disadvantage. In moving forward, it will be important to integrate multiple molecular measures to gain a better picture of multisystem-level aging and its role in health disparities. Such in-depth molecular profiles may provide more clinical utility by better identifying both at-risk and resilient individuals.
5. Conclusions
We demonstrated that blacks and less educated postmenopausal women exhibit higher epigenetic aging, which partially accounts for shorter LEs among these groups. The findings strengthen the hypothesis that race/ethnicity and education influence mortality via aging acceleration, providing further evidence for the cumulative “wear and tear” and the “weathering” hypotheses. Furthermore, our results suggest that DNAmAge may be a useful tool for distinguishing vulnerability/resilience among disadvantaged groups, thus facilitating prevention and screening interventions. Nevertheless, given that the majority of the underlying etiology of health disparities remains unaccounted for, in moving forward, it will be important to consider multiple biological measures that capture various aspects of the multifactorial aging process.
Supplementary Material
Highlights.
Investigate the role of epigenetic aging in sociodemographic mortality disparities
Blacks and less educated postmenopausal women exhibit higher epigenetic aging
Epigenetic aging partially accounts for shorter life expectancy among these groups
Acknowledgments
Funding
This work was supported by the National Institutes of Health/National Institute on Aging (grant number R00AG052604, Levine). Dr. Levine is a Pepper Scholar with support from the Claude D. Pepper Older Americans Independence Center at Yale School of Medicine (grant number P30AG021342). The WHI program is funded by the National Heart, Lung, and Blood Institute, National Institutes of Health, U.S. Department of Health and Human Services through contracts HHSN268201100046C HHSN268201100001C, HHSN268201100002C, HHSN268201100003C, HHSN268201100004C, and HHSN271201100004C. The funders had no role in the study design; data collection, analysis, or interpretation; in the writing of the report; or in the decision to submit the article for publication.
Footnotes
Publisher's Disclaimer: This is a PDF file of an unedited manuscript that has been accepted for publication. As a service to our customers we are providing this early version of the manuscript. The manuscript will undergo copyediting, typesetting, and review of the resulting proof before it is published in its final citable form. Please note that during the production process errors may be discovered which could affect the content, and all legal disclaimers that apply to the journal pertain.
Declaration of interest
None
References
- 1.Adams JM, White M, 2004. Biological ageing: a fundamental, biological link between socioeconomic status and health? Eur J Public Health 14, 331–334. [DOI] [PubMed] [Google Scholar]
- 2.Adler N, Pantell MS, O’Donovan A, Blackburn E, Cawthon R, Koster A, Opresko P, Newman A, Harris TB, Epel E, 2013. Educational attainment and late life telomere length in the Health, Aging and Body Composition Study. Brain Behav Immun 27, 15–21. [DOI] [PMC free article] [PubMed] [Google Scholar]
- 3.Albert SM, Teresi JA, 1999. Reading ability, education, and cognitive status assessment among older adults in Harlem, New York City. Am J Public Health 89, 95–97. [DOI] [PMC free article] [PubMed] [Google Scholar]
- 4.Brody GH, Miller GE, Yu T, Beach SR, Chen E, 2016a. Supportive Family Environments Ameliorate the Link Between Racial Discrimination and Epigenetic Aging: A Replication Across Two Longitudinal Cohorts. Psychol Sci 27, 530–541. [DOI] [PMC free article] [PubMed] [Google Scholar]
- 5.Brody GH, Yu T, Beach SR, 2016b. Resilience to adversity and the early origins of disease. Dev Psychopathol 28, 1347–1365. [DOI] [PMC free article] [PubMed] [Google Scholar]
- 6.Brody GH, Yu T, Chen E, Beach SR, Miller GE, 2016c. Family-centered prevention ameliorates the longitudinal association between risky family processes and epigenetic aging. J Child Psychol Psychiatry 57, 566–574. [DOI] [PMC free article] [PubMed] [Google Scholar]
- 7.Chae DH, Nuru-Jeter AM, Adler NE, Brody GH, Lin J, Blackburn EH, Epel ES, 2014. Discrimination, racial bias, and telomere length in African-American men. Am J Prev Med 46, 103–111. [DOI] [PMC free article] [PubMed] [Google Scholar]
- 8.Crimmins EM, Kim JK, Seeman TE, 2009. Poverty and biological risk: the earlier “aging” of the poor. J Gerontol A Biol Sci Med Sci 64, 286–292. [DOI] [PMC free article] [PubMed] [Google Scholar]
- 9.Davis JE, 1994. College in Black and White: Campus environment and academic achievement of African American males. The Journal of Negro Education 63, 620–633. [Google Scholar]
- 10.Dhingra R, Nwanaji-Enwerem JC, Samet M, Ward-Caviness CK, 2018. DNA Methylation Age-Environmental Influences, Health Impacts, and Its Role in Environmental Epidemiology. Curr Environ Health Rep 5, 317–327. [DOI] [PMC free article] [PubMed] [Google Scholar]
- 11.Diez Roux AV, Mair C, 2010. Neighborhoods and health. Ann N Y Acad Sci 1186, 125–145. [DOI] [PubMed] [Google Scholar]
- 12.Diez Roux AV, Ranjit N, Jenny NS, Shea S, Cushman M, Fitzpatrick A, Seeman T, 2009. Race/ethnicity and telomere length in the Multi-Ethnic Study of Atherosclerosis. Aging Cell 8, 251–257. [DOI] [PMC free article] [PubMed] [Google Scholar]
- 13.Epel ES, Lithgow GJ, 2014. Stress biology and aging mechanisms: toward understanding the deep connection between adaptation to stress and longevity. J Gerontol A Biol Sci Med Sci 69 Suppl 1, S10–16. [DOI] [PMC free article] [PubMed] [Google Scholar]
- 14.Fiorito G, Polidoro S, Dugue PA, Kivimaki M, Ponzi E, Matullo G, Guarrera S, Assumma MB, Georgiadis P, Kyrtopoulos SA, Krogh V, Palli D, Panico S, Sacerdote C, Tumino R, Chadeau-Hyam M, Stringhini S, Severi G, Hodge AM, Giles GG, Marioni R, Karlsson Linner R, O’Halloran AM, Kenny RA, Layte R, Baglietto L, Robinson O, McCrory C, Milne RL, Vineis P, 2017. Social adversity and epigenetic aging: a multicohort study on socioeconomic differences in peripheral blood DNA methylation. Sci Rep 7, 16266. [DOI] [PMC free article] [PubMed] [Google Scholar]
- 15.Gassen NC, Chrousos GP, Binder EB, Zannas AS, 2017. Life stress, glucocorticoid signaling, and the aging epigenome: Implications for aging-related diseases. Neurosci Biobehav Rev 74, 356–365. [DOI] [PubMed] [Google Scholar]
- 16.Geronimus AT, Hicken M, Keene D, Bound J, 2006. “Weathering” and age patterns of allostatic load scores among blacks and whites in the United States. Am J Public Health 96, 826–833. [DOI] [PMC free article] [PubMed] [Google Scholar]
- 17.Geronimus AT, Pearson JA, Linnenbringer E, Schulz AJ, Reyes AG, Epel ES, Lin J, Blackburn EH, 2015. Race-Ethnicity, Poverty, Urban Stressors, and Telomere Length in a Detroit Communitybased Sample. J Health Soc Behav 56, 199–224. [DOI] [PMC free article] [PubMed] [Google Scholar]
- 18.Hannum G, Guinney J, Zhao L, Zhang L, Hughes G, Sadda S, Klotzle B, Bibikova M, Fan JB, Gao Y, Deconde R, Chen M, Rajapakse I, Friend S, Ideker T, Zhang K, 2013. Genome-wide methylation profiles reveal quantitative views of human aging rates. Mol Cell 49, 359–367. [DOI] [PMC free article] [PubMed] [Google Scholar]
- 19.Hays J, Hunt JR, Hubbell FA, Anderson GL, Limacher M, Allen C, Rossouw JE, 2003. The Women’s Health Initiative recruitment methods and results. Ann Epidemiol 13, S18–77. [DOI] [PubMed] [Google Scholar]
- 20.Horvath S, 2013. DNA methylation age of human tissues and cell types. Genome Biol 14, R115. [DOI] [PMC free article] [PubMed] [Google Scholar]
- 21.Horvath S, Gurven M, Levine ME, Trumble BC, Kaplan H, Allayee H, Ritz BR, Chen B, Lu AT, Rickabaugh TM, Jamieson BD, Sun D, Li S, Chen W, Quintana-Murci L, Fagny M, Kobor MS, Tsao PS, Reiner AP, Edlefsen KL, Absher D, Assimes TL, 2016. An epigenetic clock analysis of race/ethnicity, sex, and coronary heart disease. Genome Biol 17, 171. [DOI] [PMC free article] [PubMed] [Google Scholar]
- 22.Horvath S, Raj K, 2018. DNA methylation-based biomarkers and the epigenetic clock theory of ageing. Nat Rev Genet 19, 371–384. [DOI] [PubMed] [Google Scholar]
- 23.Hunt SC, Chen W, Gardner JP, Kimura M, Srinivasan SR, Eckfeldt JH, Berenson GS, Aviv A, 2008. Leukocyte telomeres are longer in African Americans than in whites: the National Heart, Lung, and Blood Institute Family Heart Study and the Bogalusa Heart Study. Aging Cell 7, 451–458. [DOI] [PMC free article] [PubMed] [Google Scholar]
- 24.Imai K, Keele L, Tingley D, 2010. A general approach to causal mediation analysis. Psychological methods 15, 309. [DOI] [PubMed] [Google Scholar]
- 25.King G, Tomz M, Wittenberg J, 2000. Making the most of statistical analyses: Improving interpretation and presentation. American journal of political science, 347–361.
- 26.Levine ME, Cole SW, Weir DR, Crimmins EM, 2015a. Childhood and later life stressors and increased inflammatory gene expression at older ages. Soc Sci Med 130, 16–22. [DOI] [PMC free article] [PubMed] [Google Scholar]
- 27.Levine ME, Hosgood HD, Chen B, Absher D, Assimes T, Horvath S, 2015b. DNA methylation age of blood predicts future onset of lung cancer in the women’s health initiative. Aging Albany NY 7, 690–700. [DOI] [PMC free article] [PubMed] [Google Scholar]
- 28.Levine ME, Lu AT, Chen BH, Hernandez DG, Singleton AB, Ferrucci L, Bandinelli S, Salfati E, Manson JE, Quach A, Kusters CD, Kuh D, Wong A, Teschendorff AE, Widschwendter M, Ritz BR, Absher D, Assimes TL, Horvath S, 2016. Menopause accelerates biological aging. Proc Natl Acad Sci U S A 113, 9327–9332. [DOI] [PMC free article] [PubMed] [Google Scholar]
- 29.Levine ME, Lu AT, Quach A, Chen BH, Assimes TL, Bandinelli S, Hou L, Baccarelli AA, Stewart JD, Li Y, Whitsel EA, Wilson JG, Reiner AP, Aviv A, Lohman K, Liu Y, Ferrucci L, Horvath S, 2018. An epigenetic biomarker of aging for lifespan and healthspan. Aging Albany NY 10, 573–591. [DOI] [PMC free article] [PubMed] [Google Scholar]
- 30.Liu Z, Kuo P-L, Horvath S, Crimmins E, Ferrucci L, Levine M, 2018. Phenotypic Age: a novel signature of mortality and morbidity risk bioRxiv.
- 31.Manly JJ, Jacobs DM, Touradji P, Small SA, Stern Y, 2002. Reading level attenuates differences in neuropsychological test performance between African American and White elders. J Int Neuropsychol Soc 8, 341–348. [DOI] [PubMed] [Google Scholar]
- 32.McEwen BS, 2012. Brain on stress: how the social environment gets under the skin. Proc Natl Acad Sci U S A 109 Suppl 2, 17180–17185. [DOI] [PMC free article] [PubMed] [Google Scholar]
- 33.Murray CJ, Kulkarni SC, Michaud C, Tomijima N, Bulzacchelli MT, Iandiorio TJ, Ezzati M, 2006. Eight Americas: investigating mortality disparities across races, counties, and race-counties in the United States. PLoS Med 3, e260. [DOI] [PMC free article] [PubMed] [Google Scholar]
- 34. National Center for Health Statistics, Mortality Data.
- 35. National Institute on Aging, Research Goal E: Improve our ability to reduce health disparities and eliminate health inequities among older adults.
- 36.Puterman E, Gemmill A, Karasek D, Weir D, Adler NE, Prather AA, Epel ES, 2016. Lifespan adversity and later adulthood telomere length in the nationally representative US Health and Retirement Study. Proc Natl Acad Sci U S A 113, E6335–E6342. [DOI] [PMC free article] [PubMed] [Google Scholar]
- 37.Quach A, Levine ME, Tanaka T, Lu AT, Chen BH, Ferrucci L, Ritz B, Bandinelli S, Neuhouser ML, Beasley JM, Snetselaar L, Wallace RB, Tsao PS, Absher D, Assimes TL, Stewart JD, Li Y, Hou L, Baccarelli AA, Whitsel EA, Horvath S, 2017. Epigenetic clock analysis of diet, exercise, education, and lifestyle factors. Aging (Albany NY) 9, 419–446. [DOI] [PMC free article] [PubMed] [Google Scholar]
- 38.Razzoli M, Nyuyki-Dufe K, Gurney A, Erickson C, McCallum J, Spielman N, Marzullo M, Patricelli J, Kurata M, Pope EA, Touma C, Palme R, Largaespada DA, Allison DB, Bartolomucci A, 2018. Social stress shortens lifespan in mice. Aging Cell, e12778. [DOI] [PMC free article] [PubMed]
- 39.Rewak M, Buka S, Prescott J, De Vivo I, Loucks EB, Kawachi I, Non AL, Kubzansky LD, 2014. Race-related health disparities and biological aging: does rate of telomere shortening differ across blacks and whites? Biol Psychol 99, 92–99. [DOI] [PMC free article] [PubMed] [Google Scholar]
- 40.Robertson T, Batty GD, Der G, Fenton C, Shiels PG, Benzeval M, 2013. Is socioeconomic status associated with biological aging as measured by telomere length? Epidemiol Rev 35, 98–111. [DOI] [PMC free article] [PubMed] [Google Scholar]
- 41.Seeman TE, McEwen BS, Rowe JW, Singer BH, 2001. Allostatic load as a marker of cumulative biological risk: MacArthur studies of successful aging. Proc Natl Acad Sci U S A 98, 4770–4775. [DOI] [PMC free article] [PubMed] [Google Scholar]
- 42.The Women’s Health Initiative Study Group, 1998. Design of the Women’s Health Initiative Clinical Trial and Observational Study. Controlled Clinical Trials 19, 61–109. [DOI] [PubMed] [Google Scholar]
- 43.Tingley D, Yamamoto T, Hirose K, Keele L, Imai K, 2014. Mediation: R package for causal mediation analysis
- 44.Wojcicki JM, Olveda R, Heyman MB, Elwan D, Lin J, Blackburn E, Epel E, 2016. Cord blood telomere length in Latino infants: relation with maternal education and infant sex. J Perinatol 36, 235–241. [DOI] [PubMed] [Google Scholar]
- 45.Zannas AS, Arloth J, Carrillo-Roa T, Iurato S, Roh S, Ressler KJ, Nemeroff CB, Smith AK, Bradley B, Heim C, Menke A, Lange JF, Bruckl T, Ising M, Wray NR, Erhardt A, Binder EB, Mehta D, 2015. Lifetime stress accelerates epigenetic aging in an urban, African American cohort: relevance of glucocorticoid signaling. Genome Biol 16, 266. [DOI] [PMC free article] [PubMed] [Google Scholar]
- 46.Zhang FF, Cardarelli R, Carroll J, Fulda KG, Kaur M, Gonzalez K, Vishwanatha JK, Santella RM, Morabia A, 2011. Significant differences in global genomic DNA methylation by gender and race/ethnicity in peripheral blood. Epigenetics 6, 623–629. [DOI] [PMC free article] [PubMed] [Google Scholar]
Associated Data
This section collects any data citations, data availability statements, or supplementary materials included in this article.