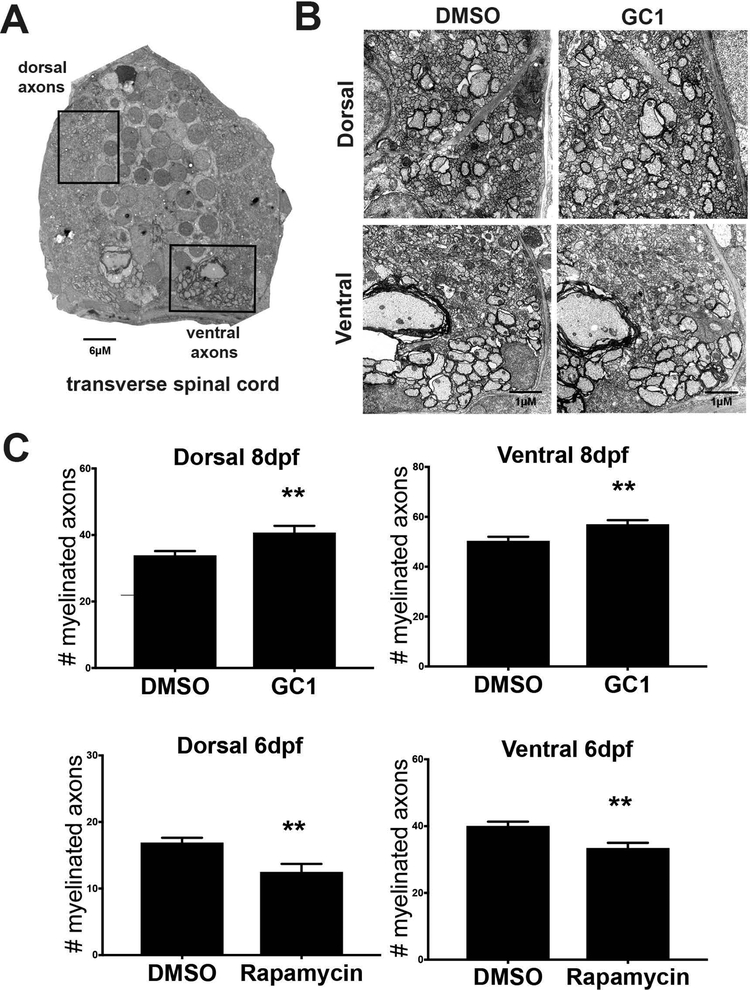
Figure 7: Electron micrograph analysis of myelinated axons following drug treatment.
Transverse spinal cord sections were collected from wildtype larvae following drug treatment with 10nM GC1 (2–8dpf) or 20μM rapamycin (2–6dpf). A representative image (A) shows dorsal and ventral regions of the spinal cord containing myelinated axons. Boxed areas were used for detailed analysis (scale bar=6μM). Myelinated axons were imaged at high magnification (B, image shown is from 8dpf, scale bar=1μM) and quantified (C). Electron micrograph analysis showed that GC1 treatment increased the number of myelinated axons in both the dorsal and ventral spinal cord of fish treated from 2–8dpf, while rapamycin treatment 2–6dpf decreased the number of myelinated axons in both the dorsal and ventral spinal cord. (statistical analysis: unpaired t-test, p<0.05* <0.01** <0.001*** <0.0001****)

