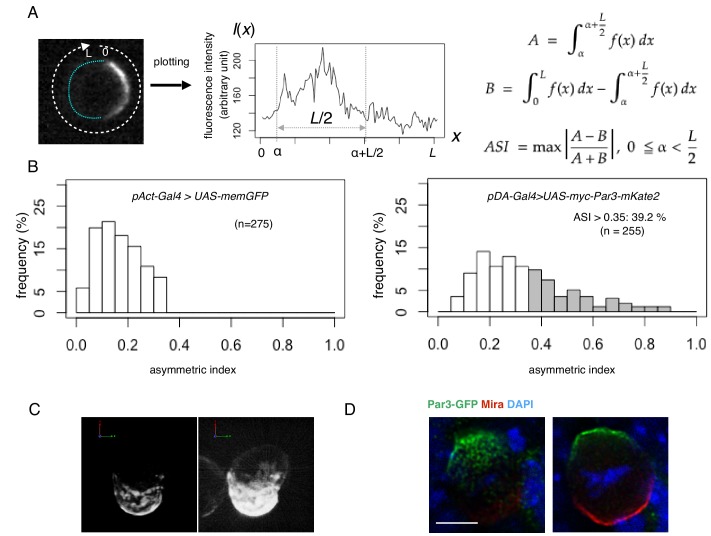
Figure 3. Quantification of cell polarity and 3D imaging.
(A) Definition of the asymmetric index (ASI). ASI is defined by the maximum difference in the cumulative intensity of fluorescence (such as Par3-mKate2 and Par6-GFP) between a half cell perimeter and the other half at the equatorial plane of the cell, normalized via dividing by the cumulative intensity of the entire cell perimeter. (B) ASI distribution was compared between cells expressing memGFP and those expressing Par3-mKate2 at the cell cortex, both of which were driven by the Act-Gal4xUAS system. ASI value of memGFP is distributed broadly and ranges from 0 to 0.35. The mean value = 0.17 ± 0.08 (s.d.). In the all following figures, the numerical value after ± is s.d.. Since memGFP, in principle, has no ability to polarize, such a wide distribution originated from the fluctuation of random distribution along the equatorial cell perimeter and also from the existence of local membrane flairs. Distribution of ASI for cells showing cortical Par3 distribution (mean = 0.34 ± 0.18) may be categorized into two groups (Figure 3A, B); a group of cells show low ASIs overlapping with those of cells expressing memGFP in the range from 0 to 0.35, indicating that cells belonging to this group are essentially non-polarized. The ASI values of the other group (approximately 39%), are broadly distribute, but display ASI values larger than the ASI distribution of mem-GFP cells (ASI > 0.35, mean value = 0.52 ± 0.14). (C) 3-D reconstructed image of a cell overexpressing myc-Par3-mKate2 (left). In the right side image, brightness and contrast were adjusted to visualize the outline of the same cell. The time-lapse movie of a different cell is shown as Video 1. (D) Localization of the Par3-GFP in a mitotic neuroblast of a Drosophila brain expressing Par3-GFP, taken from a third instar larvae and stained for GFP (green) and Miranda (red, Ikeshima-Kataoka et al., 1997). The image were deconvolved. This neuroblast is tilted so that the apical pole (where Par3-GFP distributed) is on the near side, and the basal pole (where Miranda distributed) is on the far side. The left panel shows the image of a single focal plane near an apico-lateral surface. The right panel shows the image of the equatorial plane. Scale bar, 5 μm.

