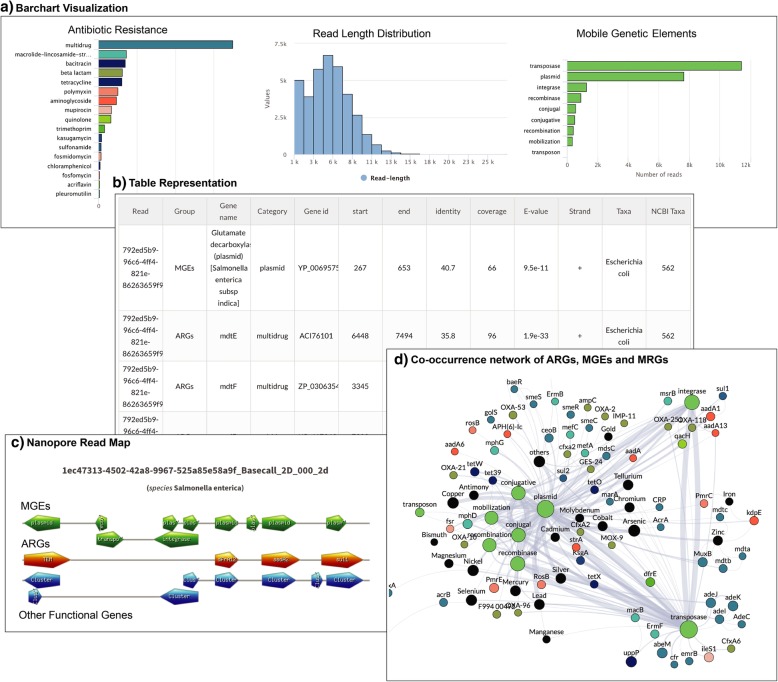
Fig. 5.
Visualization of NanoARG report. a Absolute abundances (read counts) are shown as bar charts as well as read length distribution and taxonomic counts. b Tabular data: results are also shown in tables containing all the relevant information for each annotation (E-value, coverage, identity, strand (forward, reverse), taxonomy, group, etc.). c Nanopore Read Map: this visualization organizes the gene matches in a linear format showing the co-occurrence patterns for each nanopore read with at least one ARG. d Co-occurrence Network of ARGs, MGEs, and MRGs: this interactive visualization allows users to drag and drop nodes to visualize the co-occurrence patterns in the sample

