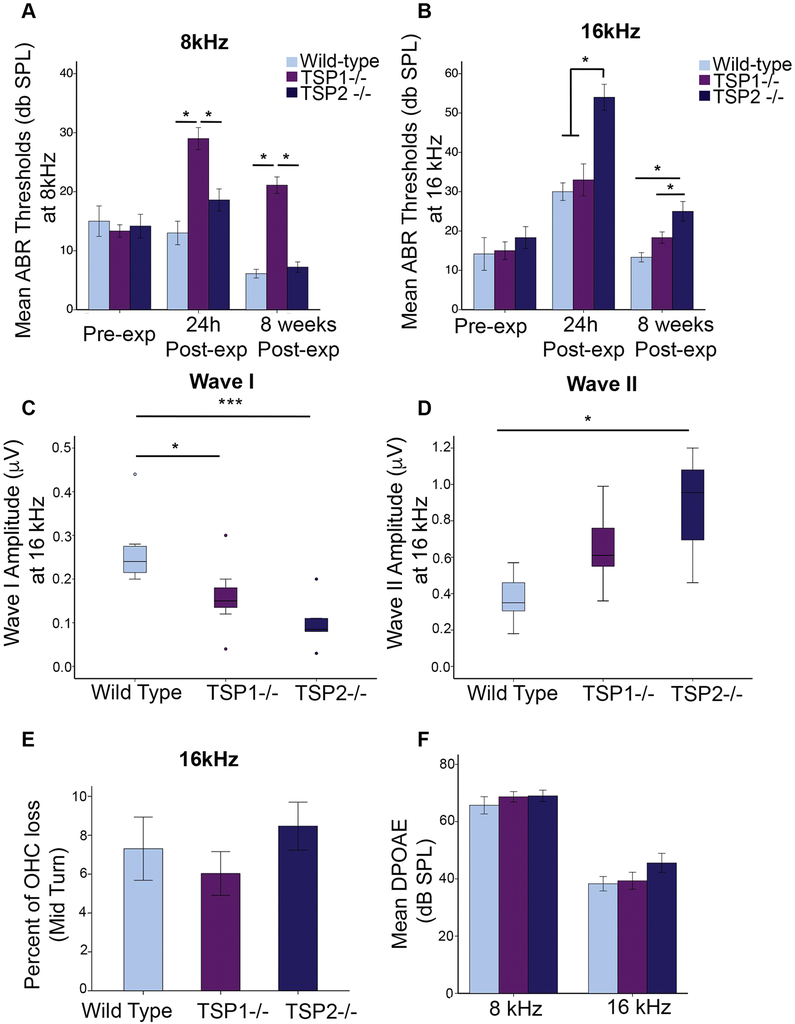
Figure 4. Assessment of ABR thresholds in wild type and TSP mutant mice before and after noise exposure.
Compared ABR thresholds between WT and TSP mutants before and after noise exposure and at both frequencies 8kHz (A) and 16 kHz (B) At 8kHz only TSP1−/− exhibited a PTS when compared to WT mice (A). At 16kHz all genotypes revealed ABR threshold shift 24h after exposure but only TSP2−/− ABR threshold remained shifted 8 weeks after exposure (B). ABR wave I amplitude measured 30 dB above the threshold and at 16 kHz was decreased in noise exposed TSP2−/− (C). (D) ABR wave II was increased in noise exposed TSP2-/−. The solid line in the middle of each box represents the median. The box represents the middle 50% and the whiskers represent the upper and lower 25%. Circles represent mild outliers. (E) OHC counts in the mid turn or around the 16 kHz region. (F) DPOAE readings (8 weeks post-exposure) at 8 and 16 kHz frequencies. DPOAE thresholds and OHC counts were comparable to those of the FVB control mice. Results are expressed as mean ± SEM. Significant differences are indicated by *p < 0.05, ***p<0.001.

