Abstract
Background
The purpose of this study was to evaluate the alteration of the gut microbiota and its effect on adenosine monophosphate-activated protein kinase (AMPK)/nicotinamide adenine dinucleotide phosphate oxidase (NADPH oxidase) signaling pathway in two-kidney one-clip (2K1C) rats.
Methods
The 2K1C rat models were established. The rats were randomly divided into the following 2 groups: 2K1C group and sham group. Alterations of the gut microbiota were analyzed based on the high throughput sequencing method. Plasma concentrations of short chain fatty acids (SCFAs) were measured by chromatography. The protein expression of phosphorylated AMPK and acetyl-CoA carboxylase (ACC) was determined by western blotting. NADPH oxidase activity was measured by a luminometer.
Results
Microbial community analyses revealed that the structure and composition of the gut microbiota were significantly disrupted in 2K1C rats when compared to sham rats. This disruption was associated with the drastic increase in relative abundance of the genera Prevotella and the decrease in SCFA-producing bacterial population. We further confirm that SCFAs produced by the gut microbiota influence NADPH oxidase activity through AMPK.
Conclusions
Our data implicated the important role of gut microbiota in the regulation of AMPK/NADPH oxidase signaling pathway.
1. Background
Hypertension has been recognized as a serious public health problem because it remains the most prevalent risk factor for cardiovascular disease [1]. Renovascular hypertension (RVH) represents a secondary form of hypertension resulting from atherosclerotic disease or fibromuscular dysplasia (FMD) of the renal arteries [2]. Although the pathophysiology of RVH is complex, the important causes involve the activation of the renin-angiotensin-aldosterone system (RAAS) and the presence of inflammation and oxidative stress responses [3, 4]. The 2K1C model is a long-established and widely employed model of hypertension in the study of RVH [5].
The intestine of an adult human is inhabited by diverse microorganisms, the diversity of which is estimated to be 36,000 bacterial species [6]. A growing body of evidence indicated that the gut microbiota exerted important influences on the development of hypertension [7, 8]. Researchers have identified multiple possible hypotheses to link dysbiosis and hypertension, such as modulation of endothelial-derived nitric oxide (NO) and chronic inflammation [9, 10]. Recently, many studies focused on the role of byproducts of gut microbial metabolism such as short chain fatty acids (SCFAs), which are generally thought to affect several molecular changes associated with improved cardiovascular health and function [11].
The adenosine monophosphate-activated protein kinase (AMPK)/nicotinamide adenine dinucleotide phosphate (NADPH) oxidase signaling pathway is involved in the inflammatory and oxidative stress responses and plays an important role in the regulation of cardiovascular function [12]. Growing evidence also suggested that gut microbiota regulated AMPK activity [13]. However, additional research is needed to determine whether the AMPK/NADPH oxidase signaling pathway is involved in the gut microbiota regulation of oxidative stress response in 2K1C rats.
The purpose of this study was to investigate whether intestinal microbes influence AMPK and NADPH oxidase activity through their metabolism SCFAs, providing a potential theoretical basis for a mechanism of endothelial dysfunction in 2K1C rats.
2. Methods
2.1. Animal Experiments
All procedures performed on rats were approved by the Institutional Animal Care and Use Committee. All operations were performed according to international guidelines concerning the care and treatment of experimental animals. Male Wistar rats aged 7 weeks (body weight, 160 to 180 g) purchased from Vital River Laboratory Animal Technology Co., Ltd. (Beijing, China) were cage housed and maintained in a temperature-controlled room with 12-hour light/dark cycles, with free access to water and standard rat chow. All rats were randomly divided into 2 groups: 2K1C group (n=8) and sham group (n=8). 2K1C model was then established as described in detail previously [14]. In briefly, rats were anaesthetized by intraperitoneal injection of pentobarbitone sodium (50 mg/kg body weight). The surgery was performed to implant a silver clip around the left renal artery. After the operation, the rats were housed individually. Body weight and blood pressure were assessed at the same time every week. For the noninvasive measurement of blood pressure, rats were placed in a warm incubator for 15 minutes. The tail-cuff plethysmography (Chengdu Instrument Factory, Sichuan, China) was connected in a quiet state to record the tail arterial pressure. The measurements were performed three times to calculate the average. At the week 8 after the operation, the animals are sacrificed under deep anesthesia for sample collection.
2.2. Fecal DNA Extraction, Metagenomic Sequencing, and Analysis
Fresh fecal contents were directly collected from the rat's cecum at the end of the study and stored in Sample Protector (TaKaRa, Dalian, China) at −80°C. The MoBio Power Fecal DNA Isolation kit (Mo BioLaboratories, Carlsbad, CA, USA) was used for DNA extraction. The quality of the extracted DNA was examined by agarose gel electrophoresis, and the OD 260/280 was analyzed by spectrophotometry. DNA libraries were prepared from 2 μg of total DNA for each sample using TruSeq DNA LT Sample Prep Kit v2 (Illumina, San Diego, California). Metagenomic sequencing was performed on HiSeq 3000 platform (Illumina, San Diego, California). After removing adapters, the raw reads were filtered to remove low-quality reads and reads that belong to the host. These high-quality reads from the samples were then assembled to contigs using Meta-Velevt. MetaGeneMark was employed to predict open reading frames (ORFs). In addition, a metagenomic catalog was generated based on the samples obtained in this study. Furthermore, the high-quality clean paired-end reads from each sample were aligned by BWA version 0.5.7-6 to the reference genes. Then the relative abundance of genes was predicted as described previously [15].
2.3. Quantitative Polymerase Chain Reaction (qPCR)
Real-time qPCR analysis was carried out on ABI Prism 7500 (Applied Biosystems, California, USA) using Maxima SYBR Green/ROX qPCR Master Mix (2×) (Thermo Scientific, Massachusetts, USA). The primer sequences are showed in Table 1.
Table 1.
Primers used for real-time PCR analyses.
| Target group | Sequence |
|---|---|
| Escherichia | F-GTTAATACCTTTGCTCATTGA |
| R-ACCAGGGTATCTAATCCTGTT | |
| Bifidobacterium | F-CGCGTCYGGTGTGAAAG |
| R-CCCCACATCCAGCATCCA | |
| Bacteroidetes | F-AGCAGTAGGGAATCTTCCA |
| R-CACCGCTACACATGGAG |
2.4. Measurement of Malondialdehyde (MDA) Concentration and Superoxide Dismutase (SOD) Activity
At the end of experiment, rats were sacrificed under deep anesthesia and thoracic aorta was quickly excised. After removing the adhering fat, aortic specimen was rinsed in a cool normal saline and was homogenized in a solution containing 250 mmol/l sucrose, 1 mmol/l EDTA, 0.1 mmo/l phenylmethylsulfonyl fluoride (PMSF), and 20 mmol/l potassium phosphate buffer at pH 7.6. The aorta homogenate was then centrifuged at 10,000 g for 5 min to collect the supernatant. The SOD activity and MDA content in the aorta homogenate were assayed using the commercial kits (Nanjing Jiancheng Bioengineering Institute, Nanjing, China).
2.5. SCFAs Extraction and Analysis
Plasma concentrations of SCFAs were measured as previously described [16]. Briefly, 100 μl of plasma were diluted in acidified water spiked with stable isotope-labelled internal standards. Then, SCFA samples were extracted with 2 ml diethyl ether and were measured in an Agilent 6890 gas chromatography (GC) coupled with mass spectrometry (Agilent Technologies, Wilmington, DE, USA). The GC was equipped with a ZB-WAX column (Phenomenex, Cheshire, UK). For the measurement of fecal SCFAs levels, 100 mg fecal contents were mashed in acidic water (pH=2.4) and centrifuged at 12,000 g for 20 min at 4°C. The supernatants were then taken for analysis as previously described [17].
2.6. Western Blot Analysis
For western blotting analysis, tissue samples were homogenized in ice-cold cell lysis buffer (Beyotime, Shanghai, China) and the lysates were centrifuged at 12,000×g for 20 min at 4°C. The protein concentrations were determined by bicinchoninic acid (BCA) assay (Sigma-Aldrich, St. Louis, MO, USA). The protein samples were then subjected to gel electrophoresis and quantitative western blotting. The following antibodies were used: anti-AMPK, anti-p-AMPKT172, anti-acetyl-CoA carboxylase (ACC), anti-p-ACCS79, and anti-β-Actin (Abcam, Cambridge, UK). The specific bands were detected with an enhanced chemiluminescence detection system (Sage Creation, Beijing, China).
2.7. Cell Culture and Measurement of NADPH Oxidase Activity
HAECs (human aortic endothelial cells) were cultured in endothelial cell growth medium (EGM), which consists of EBM endothelial cell basal medium supplemented with the EBM-bullet kit reagents (Clonetics, Walkersville, MD, USA) and 2% fetal bovine serum. At confluence, HAECs were exposed to Angiotensin II (AngII, 200 nM) for 4 hours as described previously [18], and then stimulated by acetate (10 μg/ml) in the presence or absence of Compound C (20 μM, Sigma-Aldrich, St. Louis, MO, USA) for 10 min. For measurement of NADPH oxidase activity, cells were washed with ice-cold Hanks' balanced salt solution (HBSS) and lysed in cell lysis buffer (Cell Signaling Technology, Boston, MA, USA). The cell lysates were centrifuged for 10 min at 12,000 g. The lysates were then mixed with NADPH (100 μM), lucigenin (5 μΜ), HBSS buffer, and water in 96-well plates and incubated for 30 min at 37°C. NADPH oxidase activity was measured by photon emission from the chromogenic substrate lucigenin in a luminometer (Berthold, NH, USA) at 450 nm wavelength. The levels were expressed as relative light units/min/mg of total protein.
2.8. Analysis of NO Level
Because of low concentrations and short half-life of NO in vivo, we determined the concentration of serum NO by measuring its stable metabolites nitrite (NO2−) and nitrate (NO3−) as described previously by Miranda et al. [19]. The concentration of NO in conditioned media of HAECs was estimated using a commercial kit (Nanjing Jiancheng Bioengineering Institute, Nanjing, China) in accordance with the manufacturer's instructions.
2.9. Statistical Analysis
Statistical analysis was performed with SPSS20.0 software. Data were analyzed for normal distribution with the independent t-test or paired t-test. The independent t-test was used in comparing between 2K1C group and sham group. Paired t-test was used in comparing the body weight, blood pressure and related knowledge on RVH before and after intervention. The values were expressed as mean ± standard error of the mean (SEM). Values of P < 0.05 were considered statistically significant.
3. Results
3.1. Establishment of 2K1C Hypertensive Rats
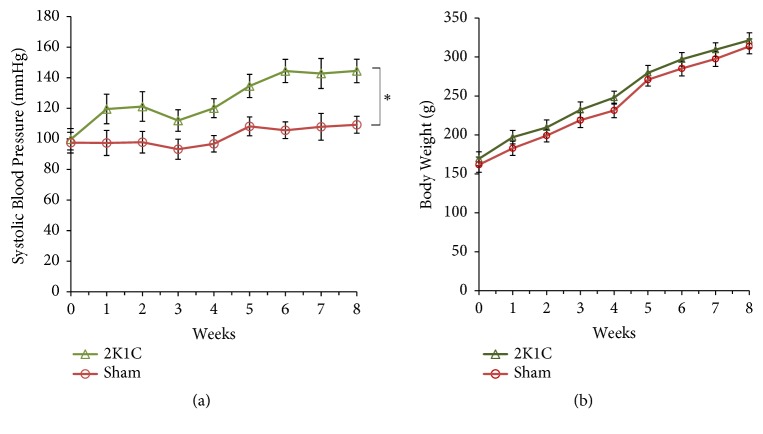
Firstly, we developed and evaluated 2K1C model. As showed in Figure 1(a) the systolic blood pressure (SBP) was significantly increased in 2K1C rats when compared with sham group (P<0.05). Body weight is presented in Figure 1(b). There was no significant difference among the groups.
Figure 1.
Establishment of 2K1C hypertensive rats. (a) SBP across experiment for 2K1C and sham-operated rats during a 8-week period. Values are expressed as the means ± SE, n = 8 rats per group. ∗P<0.05, vs sham group. (b) Body weight of the animals from the different experimental groups. Values are expressed as the means ± SE, n = 8 rats per group. ∗P<0.05 vs sham group.
3.2. Taxonomy-Based Comparisons of Gut Microbiota at the Phylum and Genus Levels
As showed in Figure 2(a), the composition of gut microbiota of all rats was mainly characterized by the phyla Bacteroidetes, Firmicutes, Proteobacteria, Actinobacteria, and Cyanobacteria. There were marked differences in the distribution of phyla between two groups. These results showed a reduction in Firmicutes and an increase in Bacteroidetes in 2K1C rats compared to sham controls (P<0.05). However, there were no significant differences in Proteobacteria, Actinobacteria, and Cyanobacteria between two groups (P>0.05) (Figure 2(a)).
Figure 2.
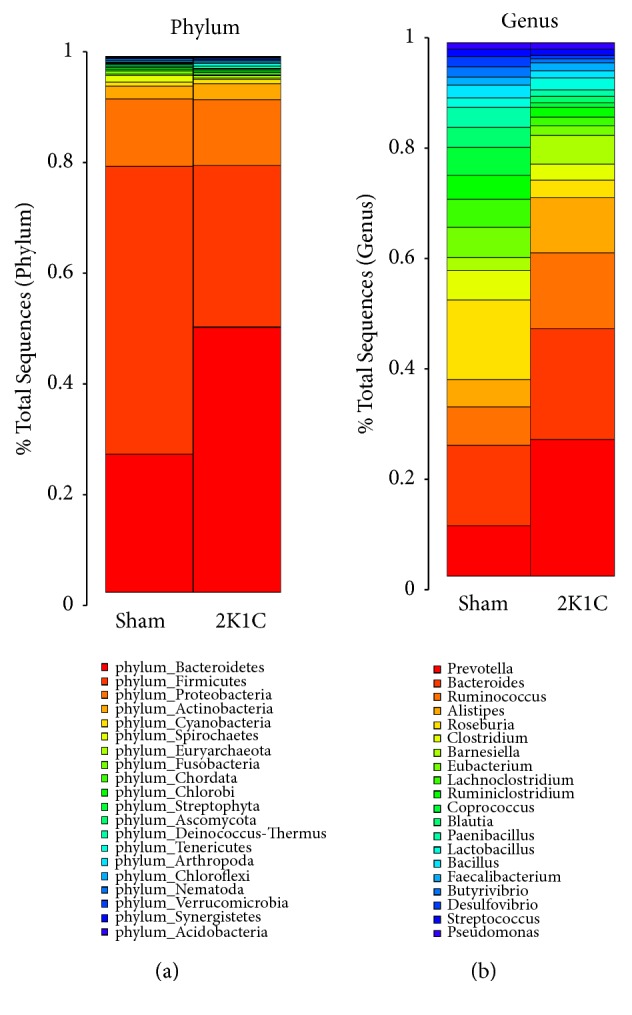
The relative abundance of microbial species in 2K1C rats (n=8) and sham rats (n=8) fecal samples. (a) Taxonomic summary of the gut microbiota at phylum level. (b) Taxonomic summary of the gut microbiota at genus level.
We next analyzed the differences in the distribution of genus between 2K1C and sham groups (Figure 2(b)). Increased abundance of the genera Prevotella, Bacteroides, Alistipes, and Barnesiella within the Bacteroidetes phylum was detected (P<0.05) in 2K1C rats. Within the Firmicutes phylum, the abundance of the genera Lactobacillus and Ruminococcus was increased (P<0.05), but Coprococcus, Roseburia, Blautia, Clostridium, Eubacterium, Lachnoclostridium, Ruminiclostridium, Paenibacillus, Bacillus, and Butyrivibrio were decreased (P<0.05). Additionally, the relative abundance of Desulfovibrio genus within the Proteobacteria phylum was significantly lower in 2K1C rats than that in sham controls (P<0.05). However, the abundance of the genera Streptococcus and Faecalibacterium within the Firmicutes phylum and the genus Pseudomonas within the Proteobacteria phylum did not differ significantly between two groups (P>0.05).
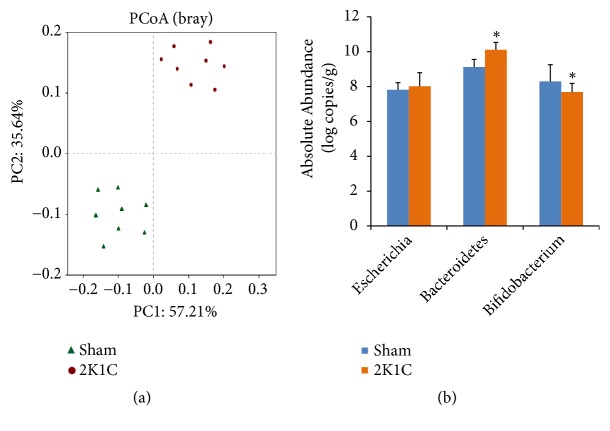
The results of principal coordinate analysis (PCoA) revealed major shifts in the gut microbiota composition between two groups (Figure 3(a)). Moreover, qPCR data showed significant increases of Bacteroidetes spp. and reduction of Bifidobacterium spp. in 2K1C group compared to sham group (P<0.05) (Figure 3(b)). However, no obvious difference was found in Escherichia spp. population (P>0.05).
Figure 3.
Compositional and structural shifts of gut microbiota in 2K1C rats (n=8) and sham rats (n=8) fecal samples. (a) PCoA analysis of gut microbiota from 2K1C rats and sham rats. (b) Quantitative PCR analysis of three representative bacteria. Values are expressed as the means ± SE. ∗P<0.05 vs sham group.
3.3. Measurement the Levels of SOD, MDA, and NO
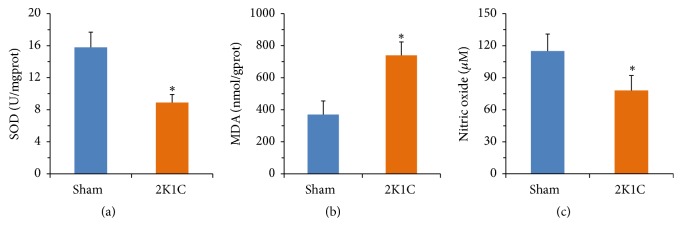
The SOD activity was decreased in aorta of 2K1C rats when compared with sham rats (P<0.05) (Figure 4(a)). However, the MDA level was significantly enhanced in 2K1C rats (P<0.05) (Figure 4(b)). The serum NO measurements are presented in Figure 4(c). The serum NO concentration in 2K1C rats was significantly lower than sham group (P<0.05).
Figure 4.
The levels of SOD, MDA, and NO in rats. Values are expressed as the means ± SE, n = 8 rats per group. ∗P<0.05 vs sham group.
3.4. Measurement the Levels of Plasma SCFAs
Compared with sham rats, plasma levels of acetate and butyrate were significantly decreased in 2K1C rats (P<0.05) (Figures 5(a) and 5(b)), suggesting that differential bacterial community affects plasma SCFA levels. Hexanoate was not different between two groups (P>0.05) (Figure 5(c)). Similarly, fecal levels of acetate and butyrate were significantly decreased in 2K1C rats compared with sham rats (P<0.05) (Figure S1).
Figure 5.
Plasma SCFAs levels in rats. Values are expressed as the means ± SE, n = 8 rats per group. ∗P<0.05 vs sham group.
3.5. Measurement the Phosphorylation Levels of AMPK
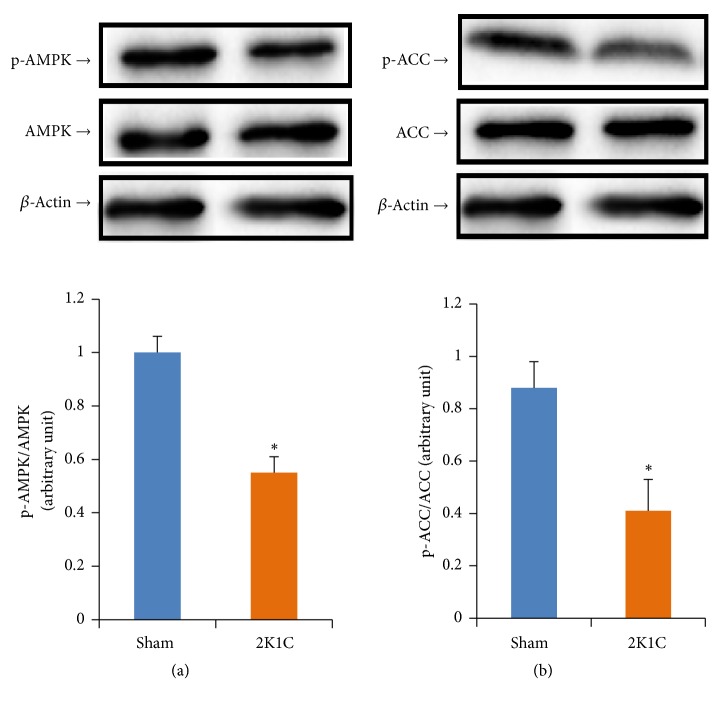
Western blot analysis demonstrated that AMPK and ACC phosphorylations were significantly attenuated in 2K1C rats (P<0.05) (Figure 6). However, the expressions of total AMPK and ACC were not altered (P>0.05) (Figure 6).
Figure 6.
The phosphorylation levels of (a) AMPK and (b) ACC in aortas. Values are expressed as the means ± SE, n = 8 rats per group. ∗P<0.05 vs sham group.
3.6. Acetate Affected NADPH Oxidases Activity and NO Secretion via AMPK
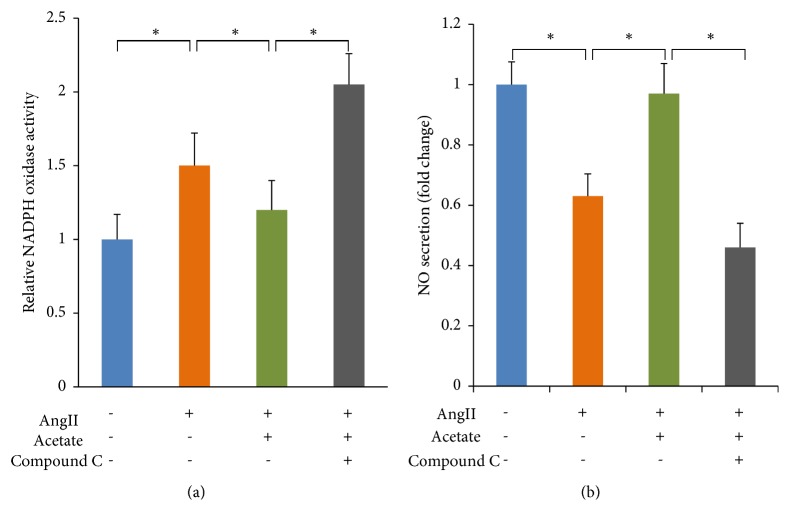
Figure 7(a) showed that acetate significantly decreased NADPH oxidases activity (P<0.05). Inhibition of AMPK blocked the acetate-induced decrease in NADPH oxidases activity. Figure 7(b) showed that the NO level was increased significantly in acetate-treated HAECs (P<0.05). Similarly, the acetate-induced increase in NO secretion was abolished by Compound C, indicating that this effect of acetate was mediated by AMPK.
Figure 7.
The effects of acetate on the activity of NADPH oxidase in HAECs and the level of NO in conditioned media of HAECs. (a) Effect of acetate on the activity of NADPH oxidase. (b) Effect of acetate on the level of NO. ∗P<0.05 vs sham group.
4. Discussion
The involvement of gut microbiota in regulating hypertension is unequivocally established in the literature [20]. However, to our knowledge, there are no gut microbiotal studies reported in 2K1C models.
Our study provided the first evidence of an association of RVH with altered gut microbiota with the use of 2K1C model. In the present study, gut microbiota composition and diversity were analyzed based on the high throughput sequencing method. Firmicutes and Bacteroidetes were the most dominant among the 20 phyla in the samples, which is consistent with the previous reports [21]. In order to further study the alterations of the gut microbiota in 2K1C model, taxonomy-based comparisons of gut microbiota at the genus level were explored. Interestingly, drastic increase in the relative abundance of the genera Prevotella within the Bacteroidetes phylum was detected in 2K1C rats (18.2%) when compared with control group (2.9%). Previous studies have shown that the genera Prevotella is more abundant in the intestinal tract of healthy people [22]. However, many recent studies have also suggested that the genera Prevotella may be involved in the pathogenesis of hypertension. Li et al. found Prevotella-dominated gut enterotype and overgrowth of Prevotella in both prehypertensive and hypertensive populations compared to healthy controls, suggesting that Prevotella contributes to the development of hypertension [23]. Our data corroborate these findings.
We further found that structural shift of gut microbiota in 2K1C rats was also associated with decrease in acetate-, butyrate-producing microbial populations, including Roseburia, Clostridium, Eubacterium, Blautia, Butyrivibrio, Bacillus, and Coprococcus. Consistent with the above results, both acetate and butyrate levels were lower in 2K1C group, which was accompanied by increased level of MDA, and decreased activity of SOD. It has been reported that SOD activity and MDA content were attributed to the endothelial function [24].
As the end products of fermentation by the gut microbiota, SCFAs play critical roles in maintaining a healthy cardiovascular function [25]. Recently, Ganesh et al. also reported that acetate plays a key role in the regulation of blood pressure [26]. In order to determine whether SCFAs participate in the regulation of oxidative stress status in 2K1C rats, we assessed the effects of acetate (representing the SCFA) on the activity of NADPH oxidase. Our results showed that acetate significantly decreased NADPH oxidase activity. More importantly, these effects of acetate were abolished by Compound C, an AMPK inhibitor, indicating that acetate decreased NADPH oxidase activity via activation of AMPK. Consistently, we found that acetate induced increase of the NO level in an AMPK-dependent manner. It is well known that the increase of NADPH oxidase activity impairs vascular endothelial function through superoxide (O2−) production [27]. Thus, our results provide the necessary basis to further examine relationship between the alteration of gut microbiota and endothelial dysfunction in 2K1C rats.
5. Limitations
The current study also has some limitations. First, the overall activity of NADPH oxidase activity but not the activity of each NADPH oxidase isoform was measured in this study. Activation of different NADPH oxidase isoforms might have different effects on endothelial function. Thus, further research is needed to investigate the activity of each NADPH oxidase isoform in both 2K1C rats and HAECs. Second, SCFAs derived from both bacterial fermentation and other different sources. Therefore, the respective roles and interactions of gut microbiota and SCFAs in 2K1C rats need to be further clarified. Third, AMPK can be activated by entirely different events. The deeper signaling mechanisms that SCFAs regulate AMPK/NADPH oxidase signaling pathway are still needed to be demonstrated by further studies.
6. Conclusions
The results of this study demonstrated the diversity of gut microbiota and its important role in the regulation of AMPK/NADPH oxidase signaling pathway in 2K1C rats. Although additional study is needed to validate this signaling pathway, the results provide new insights into the theoretic basis of gut microbiota-mediated regulation of endothelial dysfunction.
Acknowledgments
This research was funded by National Natural Science Foundation of China (81460049, 81560057, and 81660048) and the Sail Plan of Baotou Medical College (BYJJ-YF-201745). The funding body had no role in study design, data collection and analysis, or preparation of the manuscript.
Abbreviations
- AAA:
Abdominal aortic aneurysm
- ACC:
Acetyl-CoA carboxylase
- AMPK:
Adenosine monophosphate-activated protein kinase
- AngII:
Angiotensin II
- BCA:
Bicinchoninic acid
- EGM:
Endothelial cell growth medium
- FMD:
Fibromuscular dysplasia
- GC:
Gas chromatography
- HAEC:
Human aortic endothelial cell
- HBSS:
Hanks' balanced salt solution
- MDA:
Malondialdehyde
- NADPH:
Nicotinamide adenine dinucleotide phosphate
- NO:
Nitric oxide
- ORF:
Open reading frame
- PCoA:
Principal coordinate analysis
- PMSF:
Phenylmethylsulfonyl fluoride
- qPCR:
Quantitative polymerase chain reaction
- RAAS:
Renin-angiotensin-aldosterone system
- RVH:
Renovascular hypertension
- SBP:
Systolic blood pressure
- SCFA:
Short chain fatty acid
- SOD:
Superoxide dismutase
- 2K1C:
Two-kidney one-clip.
Data Availability
All data generated or analyzed during this study are included in this published article or available from the corresponding author upon reasonable request.
Ethical Approval
The study design was approved by the Institutional Animal Care and Use Committee of the Baotou Medical College.
Conflicts of Interest
The authors declare that they have no conflicts of interest.
Authors' Contributions
Hui Yu conducted the study, collected the data, performed analysis of the data, and prepared the manuscript; Lei Qin conducted the study and performed analysis of the data; Hai Hu was responsible for data collection; Zhanli Wang designed and supported the study and edited the manuscript. All authors approved the final version of the manuscript.
Supplementary Materials
Figure S1: fecal SCFAs levels in rats. Values are expressed as the means ± SE, n = 8 rats per group. ∗P<0.05 vs sham group.
References
- 1.Manolis A., Doumas M. Sexual dysfunction: the 'prima ballerina' of hypertension-related quality-of-life complications. Journal of Hypertension. 2008;26(11):2074–2084. doi: 10.1097/HJH.0b013e32830dd0c6. [DOI] [PubMed] [Google Scholar]
- 2.Senitko M., Fenves A. Z. An update on renovascular hypertension. Current Cardiology Reports. 2005;7(6):405–411. doi: 10.1007/s11886-005-0057-8. [DOI] [PubMed] [Google Scholar]
- 3.Matavelli L. C., Huang J., Siragy H. M. Angiotensin AT2 receptor stimulation inhibits early renal inflammation in renovascular hypertension. Hypertension. 2011;57(2):308–313. doi: 10.1161/hypertensionaha.110.164202. [DOI] [PMC free article] [PubMed] [Google Scholar]
- 4.Chen J. K., Zhao T., Ni M., Li D. J., Tao X., Shen F. M. Downregulation of alpha7 nicotinic acetylcholine receptor in two-kidney one-clip hypertensive rats. BMC Cardiovascular Disorders. 2012;12(1, article 38) doi: 10.1186/1471-2261-12-38. [DOI] [PMC free article] [PubMed] [Google Scholar]
- 5.Cuevas C. A., Tapia-Rojas C., Cespedes C., Inestrosa N. C., Vio C. P. β-catenin-dependent signaling pathway contributes to renal fibrosis in hypertensive rats. BioMed Research International. 2015;2015:13. doi: 10.1155/2015/726012.726012 [DOI] [PMC free article] [PubMed] [Google Scholar]
- 6.Zhang M.-M., Cheng J.-Q., Xia L., Lu Y.-R., Wu X.-T. Monitoring intestinal microbiota profile: a promising method for the ultraearly detection of colorectal cancer. Medical Hypotheses. 2011;76(5):670–672. doi: 10.1016/j.mehy.2011.01.028. [DOI] [PubMed] [Google Scholar]
- 7.Petriz B. A., Castro A. P., Almeida J. A., et al. Exercise induction of gut microbiota modifications in obese, non-obese and hypertensive rats. BMC Genomics. 2014;15, article no. 511 doi: 10.1186/1471-2164-15-511. [DOI] [PMC free article] [PubMed] [Google Scholar]
- 8.Yang T., Santisteban M. M., Rodriguez V., et al. Gut dysbiosis is linked to hypertension. Hypertension. 2015;65(6):1331–1340. doi: 10.1161/hypertensionaha.115.05315. [DOI] [PMC free article] [PubMed] [Google Scholar]
- 9.Gee L. C., Ahluwalia A. Dietary nitrate lowers blood pressure: epidemiological, pre-clinical experimental and clinical trial evidence. Current Hypertension Reports. 2016;18(2, article 17) doi: 10.1007/s11906-015-0623-4. [DOI] [PMC free article] [PubMed] [Google Scholar]
- 10.Verdam F. J., Fuentes S., De Jonge C., et al. Human intestinal microbiota composition is associated with local and systemic inflammation in obesity. Obesity. 2013;21(12):E607–E615. doi: 10.1002/oby.20466. [DOI] [PubMed] [Google Scholar]
- 11.Pluznick J. L., Protzko R. J., Gevorgyan H., et al. Olfactory receptor responding to gut microbiota-derived signals plays a role in renin secretion and blood pressure regulation. Proceedings of the National Acadamy of Sciences of the United States of America. 2013;110(11):4410–4415. doi: 10.1073/pnas.1215927110. [DOI] [PMC free article] [PubMed] [Google Scholar]
- 12.Gao D., Zuo Z., Tian J., et al. Activation of SIRT1 attenuates klotho deficiency-induced arterial stiffness and hypertension by enhancing AMP-activated protein kinase activity. Hypertension. 2016;68(5):1191–1199. doi: 10.1161/HYPERTENSIONAHA.116.07709. [DOI] [PMC free article] [PubMed] [Google Scholar]
- 13.Li G., Yao W., Jiang H. Short-chain fatty acids enhance adipocyte differentiation in the stromal vascular fraction of porcine adipose tissue. Journal of Nutrition. 2014;144(12):1887–1895. doi: 10.3945/jn.114.198531. [DOI] [PubMed] [Google Scholar]
- 14.Sun G., Hu H., Tian X., et al. Identification and analysis of microRNAs in the left ventricular myocardium of two-kidney one-clip hypertensive rats. Molecular Medicine Reports. 2013;8(2):339–344. doi: 10.3892/mmr.2013.1549. [DOI] [PubMed] [Google Scholar]
- 15.Xiao L., Sonne S. B., Feng Q., et al. High-fat feeding rather than obesity drives taxonomical and functional changes in the gut microbiota in mice. Microbiome. 2017;5(1, article 43) doi: 10.1186/s40168-017-0258-6. [DOI] [PMC free article] [PubMed] [Google Scholar]
- 16.Den Besten G., Gerding A., Van Dijk T. H., et al. Protection against the metabolic syndrome by guar gum-derived short-chain fatty acids depends on peroxisome proliferator-activated receptor γ and Glucagon-like peptide-1. PLoS ONE. 2015;10(8) doi: 10.1371/journal.pone.0136364.e0136364 [DOI] [PMC free article] [PubMed] [Google Scholar]
- 17.Bier A., Braun T., Khasbab R., et al. A high salt diet modulates the gut microbiota and short chain fatty acids production in a salt-sensitive hypertension rat model. Nutrients. 2018;10(9) doi: 10.3390/nu10091154.E1154 [DOI] [PMC free article] [PubMed] [Google Scholar]
- 18.Dikalov S. I., Nazarewicz R. R., Bikineyeva A., et al. Nox2-induced production of mitochondrial superoxide in angiotensin II-mediated endothelial oxidative stress and hypertension. Antioxidants & Redox Signaling. 2014;20(2):281–294. doi: 10.1089/ars.2012.4918. [DOI] [PMC free article] [PubMed] [Google Scholar]
- 19.Miranda K. M., Espey M. G., Wink D. A. A rapid, simple spectrophotometric method for simultaneous detection of nitrate and nitrite. Nitric Oxide: Biology and Chemistry. 2001;5(1):62–71. doi: 10.1006/niox.2000.0319. [DOI] [PubMed] [Google Scholar]
- 20.Wilck N., Matus M. G., Kearney S. M., et al. Salt-responsive gut commensal modulates TH17 axis and disease. Nature. 2017;551(7682):585–589. doi: 10.1038/nature24628. [DOI] [PMC free article] [PubMed] [Google Scholar]
- 21.Qin J., Li R., Raes J., et al. A human gut microbial gene catalogue established by metagenomic sequencing. Nature. 2010;464(7285):59–65. doi: 10.1038/nature08821. [DOI] [PMC free article] [PubMed] [Google Scholar]
- 22.Kovatcheva-Datchary P., Nilsson A., Akrami R., et al. Dietary fiber-induced improvement in glucose metabolism is associated with increased abundance of prevotella. Cell Metabolism. 2015;22(6):971–982. doi: 10.1016/j.cmet.2015.10.001. [DOI] [PubMed] [Google Scholar]
- 23.Li J., Zhao F., Wang Y., et al. Gut microbiota dysbiosis contributes to the development of hypertension. Microbiome. 2017;5(1):1–19. doi: 10.1186/s40168-016-0222-x. [DOI] [PMC free article] [PubMed] [Google Scholar]
- 24.Yu T.-T., Guo K., Chen H.-C., et al. Effects of traditional Chinese medicine Xin-Ji-Er-Kang formula on 2K1C hypertensive rats: role of oxidative stress and endothelial dysfunction. BMC Complementary and Alternative Medicine. 2013;13(1, article 173) doi: 10.1186/1472-6882-13-173. [DOI] [PMC free article] [PubMed] [Google Scholar]
- 25.Pluznick J. L. Microbial short-chain fatty acids and blood pressure regulation. Current Hypertension Reports. 2017;19(4, article 25) doi: 10.1007/s11906-017-0722-5. [DOI] [PMC free article] [PubMed] [Google Scholar]
- 26.Ganesh B. P., Nelson J. W., Eskew J. R., et al. Prebiotics, probiotics, and acetate supplementation prevent hypertension in a model of obstructive sleep apnea. Hypertension. 2018;72(5):1141–1150. doi: 10.1161/HYPERTENSIONAHA.118.11695. [DOI] [PMC free article] [PubMed] [Google Scholar]
- 27.Wang X., Wang Q., Sun Z. Normal IgG downregulates the intracellular superoxide level and attenuates migration and permeability in human aortic endothelial cells isolated from a hypertensive patient. Hypertension. 2012;60(3):818–826. doi: 10.1161/HYPERTENSIONAHA.112.199281. [DOI] [PMC free article] [PubMed] [Google Scholar]
Associated Data
This section collects any data citations, data availability statements, or supplementary materials included in this article.
Supplementary Materials
Figure S1: fecal SCFAs levels in rats. Values are expressed as the means ± SE, n = 8 rats per group. ∗P<0.05 vs sham group.
Data Availability Statement
All data generated or analyzed during this study are included in this published article or available from the corresponding author upon reasonable request.


