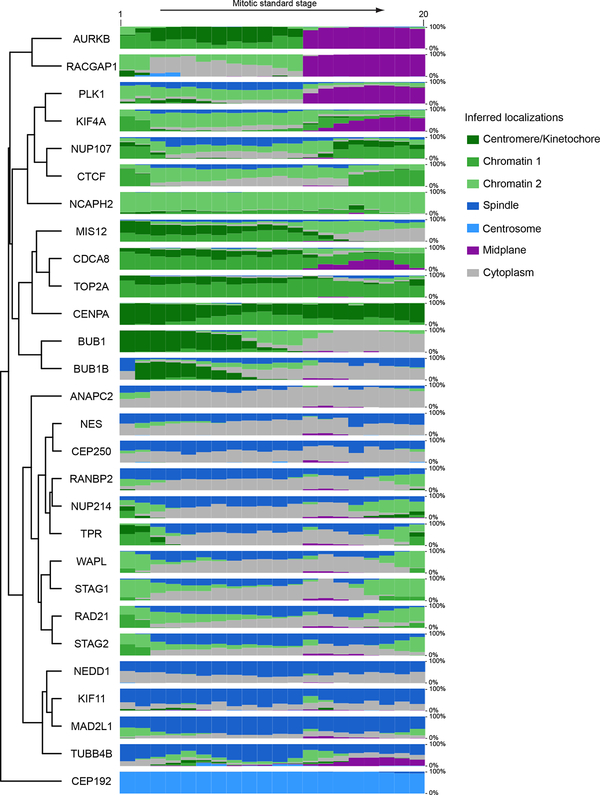
Extended Data Fig. 7 |.
Quantitative evolution of protein subcellular localizations inferred from non-negative tensor factorization of the proteins × features × time tensor. Each subcellular localization cluster was assigned a different color and named using known information on proteins belonging to that cluster. The height of each color band at each time point is proportional to the fraction of the protein amount in the corresponding cluster at that time point. Genes were grouped by complete linkage clustering followed by optimal leaf ordering.

