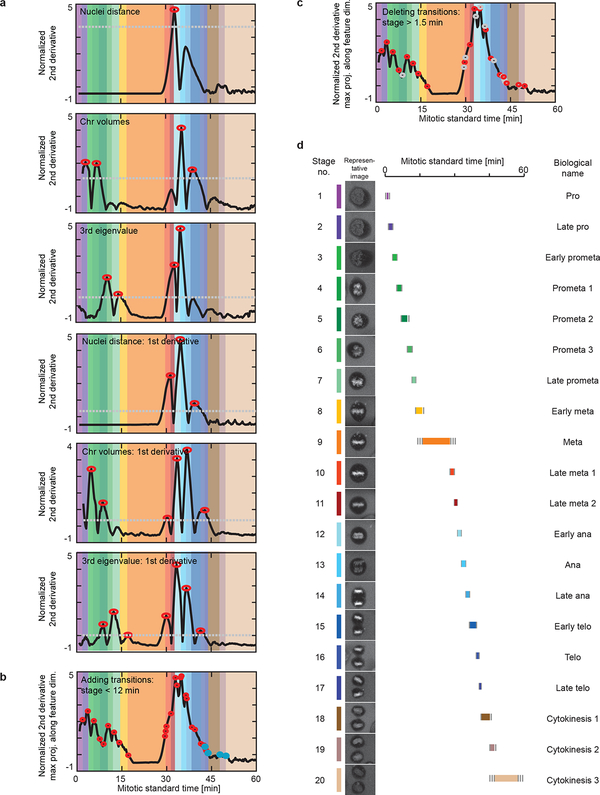
Extended Data Fig. 2 |.
Detection of mitotic standard stages. (a) Detection of major mitotic transitions of the mitotic standard time. Peaks in the second derivatives (red circles) above a pre-defined threshold (grey lines) were detected in all feature dimensions as mitotic transitions. (b) Additional smaller peaks (blue circles) were detected to ensure a maximum duration of 12 minutes for each standard stage. (c) Transitions were deleted (grey circles) such that all stages had a minimal duration of 1.5 minutes. (d) The standard mitotic cell was represented by the cell closest to the average of each stage. Each mitotic stage was assigned duration (colored line), its duration standard deviation (grey line) and a biological annotation.

