Abstract
Tuberculosis (TB) elimination programmes need to target preventive treatment to groups with an increased risk of TB activation, such as individuals with a latent tuberculosis infection (LTBI) acquired recently. Current diagnostic tests for LTBI have poor predictive values for TB activation and there is, at present, no reference method to evaluate new LTBI diagnostic and prognostic tools. Thus, our objective was to develop a mathematical model, independent of currently available diagnostic tests, to estimate the individual probability of recent and/or remote LTBI.
Estimations of recent LTBI were based on the contagiousness of index case, proximity and time of exposure, and environmental factors. Estimation of remote LTBI was based on country of origin, previous stays in high-risk environments or known exposure to TB. Individual probabilities were calculated and compared with tuberculin skin test (TST) and interferon-γ release assay results for 162 contacts of 42 index TB cases.
Probabilities of remote LTBI were 16% for European/American contacts and 38% for African/Asian contacts. The probability of recent LTBI was 35% for close contacts to smear microscopy positive index cases. A higher probability of remote LTBI was seen among TST-positive contacts.
This model may, with further validation, be used as an independent tool to evaluate new diagnostic markers for recent LTBI.
Short abstract
This mathematical model to estimate probability of recent and remote latent TB was based on clinical and epidemiological risk factors of exposure and may be used in the evaluation of new diagnostic markers with enhanced predictive values for TB activation http://bit.ly/2IWi6Ru
Introduction
Today, tuberculosis (TB) is the number one infectious cause of mortality worldwide [1]. The World Health Organization has set the goal of substantially reducing the worldwide TB incidence by 90% by the year 2035 [2]. Up to a quarter of the world's population is estimated to be infected with latent TB (latent tuberculosis infection (LTBI)). ∼10% of these are estimated to progress to active TB [3, 4], mainly during the first 2 years after infection. As such, contacts of active TB cases and newly arrived migrants from highly TB-endemic countries are the main risk groups with an increased probability of activating LTBI in Europe. Other risk groups are individuals with an immunosuppressive condition (e.g. HIV or pregnancy) [5, 6] or treatment with tumour necrosis factor inhibitors, where there is also an increased probability of activating LTBI acquired more remotely [4]. TB elimination programmes specifically need to target groups with LTBI and an increased risk of TB activation to reduce numbers needed to treat (NNT) with preventive treatment.
Current diagnostic tools for LTBI, i.e. the tuberculin skin test (TST) and interferon-γ release assays (IGRAs) such as QuantiFERON TB Gold In-Tube (QFT) (Qiagen, Hilden, the Netherlands) and T-spot.TB (Oxford Immunotec, Abingdon, UK), all detect immunological responses to Mycobacterium tuberculosis antigens but are neither able to distinguish between active TB and LTBI nor differentiate between a recently or a more remotely acquired LTBI. This is of special concern in contact screening of migrants from high TB burden countries with a high probability of being M. tuberculosis infected earlier in life. In addition, a problem in the development and evaluation of tests for LTBI is the lack of a reference method. To overcome this issue, prospective studies of TB activation in individuals with a positive or negative immune reactive test result have been performed, which require large cohorts and prolonged follow-up periods, and thus are both time consuming and costly. A large meta-analysis of TST and QFT predictive capacity have shown low positive predictive values (PPVs) for TB activation within 2 years (1.5% and 2.7%, respectively, overall and 2.4% and 6.8%, respectively, in high-risk groups) [7]. Even for high QFT results (>4 IU·mL−1), PPVs have been poor (2.5% overall and 2.9% in patients with any medical risk factor) [8]. Low PPVs require high NNTs to prevent one case of active TB, especially when considering the total effectiveness of treatment, which also depends on efficacy and adherence. However, the negative predictive values (NPVs) of current standard tests for LTBI are very high (>99%) in immunocompetent individuals. However, indeterminate and false negative results are more common in immunosuppressive conditions [9, 10] with an inherent risk of missing patients in need of preventive treatment.
Thus, there is an urgent need for tests with an improved capability to identify individuals with a recent LTBI and, as such, an increased probability of progression to active TB, i.e. a higher PPV.
Our objective was to develop a mathematical model, independent of currently available diagnostic tests, to estimate the individual probability of recent and/or remote LTBI, which may be used as a tool to evaluate new diagnostic markers with enhanced PPVs for TB activation.
Material and methods
The probability of becoming infected upon exposure to M. tuberculosis is mainly exogenous in nature, i.e. the summarised amount of M. tuberculosis inhaled, which depends on several features such as the contagiousness of the index case, proximity and time of exposure, and type of environment. The probability of developing active disease after infection is mainly endogenous in nature [11, 12], i.e. the host's immunological ability to control inhaled M. tuberculosis. The development of this model focused on the probability of being infected. TST or IGRA results were not included in the calculations, as the model is intended to be an independent tool to evaluate both existing and new immunological markers for LTBI.
Definitions
Remote LTBI was defined as an infection acquired previously, i.e. before the present contact with a defined index case with pulmonary TB.
Recent LTBI was defined as an infection acquired during the present contact with a defined index case with pulmonary TB.
Calculations of the probability of remote LTBI
Estimation of the probability of remote LTBI (premote) (expressed as a percentage) included the probability of infection in the country of origin (porigin), in Sweden (pSweden), during travel to highly endemic countries for >1 year (ptravel), during stays in high-risk environments such as hospitals, refugee camps and/or prisons for >3 months (phigh), and previous known exposure to contagious pulmonary TB (pexpo) (a more detailed report and an example of the calculations of premote is included in supplementary material S1):
where:
 |
for three separate time-periods (1990, 1990–2000 and 2000), and where “years” is number of years in the country of origin from birth to immigration to Sweden and ARI is the annual risk of infection:
 |
adjusted for country of origin and each time period [13–16].
pSweden, ptravel and phigh were calculated in similar ways with years in Sweden, during travel or staying in high-risk environments, and adjusted to Dye's constant, respectively.
pexpo was estimated according to previously published data [17], i.e. close contact with a smear microscopy positive (SM+) contact 35%, smear microscopy negative (SM−) 10% and smear microscopy result unknown (SMunknown) 20%, while not close (casual) contact with SM+ 10%, SM− 2% and SMunknown 5%.
Calculations of probability of recent LTBI
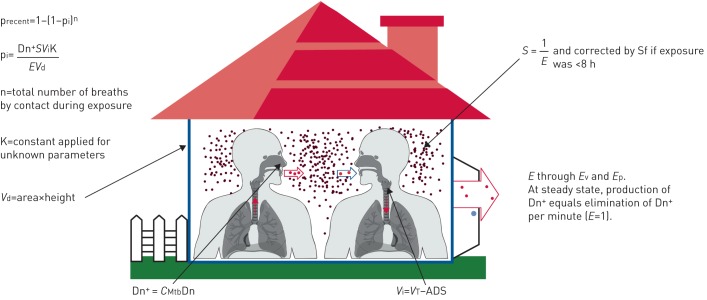
Estimations of the probability of recent LTBI (precent) (expressed as a percentage) included the contagiousness of index case, proximity and time of exposure to the index case, and environmental factors (figure 1) (a more detailed report and an example of the calculations of precent is included in supplementary material S2.
FIGURE 1.
Illustration of the parameters included in the calculations of probability of recent latent tuberculosis infection (precent). pi: probability of the contact inhaling Mycobacterium tuberculosis in one breath; Vd: volume of distribution; Dn+: production of M. tuberculosis-containing droplets per minute; CMtb: concentration of M. tuberculosis in sputum; Dn: estimated droplet production; Vi: volume of one inhalation; VT: total inhaled volume; ADS: anatomical dead space; E: elimination rate of Dn+ per minute; Ev: elimination through ventilation; Ep: elimination through precipitation; S: saturation at steady state, i.e. how many times more Dn+ was present in the air as compared with the production per minute; Sf: saturation factor.
precent,day and precent,night were calculated as 1−(1−pi)n according to daytime and night time parameters, respectively, where n is the estimated number of breaths taken by an individual contact during the estimated time of TB exposure and pi is the probability of the individual contact inhaling M. tuberculosis in the air volume with each breath:
 |
where Dn+ is the estimated production of M. tuberculosis-containing droplets (Dn) per minute, calculated as:
where CMtb is the M. tuberculosis concentration in sputum calculated as average number of colony forming units per microlitre of sputum [18, 19]. Dn is the estimated production of droplet nuclei adjusted for daytime/nighttime and with/without cough [20–25]. S is the saturation of Dn+ in air volume calculated from estimated elimination rate (E) through ventilation and precipitation in general buildings or hospitals [11]. At steady state, E=1. Vi is the estimated alveolar volume (in litres) in one normal inhalation by the contact [26, 27]. Vd is the volume of distribution calculated as the estimated volume of air (in litres) of the premises in which the main exposure took place. K is a calculated constant that was applied to adjust for unknown parameters such as numbers of M. tuberculosis-containing droplets, M. tuberculosis per droplet, M. tuberculosis reaching the alveoli and M. tuberculosis needed to establish infection, and validated according to previous published data on transmission [17, 28, 29].
Application of the mathematical model to contacts of contagious TB
The mathematical model was applied to 162 contacts of 42 index cases with culture-verified pulmonary TB who were included in a study on new immunological markers for LTBI (Wahren Borgström et al. 2019; unpublished observations). In regular clinical practice, two contacts were diagnosed with active TB and therefore excluded from further analyses.
Index cases
31 (74%) index cases were coughing, 24 (57%) were SM+ and average time from start of symptoms to treatment initiation was 81 days (range 27–313 days).
Contacts
130 (81%) contacts were bacille Calmette–Guérin vaccinated at least once.
With respect to origin, 70 (44%) were Swedish, 10 (6%) European excluding Sweden or American and 80 (50%) were African or Asian. 26 (16%) had previous known exposure to active TB and 26 (16%) had previously been treated partly or fully for LTBI.
Proximity between index case and contact
134 (84%) were classified as close contacts (>8 h contact with SM+ or >48 h contact with SM− index case) and 26 (16%) as casual contacts [17].
Classification of probability groups
Contacts were classified into four LTBI probability groups according to precent and premote: 1) recent LTBI, i.e. precent≥10% and premote<10%; 2) remote LTBI, i.e. precent<10% and premote≥10%; 3) recent and remote LTBI, i.e. precent≥10% and premote≥10%; and 4) low probability of LTBI, i.e. precent<10% and premote<10%. The same classification was performed with a probability cut-off at 50%.
Immunological test results
Results of immune reactive testing with TST, QFT and T-spot.TB of all contacts were available, and the tests had been performed by nurses specifically trained in the technique. TST was performed <1 month after the last exposure date and repeated after 1–4 months if the initial test was negative, according to clinical standards. Two units of purified protein derivative (tuberculin PPD RT23; Statens Serum Institute, Copenhagen, Denmark) were injected intradermally and cutaneous induration was measured in millimetres with a ruler after 72 h. The cut-off for a positive result was 10 mm with a borderline result of 6–9 mm [3, 30]. QFT and T-spot.TB were performed and analysed according to the manufacturers' instructions. For QFT, the defined cut-off for a positive test was >0.7 IU·mL−1 and a borderline result was defined as 0.2–0.7 IU·mL−1 according to a recent study on serial QFT testing [31]. For T-spot.TB, the responses to the M. tuberculosis antigens 6-kDa early secretory antigenic target (ESAT-6) and 10-kDa culture filtrate protein (CFP-10) were analysed and presented separately to detect a possible difference in the response in recent versus remote LTBI. The defined cut-off for a positive test was >7 spots and a borderline result was defined as 5–7 spots according to the manufacturer's instructions.
Classification of response groups
Contacts were classified into five response groups according to immunological test results during follow-up: 1) negative response (TST <6 mm, QFT <0.2 IU·mL−1, or T-spot.TB ESAT-6 and CFP-10 <5 spots) ≥2 months after exposure and over the 12-month follow-up if available; 2) borderline response (maximum TST 6–9 mm, QFT 0.2–0.7 IU·mL−1, or T-spot.TB ESAT-6 and CFP-10 5–7 spots) over the 12-month follow-up; 3) positive response (TST >9 mm, QFT >0.7 IU·mL−1, or T-spot.TB ESAT-6 and CFP-10 >7 spots) from ≤1 month and over the 12-month follow-up if available; 4) conversion (TST/IGRA negative to positive or borderline to positive with TST ≥10 mm increase, QFT ≥0.5 IU·mL−1 increase or T-spot.TB ≥3 spot increase over a follow-up period of 12 months); and 5) reversion (TST/IGRA positive to negative or positive to borderline with TST ≥10 mm decrease, QFT ≥0.5 IU·mL−1 decrease or T-spot.TB ≥3 spot decrease over a follow-up period of 12 months). Undefined responses were excluded from analyses (e.g. borderline/positive results not classified as conversions/reversions, and unapproved or missing results).
Statistical analyses
Calculations were based on basic epidemiological concepts [32]. Distributions of precent and premote were nonparametric, and average probabilities are presented as median values. Comparison of precent and premote between defined groups were calculated by one-way ANOVA on ranks (Kruskal–Wallis) and Dunn's pair-wise test. Statistical significance was defined as p≤0.05.
Ethical clearance
The study on new immunological markers for LTBI was approved by the ethical Committee in Stockholm (Dnr 2008/1208–31/3). Written and oral consent was obtained from all participants.
Results
premote in relation to contacts’ country of origin
premote was 11% (interquartile range (IQR) 1–38%) among all contacts (figure 2), 1% (IQR 0.5–1%) among contacts originating from Sweden (p<0.001), 16% (IQR 3–26%) among contacts from Europe (excluding Sweden) and America, and 38% (IQR 22–49%) among contacts from Africa and Asia (p<0.001).
FIGURE 2.
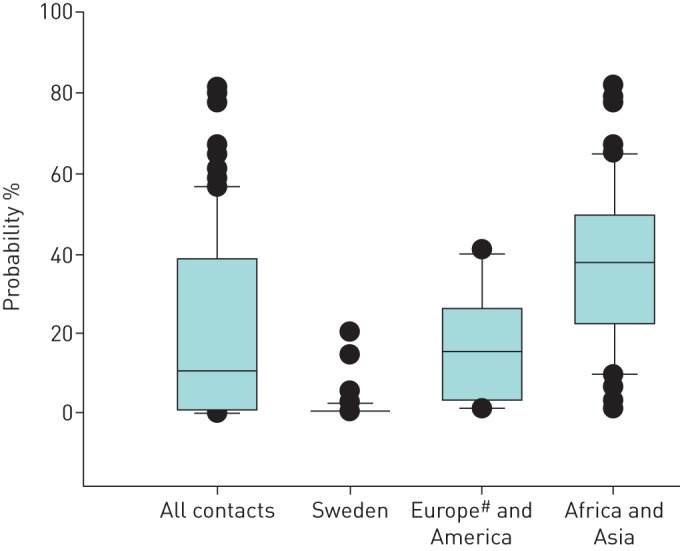
Probability of remote latent tuberculosis infection in contacts of pulmonary tuberculosis cases according to their regional origin. Horizontal lines represent median values, boxes represent interquartile ranges, whiskers represent the 10th and 90th percentiles, and circles represent outliers. #: excluding contacts originating from Sweden.
precent in contacts in relation to proximity to and sputum smear result of index cases.
precent among close contacts of SM+ index cases was 35% (IQR 6–74%) (figure 3), as compared with 1% (IQR 0.3–3%) among close contacts to SM− index cases (p<0.001), 2% (IQR 0.2–6%) among casual contacts to SM+ index cases (p=0.003) and 0.1% (IQR 0.04–0.6%) among casual contacts to SM− index cases (p<0.001).
FIGURE 3.
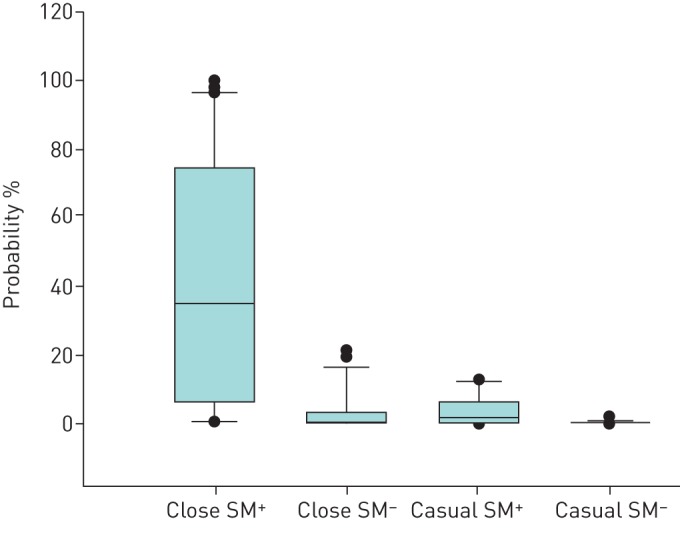
Probability of recent latent tuberculosis infection in contacts of pulmonary tuberculosis cases according to proximity to and sputum smear result of the index cases. Horizontal lines represent median values, boxes represent interquartile ranges, whiskers represent the 10th and 90th percentiles, and circles represent outliers. Close contacts: >8 h contact with smear microscopy-positive (SM+) or >48 h contact with smear microscopy-negative (SM−) index case; casual contacts: <8 h contact with SM+ or <48 h contact with SM− index case [17].
Proportion of contacts classified into defined probability groups
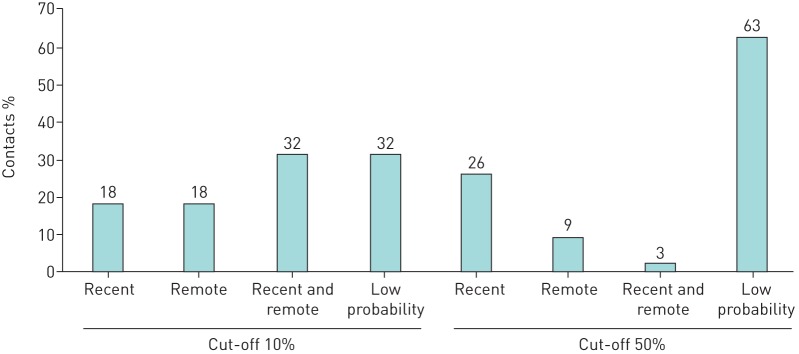
With a cut-off at ≥10% for high probability, 68% were classified as recent and/or remote LTBI (figure 4). With a cut-off at ≥50%, only 38% were classified as recent and/or remote LTBI.
FIGURE 4.
Proportion of contacts of pulmonary tuberculosis cases (n=160) classified into defined probability groups with a cut-off for high probability at ≥10% or ≥50%. Recent: ≥10/50% probability of recent and <10/50% probability of remote latent tuberculosis infection (LTBI); remote; <10/50% probability of recent and ≥10/50% probability of remote LTBI; recent and remote: ≥10/50% probability of recent and ≥10/50% probability of remote LTBI; low probability: <10/50% probability of recent and <10/50% probability of remote LTBI.
Proportion and concordance of contacts classified into defined TST and IGRA response groups
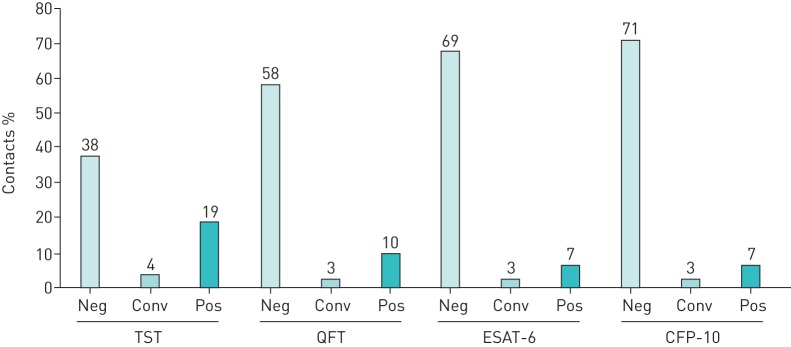
The proportion of contacts in the TST and IGRA response groups (figure 5) and their mutual concordance was analysed to evaluate their variability in detecting an immunological response, which has to be considered when evaluating calculated probabilities in relation to these tests. Contacts in the defined response groups borderline, reversions or undefined were not included.
FIGURE 5.
Proportion of contacts of pulmonary tuberculosis cases (n=160) classified by tuberculin skin test (TST), QuantiFERON TB Gold In-Tube (QFT), Tspot.TB/6-kDa early secretory antigenic target (ESAT-6) and T-spot. TB/10-kDa culture filtrate protein (CFP-10) response groups defined as follows. Neg: negative test result at ≥2 month; conv: conversion from a negative to a positive result over 12 months; pos: positive test result from ≤1 month and no following reversion. Borderline results, reversions and undefined results are not presented herein.
Concordant responses were highest between QFT and ESAT-6 (95%), QFT and CFP-10 (94%), and ESAT-6 and CFP-10 (94%), while concordant response was lower between TST and QFT (79%), TST and ESAT-6 (77%), as well as TST and CFP-10 (73%).
precent and premote in relation to TST and IGRA response groups.
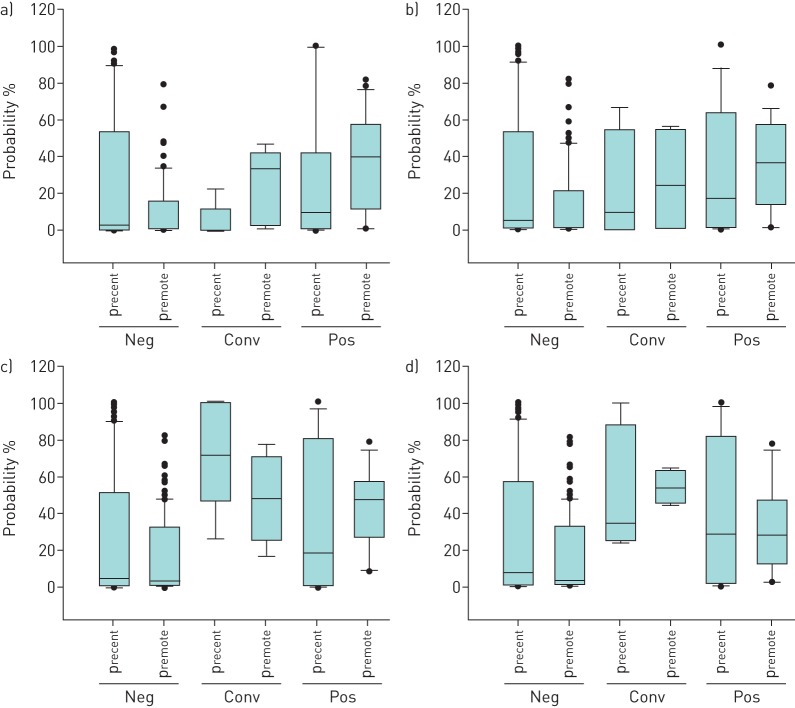
There was no statistically significant difference between the precent as compared to premote in either response groups (figure 6).
FIGURE 6.
Probability of recent (precent) and remote (premote) latent tuberculosis infection in a) tuberculin skin test, b) QuantiFERON TB Gold In-Tube, c) T-spot. TB/6-kDa early secretory antigenic target and d) T-spot. TB/10-kDa culture filtrate protein response groups defined as follows. Neg: negative test result at ≥2 month; conv: conversion from a negative to a positive result over 12 months; pos: positive test result from ≤1 month and no following reversion. Horizontal lines represent median values, boxes represent interquartile ranges, whiskers represent the 10th and 90th percentiles, and circles represent outliers.
premote was higher in contacts with a TST positive than negative response (40% versus 1%, p<0.001). There was a tendency for higher precent in contacts with T-spot.TB/ESAT-6 conversion than negative response (72% versus 5%); however, the numbers were small and did not reach statistical significance (p=0.07).
We calculated on the sensitivity, specificity, PPV and NPV of high probability (cut-offs ≥10% or ≥50%) of recent and/or remote LTBI to detect a positive response, or a conversion in TST or IGRA. Results for TST and IGRAs are presented separately and in combination, i.e. positive result and/or conversion in any test, as well as negative results in all tests (table 1).
TABLE 1.
Sensitivity, specificity, positive predicted value (PPV) and negative predicted value (NPV) of high probability for recent and/or remote latent tuberculosis infection (cut-offs ≥10% or ≥50%) to detect a positive response or a conversion in the tuberculin skin test (TST) and interferon-γ release assays
| Cut-off | Test | Sensitivity | Specificity | PPV | NPV |
| 10% | TST | 80% | 48% | 47% | 81% |
| QFT | 85% | 40% | 23% | 93% | |
| ESAT-6 | 100% | 36% | 19% | 100% | |
| CFP-10 | 100% | 35% | 17% | 100% | |
| All | 88% | 39% | 25% | 94% | |
| 50% | TST | 54% | 71% | 58% | 67% |
| QFT | 50% | 69% | 26% | 87% | |
| ESAT-6 | 69% | 66% | 23% | 94% | |
| CFP-10 | 60% | 65% | 18% | 92% | |
| All | 57% | 67% | 31% | 86% |
Results for TST and interferon-γ release assays are presented separately and in combination, i.e. positive result and/or conversion in any test, as well as negative result in all tests. QFT: QuantiFERON TB Gold In-Tube; ESAT-6: 6-kDa early secretory antigenic target; CFP-10: 10-kDa culture filtrate protein.
With a 10% cut-off, sensitivity of high probability to detect a positive result or conversion in ESAT-6 and CFP-10 was 100%, although specificity was generally <50%. The PPV of high probability was highest for prediction of a positive result or conversion of TST, i.e. 47%. With a cut-off at 50%, sensitivity was generally <70%, while PPV was as high as 58% for TST.
Discussion
With the herein presented mathematical model, premote was in line with published epidemiological data (www.who.int/tb/country/data/download/en/) [13, 33]. precent among close contacts of SM+ index cases was also in line with published data [12, 17, 18, 34–36]. However, even though our estimations were thorough and in line with previous data, other factors may also influence and change over time (e.g. urban or rural settings and socioeconomic standards). Furthermore, several approximations had to be made (e.g. production of droplets in correlation to activity and cough, M. tuberculosis-containing droplets, number of M. tuberculosis needed to establish infection, time and place spent together with index, and extent of ventilation). Anatomical airway defences and the innate immune response and microbiota may also influence the response to M. tuberculosis [29, 37]. Some of the features can be updated and refined with further validation of the model, such as extent and type of cough, and ventilation in different buildings (i.e. apartment/house/public space/hospital), and maybe also adjusted for additional ventilation by open windows. However, a mathematical model will never be absolute and must also be applicable in clinical practice.
Previous models have been described for the prediction of LTBI. Bailey et al. [38] were able to predict a positive TST in contacts of active TB cases with 89% sensitivity, 36% specificity and 26% PPV. The corresponding figures in our model were 80%, 48% and 47% for TST with 10% probability cut-off, and 54%, 71% and 58% for TST with 50% probability cut-off. This may be interpreted as TST performing poorly in the diagnosis of LTBI. However, with a cut-off at 10%, the probabilities among contacts of being infected are 10–100% and the corresponding probabilities of not being infected are thus 0–90%. With a cut-off at 50%, the PPV increases but still, many in this group will not be infected. A direct comparison between probability of infection and positive test rates would be desirable but this requires a highly reliable test as a reference method. In the absence of such a method, we do not know the true performance of TST or IGRA in detecting LTBI. However, a negative TST/IGRA result in an immunocompetent individual is associated with high NPV, i.e. excludes LTBI with high accuracy. Thus, this model is constructed to be independent of TST/IGRA results with the aim to be a new tool to evaluate new tests with better capacity to predict true LTBI with remaining M. tuberculosis. Therefore, comparisons between calculated probabilities and TST/IGRA results in this study should not be interpreted as a validation of the model.
Another published model is the McGill web-based algorithm (www.tstin3d.com/en/calc.html), which provides a tool to calculate the probability that a positive TST and/or QFT represent a true LTBI, and the calculated life-long risk of TB activation as well as the risk of liver toxicity with 9 months of daily isoniazid [39]. However, results from this algorithm do not differentiate between a recent or a remote LTBI, which is often the dilemma in clinical practice as well as in research on diagnostic markers of LTBI.
Our mathematical model is a bottom-up construction based on theoretical arguments, estimations and previous studies on transmission, which may suggest that it may be hard to determine the validity. However, we consider the theoretical approach as a strength, as the model is totally transparent and adjustable, not only to updated and optimised parameters but also to empirical data from larger cohorts with extended follow-up, including a large number of TB contacts converting in TST/IGRA or activating TB.
Supplementary material
Please note: supplementary material is not edited by the Editorial Office, and is uploaded as it has been supplied by the author.
Supplementary material 00078-2019.supp (139.2KB, pdf)
Acknowledgements
A special thanks to Hans Gaines (The Swedish Institute for Infectious Disease Control, Solna, Sweden) for initiating and assisting in the mathematical concept of this model.
Footnotes
This article has supplementary material available from openres.ersjournals.com
Conflict of interest: G. Fröberg has nothing to disclose.
Conflict of interest: E. Wahren Borgström has nothing to disclose.
Conflict of interest: E. Chryssanthou has nothing to disclose.
Conflict of interest: M. Correia-Neves has nothing to disclose.
Conflict of interest: G. Källenius has nothing to disclose.
Conflict of interest: J. Bruchfeld has nothing to disclose.
Support statement: This work was supported by the Karolinska Institutet and Stockholm County (grants K0190-2014 and K2017-4578. Funding information for this article has been deposited with the Crossref Funder Registry.
References
- 1.World Health Organization. Global Tuberculosis Report. Geneva, WHO, 2017. [Google Scholar]
- 2.World Health Organization. End TB Strategy. Geneva, WHO, 2014. [Google Scholar]
- 3.World Health Organization. Guidelines on the Management of Latent Tuberculosis Infection. Geneva, WHO, 2015. [PubMed] [Google Scholar]
- 4.World Health Organization. Latent TB Infection: Updated and Consolidated Guidelines for Programmatic Management. Geneva, WHO, 2018. [PubMed] [Google Scholar]
- 5.Kidd P. Th1/Th2 balance: the hypothesis, its limitations, and implications for health and disease. Altern Med Rev 2003; 8: 223–246. [PubMed] [Google Scholar]
- 6.Yip L, McCluskey J, Sinclair R. Immunological aspects of pregnancy. Clin Dermatol 2006; 24: 84–87. [DOI] [PubMed] [Google Scholar]
- 7.Diel R, Loddenkemper R, Nienhaus A. Predictive value of interferon-gamma release assays and tuberculin skin testing for progression from latent TB infection to disease state: a meta-analysis. Chest 2012; 142: 63–75. [DOI] [PubMed] [Google Scholar]
- 8.Winje BA, White R, Syre H, et al. Stratification by interferon-γ release assay level predicts risk of incident TB. Thorax 2018; in press [https://doi.org10.1136/thoraxjnl-2017-211147]. [DOI] [PubMed] [Google Scholar]
- 9.Dominguez J, Latorre I, Altet N, et al. IFN-γ-release assays to diagnose TB infection in the immunocompromised individual. Expert Rev Respir Med 2009; 3: 309–327. [DOI] [PubMed] [Google Scholar]
- 10.Sester M, van Leth F, Bruchfeld J, et al. Risk assessment of tuberculosis in immunocompromised patients. A TBNET study. Am J Respir Crit Care Med 2014; 190: 1168–1176. [DOI] [PubMed] [Google Scholar]
- 11.HL Rieder. Epidemiologic basis of tuberculosis control. Nat Genet; 1999; 22: 59–62.10319862 [Google Scholar]
- 12.Sepkowitz KA. How contagious is tuberculosis? Clin Infect Dis 1996; 23: 954–962. [DOI] [PubMed] [Google Scholar]
- 13.Dye C, Scheele S, Dolin P, et al. Global burden of tuberculosis: estimated incidence, prevalence, and mortality by country. JAMA 1999; 282: 677–686. [DOI] [PubMed] [Google Scholar]
- 14.Dye C. Breaking a law: tuberculosis disobeys Styblo's rule. Bull World Health Organ 2008; 86: 4. [DOI] [PMC free article] [PubMed] [Google Scholar]
- 15.Dye C, Bassili A, Bierrenbach AL, et al. Measuring tuberculosis burden, trends, and the impact of control programmes. Lancet Infect Dis 2008; 8: 233–243. [DOI] [PubMed] [Google Scholar]
- 16.Kompala T, Shenoi SV, Friedland G. Transmission of tuberculosis in resource-limited settings. Curr HIV/AIDS Rep 2013; 10: 264–272. [DOI] [PMC free article] [PubMed] [Google Scholar]
- 17.Grzybowski S, Barnett GD, Styblo K. Contacts of cases of active pulmonary tuberculosis. Bull Int Union Tuberc 1975; 50: 90–106. [PubMed] [Google Scholar]
- 18.Lohmann EM, Koster BF, le Cessie S, et al. Grading of a positive sputum smear and the risk of Mycobacterium tuberculosis transmission. Int J Tuberc Lung Dis 2012; 16: 1477–1484. [DOI] [PubMed] [Google Scholar]
- 19.Andersen AA. New sampler for the collection, sizing, and enumeration of viable airborne particles. J Bacteriol 1958; 76: 471–484. [DOI] [PMC free article] [PubMed] [Google Scholar]
- 20.Johnson GR, Morawska L. The mechanism of breath aerosol formation. J Aerosol Med Pulm Drug Deliv 2009; 22: 229–237. [DOI] [PubMed] [Google Scholar]
- 21.Nicas M, Nazaroff WW, Hubbard A. Toward understanding the risk of secondary airborne infection: emission of respirable pathogens. J Occup Environ Hyg 2005; 2: 143–154. [DOI] [PMC free article] [PubMed] [Google Scholar]
- 22.Douglas NJ, White DP, Pickett CK, et al. Respiration during sleep in normal man. Thorax 1982; 37: 840–844. [DOI] [PMC free article] [PubMed] [Google Scholar]
- 23.Fennelly KP, Martyny JW, Fulton KE, et al. Cough-generated aerosols of Mycobacterium tuberculosis: a new method to study infectiousness. Am J Respir Crit Care Med 2004; 169: 604–609. [DOI] [PubMed] [Google Scholar]
- 24.Fennelly KP, Jones-Lopez EC, Ayakaka I, et al. Variability of infectious aerosols produced during coughing by patients with pulmonary tuberculosis. Am J Respir Crit Care Med 2012; 186: 450–457. [DOI] [PMC free article] [PubMed] [Google Scholar]
- 25.Jones-Lopez EC, Namugga O, Mumbowa F, et al. Cough aerosols of Mycobacterium tuberculosis predict new infection: a household contact study. Am J Respir Crit Care Med 2013; 187: 1007–1015. [DOI] [PMC free article] [PubMed] [Google Scholar]
- 26.Quanjer PH, Stanojevic S, Cole TJ, et al. Multi-ethnic reference values for spirometry for the 3–95-yr age range: the global lung function 2012 equations. Eur Respir J 2012; 40: 1324–1343. [DOI] [PMC free article] [PubMed] [Google Scholar]
- 27.Hart MC, Orzalesi MM, Cook CD. Relation between anatomic respiratory dead space and body size and lung volume. J Appl Physiol 1963; 18: 519–522. [DOI] [PubMed] [Google Scholar]
- 28.Fennelly KP, Jones-Lopez EC. Quantity and quality of inhaled dose predicts immunopathology in tuberculosis. Front Immunol 2015; 6: 313. [DOI] [PMC free article] [PubMed] [Google Scholar]
- 29.Gupta N, Kumar R, Agrawal B. New players in immunity to tuberculosis: the host microbiome, lung epithelium, and innate immune cells. Front Immunol 2018; 9: 709. [DOI] [PMC free article] [PubMed] [Google Scholar]
- 30.Erkens CG, Kamphorst M, Abubakar I, et al. Tuberculosis contact investigation in low prevalence countries: a European consensus. Eur Respir J 2010; 36: 925–949. [DOI] [PubMed] [Google Scholar]
- 31.Nemes E, Rozot V, Geldenhuys H, et al. Optimization and interpretation of serial QuantiFERON testing to measure acquisition of Mycobacterium tuberculosis infection. Am J Respir Crit Care Med 2017; 196: 638–648. [DOI] [PMC free article] [PubMed] [Google Scholar]
- 32.Bonita R, Beaglehole R, Kjellström T. Basic Epidemiology. 2nd Edn. Geneva, WHO, 2006. [DOI] [PubMed] [Google Scholar]
- 33.Glaziou P, Floyd K, Raviglione M. Global burden and epidemiology of tuberculosis. Clin Chest Med 2009; 30: 621–636. [DOI] [PubMed] [Google Scholar]
- 34.Langenskiold E, Herrmann FR, Luong BL, et al. Contact tracing for tuberculosis and treatment for latent infection in a low incidence country. Swiss Med Wkly 2008; 138: 78–84. [DOI] [PubMed] [Google Scholar]
- 35.Marks SM, Taylor Z, Qualls NL, et al. Outcomes of contact investigations of infectious tuberculosis patients. Am J Respir Crit Care Med 2000; 162: 2033–2038. [DOI] [PMC free article] [PubMed] [Google Scholar]
- 36.Sprinson JE, Flood J, Fan CS, et al. Evaluation of tuberculosis contact investigations in California. Int J Tuberc Lung Dis 2003; 7: 12 Suppl. 3, S363–S368. [PubMed] [Google Scholar]
- 37.Simmons JD, Stein CM, Seshadri C, et al. Immunological mechanisms of human resistance to persistent Mycobacterium tuberculosis infection. Nat Rev Immunol 2018; 18: 575–589. [DOI] [PMC free article] [PubMed] [Google Scholar]
- 38.Bailey WC, Gerald LB, Kimerling ME, et al. Predictive model to identify positive tuberculosis skin test results during contact investigations. JAMA 2002; 287: 996–1002. [DOI] [PubMed] [Google Scholar]
- 39.Menzies D, Gardiner G, Farhat M, et al. Thinking in three dimensions: a web-based algorithm to aid the interpretation of tuberculin skin test results. Int J Tuberc Lung Dis 2008; 12: 498–505. [PubMed] [Google Scholar]
Associated Data
This section collects any data citations, data availability statements, or supplementary materials included in this article.
Supplementary Materials
Please note: supplementary material is not edited by the Editorial Office, and is uploaded as it has been supplied by the author.
Supplementary material 00078-2019.supp (139.2KB, pdf)


