

Abstract
This study aimed to explore how changes in intestinal floras caused by Bacillus subtilis (Bs) inhibited occurrence of ulcerative colitis (UC) and associated cancers. Bs was used as an intervention in an azoxymethane (AOM)/dextran sodium sulfate sodium (DSS) animal model. Stool specimens were analyzed for changes in intestinal floras. Disease activity index (DAI) scores, body mass indices, cancer counts, and other indices were calculated, while changes in the colon mucosa were observed. Compared with AOM/DSS group, carcinogenesis significantly reduced and intestinal inflammations and DAI score alleviated; diversity, evenness, and number of species of floras significantly increased; and relative abundances of Rikenellaceae and Lactobacillus increased when UC developed into cancers in the AOM/DSS + Bs group. Colon epitheliums in the mice were severely damaged in the AOM/DSS group, while mucosae were repaired in the AOM/DSS + Bs group. The mRNA expression levels of IL-6 and IL-17a were lower while those of IL-10 and TGF-β1 were higher, and the expression level of Ki-67 decreased while that of caspase 3 increased in the AOM/DSS + Bs group. Bs intervention could alter the structure of intestinal floras, repair the mucosal barrier, adjust immunity, and reduce the incidence of cancer in the AOM/DSS animal model.
Keywords: Ulcerative colitis, AOM/DSS, colitis-associated cancer, bacillus subtilis, 16S rRNA
Introduction
Worldwide, approximately 1.2 million people are diagnosed with colorectal cancer (CRC) each year [1]. In developed countries, CRC ranks as the third most commonly found cancers in males and the second in females. At present, pathogeneses of CRC are complicated and the associated mechanisms are still unknown, but evidence from a number of basic and clinical studies has proved that inflammation is one of the contributors of colon cancer [2]. Patients with inflammatory bowel disease (IBD) have been reported to have an increased risk of colon cancer [3,4]. Although specific mechanisms of how chronic inflammations promote the carcinogenesis have been inadequately studied, researchers believe that long-term exposure to the chronic inflammatory environment and cycles of repetitive damages and repairs contribute to the carcinogenesis of colon epithelial cells [5,6].
The occurrence of colitis-associated cancer is correlated with heavy exposure to the bacterial environment, while microbe flora is considered as an important factor in the process when inflammation develops into cancer [7,8]. About 1000 types of bacteria are present in the floras of human digestive tract, and the total bacterial number is more than 1014, which is 10 times as many as the total count of human cells [9]. Changes in the intestinal floras, that is, intestinal dysbacteriosis, are believed to promote the disease progression of IBD and possibly facilitate its development into CRC [10,11]. Liang et al. [12] utilized an azoxymethane (AOM)/dextran sodium sulfate sodium (DSS) model of colon cancer and analyzed the floral changes in the mouse stools at different pathological phases via the high-throughput sequencing of 16S rRNA gene. They found that the microbial community structure significantly changed by chronic inflammation, with increased relative abundances of Streptococcus luteciae, Lactobacillus hamster, Bacteroides uniformis, and B. ovatus during the cancer phase. A team led by Ahn analyzed the alterations in stool floras between the patients with colon cancer and the normal control subjects, demonstrating that the diversity in the colon cancer group reduced while the relative abundances of Fusobacterium and Porphyromonas increased [13].
Some reports in recent years claimed that probiotics might alleviate inflammations, relieving the clinical symptoms of the patients with IBD [14] and probably contributing to the prevention of colon cancer. Bolognani et al. intervened the colon cancer model with Bifidobacterium longum, L. acidophilus, and L. casei and found that the aberrant crypt foci in the high-dose group were significantly reduced while those in the low-dose group remained unchanged [15]. However, some other studies believed that probiotics could not inhibit the occurrence of colitis-associated colon cancer (CAC) [16], which might be correlated with the fact that probiotics act before the carcinogenesis and they have a little inhibitory impact on established cancer.
Probiotics may inhibit the occurrence of CAC but the specific mechanisms are unknown; however, this inhibitory effect may be correlated with the changes in intestinal floras. There existing animal studies [17] found that bacillus subtilis can inhibit DSS related mice colon inflammation, may be related to repair bowel way glues the film, increase the expression of protein involved in the intestinal mucosa barrier, or inhibit releasing of inflammatory cytokines. And Hui-lu Zhang [18] and others argue that the change of the flora, the balance of beneficial bacteria and harmful bacteria play a role in inhibiting or promoting inflammation, but if the bacillus subtilis may effect correlation of inflammation tumors and possible mechanism is not clear. An AOM/DSS model of colon cancer was established, and Bacillus subtilis (Bs) was used as an intervention in this study to explore how the changes of intestinal floras caused by Bs inhibited the occurrence of ulcerative colitis (UC) and the associated cancers.
Materials and methods
Ethics statement
All animal experiments were approved by the Committee for Laboratory Animal Management of Central South University and conducted in accordance with the Chinese Institutes of Health guidelines on the ethical use of animals.
Male ICR mice between 6 and 8 weeks of age were used for this study. The mice were kept in autoclaved cages and given sterile food and water. A murine model of chronic CAC was employed based on the previous methods [19]. The mice were divided into four groups, which received different treatments. The mice in AOM/DSS + Bs and AOM/DSS groups were given an intraperitoneal injection of AOM (10-mg/kg body weight). They received 2% DSS (molecular weight, 36-50 kDa; Sigma, Germany) in their drinking water for 7 days, 1 week after the injection. Then, they received normal drinking water for 2 weeks. The mice received another two cycles of sterile (1.5% DSS) drinking water. The AOM/DSS + Bs and AOM/DSS groups received sterile water before being euthanized at 12 weeks. The mice in the Control and Control + Bs groups received sterile water before being euthanized. On the day of the first AOM injection, the AOM/DSS + Bs and Control + Bs groups of mice were orally administered Bs probiotic (R0179) 109 CFU per animal each day until the end of the experiment. The mice of AOM/DSS and Control groups were orally administered sterile water. After euthanization, the colon tissues of the mice were harvested. The tissues were washed with sterile phosphate-buffered saline to collect fecal contents. The colon tissues were fixed in 4% paraformaldehyde for pathological evaluation and IHC.
Transmission electron microscopy
Colonic segments were prepared for transmission electron microscopy to observe the ultrastructural changes in TJs. Colon tissues with a size of 1 × 1 × 3 cm3 were fixed in 2.5% glutaraldehyde (with phosphate buffer), rinsed with phosphoric acid, dehydrated with acetone, immersed, embedded, and cured before being cut into slices (50-100 nm) using an ultratome. Then, after staining with 3% uranyl nitrate and lead acetate, the sections were observed and photographed under the Hitachi H7700 transmission electron microscope.
Western blotting and IHC
ZO-1 (GeneTex, USA), occludin (Abcam, USA), anti-glyceraldehyde 3-phosphate dehydrogenase, (anti-GAPDH) (Proteintech, Wuhan, China), CD4+ (Proteintech, Wuhan, China), Ki-67 (Elab, Wuhan, China), and caspase-3 (Boster, Wuhan, China) were used in Western blotting and IHC. After centrifugation at 20,000 g for 15 min, 50 mg of the supernatants were separated by sodium dodecyl sulfate-polyacrylamide gel electrophoresis and transferred onto nitrocellulose membranes (Hyclone Laboratories). The membranes were blocked with 5% nonfat milk in Tris-buffered saline/Tween 20 (25 mM Tris-HCl, 150 mM NaCl, pH 7.5, and 0.05% Tween 20) and probed with primary antibody overnight at 4°C. After washing with Tris-buffered saline/Tween 20, the membranes were incubated with horseradish peroxidase-conjugated secondary antibodies (Santa Cruz Biotechnology) and visualized using the enhanced chemiluminescence detection system.
A secondary antibody was diluted at 1:100 and applied for 2 h at room temperature. The Vectastain ABC Elite System (Vector Laboratories, CA, USA) was used to visualize staining for IHC. The immunostained slides were observed under a microscope. Images were taken using a digital camera, and semi-quantity of the signal was analyzed by counting mean density of the immunoreactivities against all primary antibodies. Brown or yellow was regarded as a positive signal. Image data were analyzed with NIS-Elements AR 3.0 software (Nikon, Japan). Apoptosis and proliferation indices were generated by counting the number of positive cells per high-power field (406 objective) within each mouse.
Quantitative real-time PCR
cDNA was synthesized from 2 μg of total RNA by means of a reverse transcription kit (Fermentas, MD, USA). Mouse GAPDH was amplified in parallel as an internal control. The expression of the mRNAs was evaluated using SYBR green qRT-PCR (TaKaRa, Otsu, Japan) in accordance with the standard protocol. The expression of each gene was quantified by measuring cycle threshold (Ct) values and normalized using the 2-ΔΔCt method relative to GAPDH mRNA.
16S rRNA gene library construction and sequencing
DNA extraction and detection: Stool DNA extraction was performed with fecal genomic DNA extraction kit. The extracted DNA was subjected to agarose gel electrophoresis, and its quality and quantity were determined by detecting the optical density (OD) at 260 and 280 nm. The OD 260/280 was 1.8-2.0, the DNA concentration was ≥ 5 ng/μL, and the DNA content was ≥ 150 ng.
16S rRNA next-generation sequencing: The 16S ribosomal RNA (rRNA) gene was analyzed to evaluate the bacterial diversity by using Illumina Miseq (Novogene Bioinformatics Technology Co., Ltd, beijing, China).
Amplification of variable V4 region of 16S rRNA: The variable V4 region was amplified with Phusion® High-Fidelity PCR Master Mix with GC Buffer (New England Biolabs) and efficient and high-fidelity enzymes. The diluted DNA served as a template, and 515F-806R primers with Barcode were used for PCR.
Purification of PCR products: After PCR, 30 ng of products were mixed and subjected to purification by 2% agarose gel electrophoresis. The target band was retrieved with corresponding kit (Qiagen). Qubit was used to determine the concentration of PCR products which were mixed on the basis of their concentration.
Construction of library and sequencing: The library was constructed with TruSeq® DNA PCR-Free Sample Preparation Kit and quantified by Qubit and Q-PCR. After quantification of the library, HiSeq2500 PE250 was used for sequencing of PCR products of 16SrDNA with dual-end sequencing method.
Pre-processing of data after sequencing: After sequencing, data related to Barcode and primer sequences were removed, and FLASH (V1.2.7) was used to connect the reads of each sample. Clean Tags with high quality were obtained after filtration. The above procedures were done according to the Tages quality control flow chart of Qiime (V1.7.0). The Tags sequences were compared with Gold database via UCHIME Algorithm to detect the Chimeric sequences. Then, the effective Tags were obtained after removing the Chimeric sequences.
Determination of operational taxonomic units and species noting
Uparse software (Uparse v7.0.1001) was used for the clustering of effective Tags of all the samples. The effective Tags with 97% identity were clustered into Operational Taxonomic Units (OTUs). Then, the representative species of OTUs were noted, and RDP Classifier (Version 2.2) and GreenGene database were used for the analysis of species notes (threshold: 0.8-1).
Analysis of alpha diversity
Data from each sample were homogenized with cut-off value at 40167. The resultant data after homogenization were used in following analyses. Qiime software (Version 1.7.0) was used to calculate Observed-species, Chao1, Shannon and index. R software (Version 2.15.3) was used to delineate dilution curve and compare the alpha diversity with Wilcox test among groups.
Analysis of beta diversity
Qiime software (Version 1.7.0) was used to calculate the Unifrac distance and construct the phylogenetic tree of UPGMA samples. The dissimilarity (unweighted Unifrac) between two communities in the phylogenetic tree was determined based on the fraction of branch length shared by both communities. The ade4 package and ggplot2 package for R was used for PCA. WGCNA, stats and ggplot2 packages for R were used for PCoA. R was used to compare the beta diversity among groups with Wilcox test.
Statistical analysis
The differential species were analyzed according to the abundance of species in samples. The multiple hypothesis testing and false discovery rate of rare frequency data were analyzed to evaluate the differences between species. The other data were analyzed using the GraphPad Prism 5 software (CA, USA) and expressed as mean ± standard error of mean. The differences in parametric data were evaluated by Student two-tailed unpaired t test. Differences with P < 0.05 were considered statistically significant.
Results
Bs protected against tumorigenesis in the AOM/DSS model of CAC
The Institube of Cancer Research (ICR) male mice were conventionalized with specific-pathogen-free (SPF) and acclimatized to rodent diet and water for 1 week to investigate the impact of probiotic intervention on the development of CAC. After the acclimation, the mice in the AOM/DSS + Bs and AOM/DSS groups were given an intraperitoneal injection of AOM (10 mg/kg body weight), at which point daily oral administration of Bs [109 CFU/(animal × day)] was begun (Figure 1).
Figure 1.
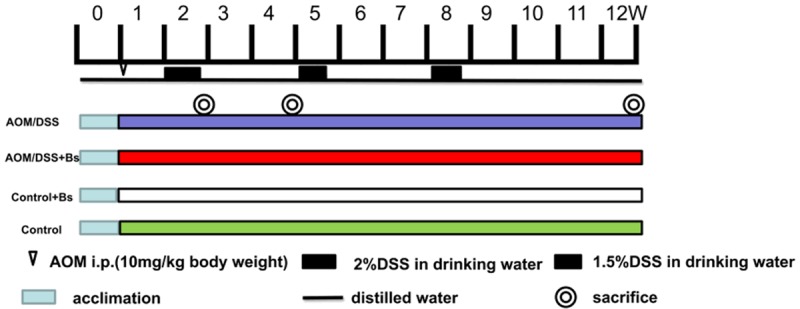
Experimental timeline for AOM/DSS model with Bs interventional administration. Germ-free ICR mice were transferred to SPF conditions. Tumorigenesis was initiated with 1-week injections of AOM (10 mg/kg), and Bs was orally administered [109 CFU/(mouse × day)] to mice daily throughout the remainder of the experiment. After 2, 4, and 12 weeks, the mice were sacrificed and tissues were harvested for the assessment of inflammation and tumorigenesis.
Three obvious peaks appeared in the weight variations in mice from both the AOM/DSS and AOM/DSS + Bs groups and distributed in the three cycles of DSS feeding, while a more significant decrease was observed in the weights of mice of the AOM/DSS group (Figure 2A). Three corresponding peaks also appeared in the disease activity index (DAI) scores, indicating that a severe intestinal inflammation degree was observed in the mice in the AOM/DSS during the inflammation and dysplasia phases, while a significantly higher DAI score was found in the AOM/DSS group compared with the AOM/DSS + Bs group and in the negative control group of Control + Bs compared with the blank control group. The latter results were correlated with the phenomenon that some of the mice experienced diarrhea in the Control + Bs group late during the experiment (Figure 2B). The carcinogenesis rate was significantly lower in the mice of the AOM/DSS + Bs group compared with the mice of the AOM/DSS group (Figure 2C), while the gross findings (Figure 2D) showed significant differences between the two groups, in terms of both cancer amount and cancer size. Pathological results showed adenomatoid changes in mice of both the groups during the cancer phase, while a significantly less severe intestinal inflammation degree was seen in the mice of the AOM/DSS + Bs group compared with those of the AOM/DSS group (Figure 2E). Generally speaking, Bs intervention could reduce the carcinogenesis rate in the mice under the AOM/DSS model of CAC.
Figure 2.
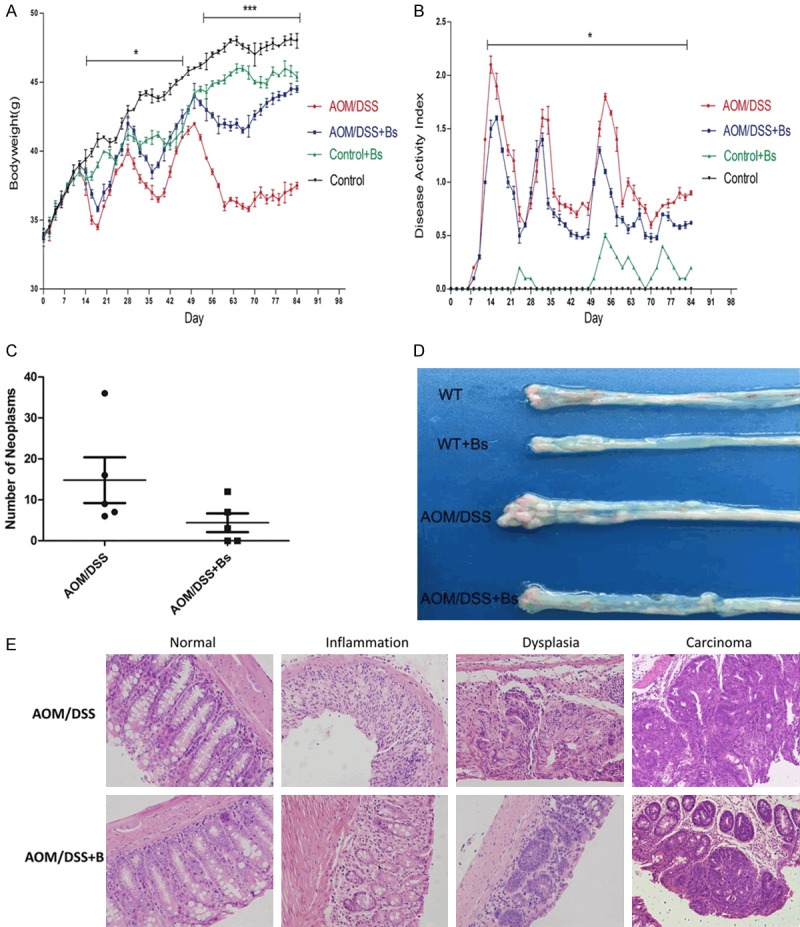
DAI gross score, body weight (BW), tumor occurrence, and histological examination. A. BW was assessed daily and expressed as a percentage of basal BW in each group. B. DAI, consisting of weight loss, stool consistency, and occult blood test (OB), was measured daily. Data were expressed as mean ± standard deviation. C. Calculation of the tumor number between the AOM/DSS and AOM/DSS + Bs groups. D. Morphologic alterations of the colon. E. Representative image of hematoxylin-eosin H&E.-stained section of distal colon (200 ×) (WT, WT + Bs, AOM/DSS, and AOM/DSS + Bs; ■P < 0.05, **P < 0.01).
Stool specimens from the mice of both the AOM/DSS and AOM/DSS + Bs groups were collected at different pathological phases for the high-throughput sequencing of 16S rRNA, with a mean sequencing number of 48391 for each specimen. Effective tags of all the specimens were clustered, and the sequences were then further clustered into operational taxonomic units (OTUs) with an identity of 97%.
The rarefaction curve was analyzed for alpha diversity analysis, which directly reflected the rationality of sequencing data, and indirectly reflected the abundance of species in the sample (Figure S1). The mean sequencing number in this study was 48391, a number located at a point where the curve was already flat and smooth; therefore, fewer new species would appear even if the sequencing number continued to increase. Moreover, the rank abundance curve was also analyzed, which reflected the richness and evenness of the species (Figure S2). The curves of most specimens were flat and smooth, reaching the platform phase with an Operational Taxonomic Unit (OUT) richness of or less than 0.2 × 10⁻⁴, indicating rational richness and evenness in the internal species of the sample. No alterations were found in the flora richness after intervention with AOM/DSS or probiotics, but the Chaos1 index (Figure 3C) showed that the declines in flora diversity and balance were the most significant in the AOM/DSS group, while slight differences were observed between the AOM/DSS + Bs and Control groups.
Figure 3.

Community richness, evenness, and diversity of fecal samples in different groups. A. Relative abundances of the dominant phyla in the samples of the control and model groups. B. Relative abundances of the dominant genes in the samples of the control and model groups. C. Chao1 index in different groups. D. PCA in different groups. E. Unweighted UniFrac beta of the control and model groups. OA, OB, OC: Inflammation, dysplasia, and cancer phases, respectively, in the AOM/DSS group; POA, POB, POC: inflammation, dysplasia, and cancer phases, respectively, in the AOM/DSS + Bs group; PA, PB, PC: inflammation, dysplasia, and cancer phases, respectively, in the WT + Bs group; AC, CB, CC: inflammation, dysplasia, and cancer phases, respectively, in the WT group.
The principal component analysis (PCA) was conducted for beta diversity analysis. Figure 3D indicates that greatest distances among specimens in the AOM/DSS group and distances among different subjects in the AOM/DSS + Bs group decreased, but they were still greater than those in the control group, indicating that the internal individual difference in the AOM/DSS group was the greatest. In beta diversity analysis for the intergroup difference, box graphs based on the unweighted UniFrac beta diversity (Figure 3E) showed the highest value in the AOM/DSS group, indicating the greatest difference in the specimen flora communities of this group.
The taxonomic structure of the mouse fecal samples was shown at the phylum and genus levels. In all groups in different stages, Firmicutes and Bacteroidetes were the most abundant bacterial phyla, accounting for 23.6%-54.9% and 27.7%-73.3% of phyla in total (Figure 3A). Proteobacteria, Verrucomicrobia, Deferribacteres, and Tenericutes constituted the rest of the gut microbiome in the samples of this study. Moreover, a few floras could not be included using the present classification. Bacteroides, Lactobacillus, and [Prevotella] were the most common genera in the mice fecal microbiome, but abundance difference was also displayed (Figure 3B).
The species with the most significant differences among the four groups were found using the LEfse analysis to analyze the changes in intestinal floras following the Bs intervention. During the cancer phase, no significant difference was found in the variations of Firmicutes, Bacteroidetes, and the other bacteria among the four groups at the phylum level. However, relative abundances of Rikenellaceae and Lactobacillus in the AOM/DSS + Bs group were found to increase compared with those in the AOM/DSS group (Figure 4A). During the development of inflammation to cancer, variations of the Prevotella and Paraprevotella in the AOM/DSS group were significantly different from those in the control group at the genus level, while similar changes were observed in the AOM/DSS + Bs group. A gradually increasing relative abundance of Prevotella was seen in both groups throughout the whole process, while the relative abundance of Paraprevotella during the cancer phase increased in the AOM/DSS group and decreased in the AOM/DSS + Bs group. At the species level, the relative abundance of B. acidifaciens in the AOM/DSS and AOM/DSS + Bs groups both peaked in the inflammation phase and reduced in the cancer phase, but statistically significant variation was only found in the latter. The richness of flexus, a genus lowly contained in the mouse intestinal floras, increased in the AOM/DSS group during the dysplasia phase, while its content in the AOM/DSS + Bs group during the dysplasia phase was 0 (Figure 4B-E).
Figure 4.
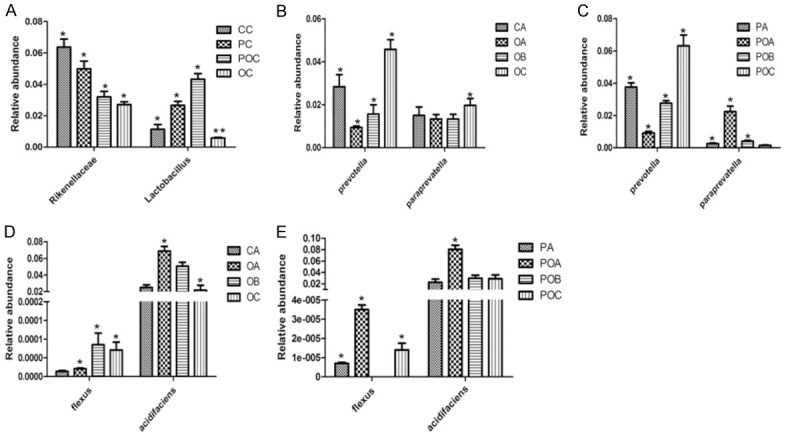
A. Differential species at the family and genus levels in the carcinoma stage. B. Differential species at the genus level in the AOM/DSS group. C. Differential species at the genus level in the AOM/DSS + Bs group. D. Differential species at the species level in the AOM/DSS group. E. Differential species at the species level in the AOM/DSS + Bs group. *P < 0.05, **P < 0.01. OA, OB, OC: Inflammation, dysplasia, and cancer phases, respectively, in the AOM/DSS group; POA, POB, POC: inflammation, dysplasia, and cancer phases, respectively, in the AOM/DSS + Bs group; PA, PB, PC: inflammation, dysplasia, and cancer phases, respectively, in the WT + Bs group; AC, CB, CC: inflammation, dysplasia, and cancer phases, respectively, in the WT group.
Bs intervention repaired the intestinal mucosal barrier in the AOM/DSS model
The colon epithelium of the Control and Control + Bs groups was intact. However, the ultrastructure of colon epithelium of the AOM/DSS group mice changed most obviously (Figure 5). Manifestations included the destruction of tightness and microvillus, broadening of the cell gap, vacuolation of cells and chromosome sedimentation, and apoptosis of epithelial cells, but these changes were alleviated in the AOM/DSS + Bs group.
Figure 5.
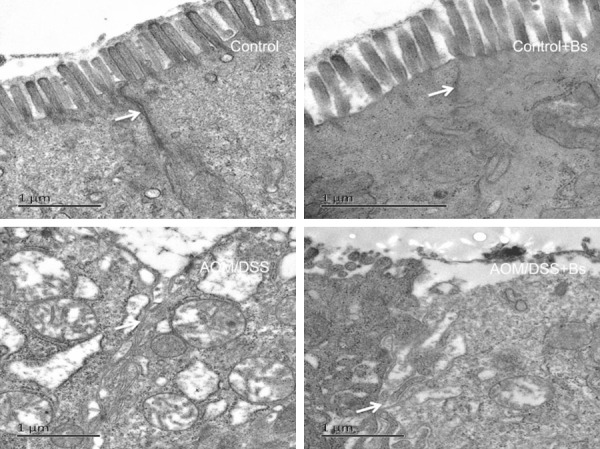
Ultrastructure of the intestine using a transmission electron microscope in different mice groups during the inflammation stage.
Functions of the intestinal barrier relied on the integrity of the intestinal epithelial cell layer, and, of course, the junction structures among the epithelial cells. Tight junction (TJ) is the major connection pattern among the epithelial cells, while transmembrane protein occludin and the scaffolding protein Zonula occludens-1 (ZO-1) may represent the TJ degree among the epithelial cells. The expression of occludin and ZO-1 during the inflammation phase in the mouse colon epitheliums of the different treatment groups was analyzed using the techniques of immunohistochemistry (IHC) and Western blot. During the inflammation phase, the immunohistochemical results showed that the expression levels of ZO-1 and occludin in the AOM/DSS group were significantly lower than those in the AOM/DSS + Bs group, while the expression levels of these two proteins were significantly lower in both the AOM/DSS and AOM/DSS + Bs groups compared with those in both the Control and Control + Bs groups (Figure 6). Both ZO-1 and occludin were primarily located at the margins and membrane top of the epithelial cells and continuously distributed along the submicrovillar zone in the Control and Control + Bs groups. ZO-1 and occludin were unevenly and sparsely scattered in the AOM/DSS group, with faded staining, blurred outlines, rough edges, and thorny protrusions, while both ZO-1 and occludin were rather evenly arranged in the epithelial layer of the colon mucosa in the AOM/DSS + Bs group, with clear outlines, sharp edges, and without thorny protrusion. Western blot analysis yielded similar results, showing that the expression levels of ZO-1 and occludin were significantly lower in the AOM/DSS group compared with those in the AOM/DSS + Bs group during the inflammation phase (Figure 7).
Figure 6.
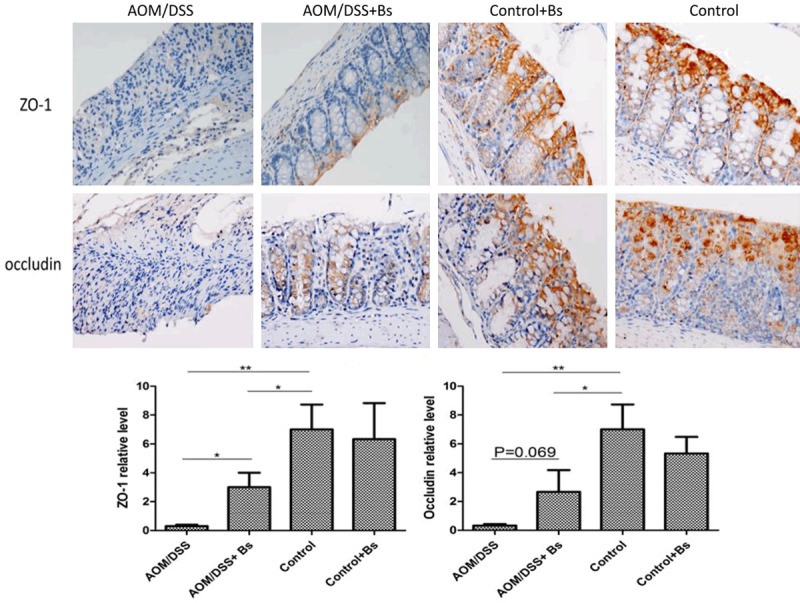
Expression levels of ZO-1 and occludin were detected by immunohistochemical staining in the inflammatory stage (200 ×). Staining of colonic tissue for ZO-1 (upper) and occludin (lower) of 4-μm sections from the paraffin-embedded tissue of mice from the AOM/DSS + Bs, AOM/DSS, WT + Bs, and WT groups (scale bar: 50 μm). ZO-1 and occludin staining was performed as per manufacturer’s instructions. Data are representative of three independent experiments. *P < 0.05, **P < 0.01.
Figure 7.
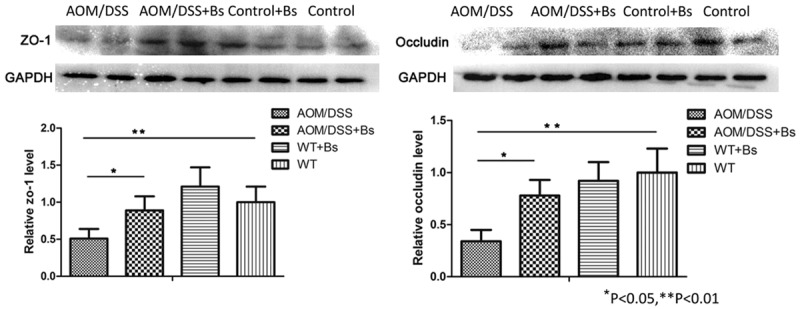
Expression levels of ZO-1 and occludin detected by Western blot in the inflammation stages. ZO-1 and occludin were detected by Western blot analysis of colon tissue with indicated antibodies. Data are representative of three separate experiments. *P < 0.05, **P < 0.01.
Bacillus subtilis treatment suppressed proliferation and promoted apoptosis in the AOM/DSS model
It was reported that probiotics could promote apoptosis through regulating endogenous and exogenous apoptotic pathway, and inhibit multiple cell proliferation through regulating some important regulatory factor. Expressions of Ki-67, Caspase 3 in colon tissue of both AOM/DSS + Bs and AOM/DSS groups were detected by immunohistochemical staining. Result showed that Caspase 3 expression in AOM/DSS + Bs group was significantly higher than AOM/DSS group, while Ki-67 expression in AOM/DSS + Bs group was significantly lower than AOM/DSS group, indicating that Bacillus subtilis could promote apoptosis and inhibit proliferation (Figure 8).
Figure 8.
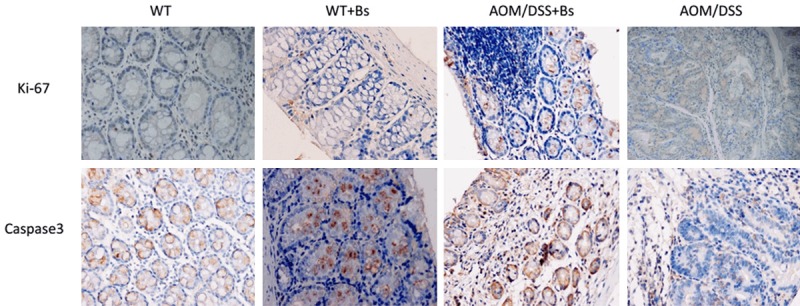
Expressions of Ki-67, Caspase 3 were detected by immunohistochemical staining in the carcinoma stage (200 ×). Staining of colonic tissue for Ki-67 (Upper) and Caspase 3 (Lower) of 4-μm sections from paraffinembedded tissue of mice from AOM/DSS + Bs and AOM/DSS group (Scale bar: 50 μm). Ki-67 and Caspase 3 staining was performed per manufacturers’ instructions. Data are representative of three independent experiments.
Bs treatment moderated the immune system of gastrointestinal tract in the AOM/DSS model
The variations in CD4 contents of each intervention group during inflammation and cancer phases were assessed using immunohistochemical analysis, revealing that the CD4 content significantly increased in the AOM/DSS group during both phases compared with that in the AOM/DSS + Bs group, while only weak CD4 expression was observed in the Control + Bs and Control groups, indicating that Bs alleviated colon inflammation (Figure 9). Moreover, polymerase chain reaction (PCR) was also used to detect the mRNA expression levels of interleukin (IL)-6, IL-17a, IL-10, and transforming growth factor β1 (TGF-β1) during the inflammation and cancer phases. During the inflammation phase, the mRNA expression levels of IL-6 and IL-17a, in the AOM/DSS group were significantly higher than those in the AOM/DSS + Bs group, while the expression of IL-10 and TGF-β1 were weak in both the groups, with no statistical difference between them. During the cancer phase, the mRNA expression levels of IL-6 and IL-17a were similar with no statistical difference between the two groups, however in the AOM/DSS + Bs group expression of IL-10 and TGF-β1 were significantly higher than those in the AOM/DSS group.
Figure 9.
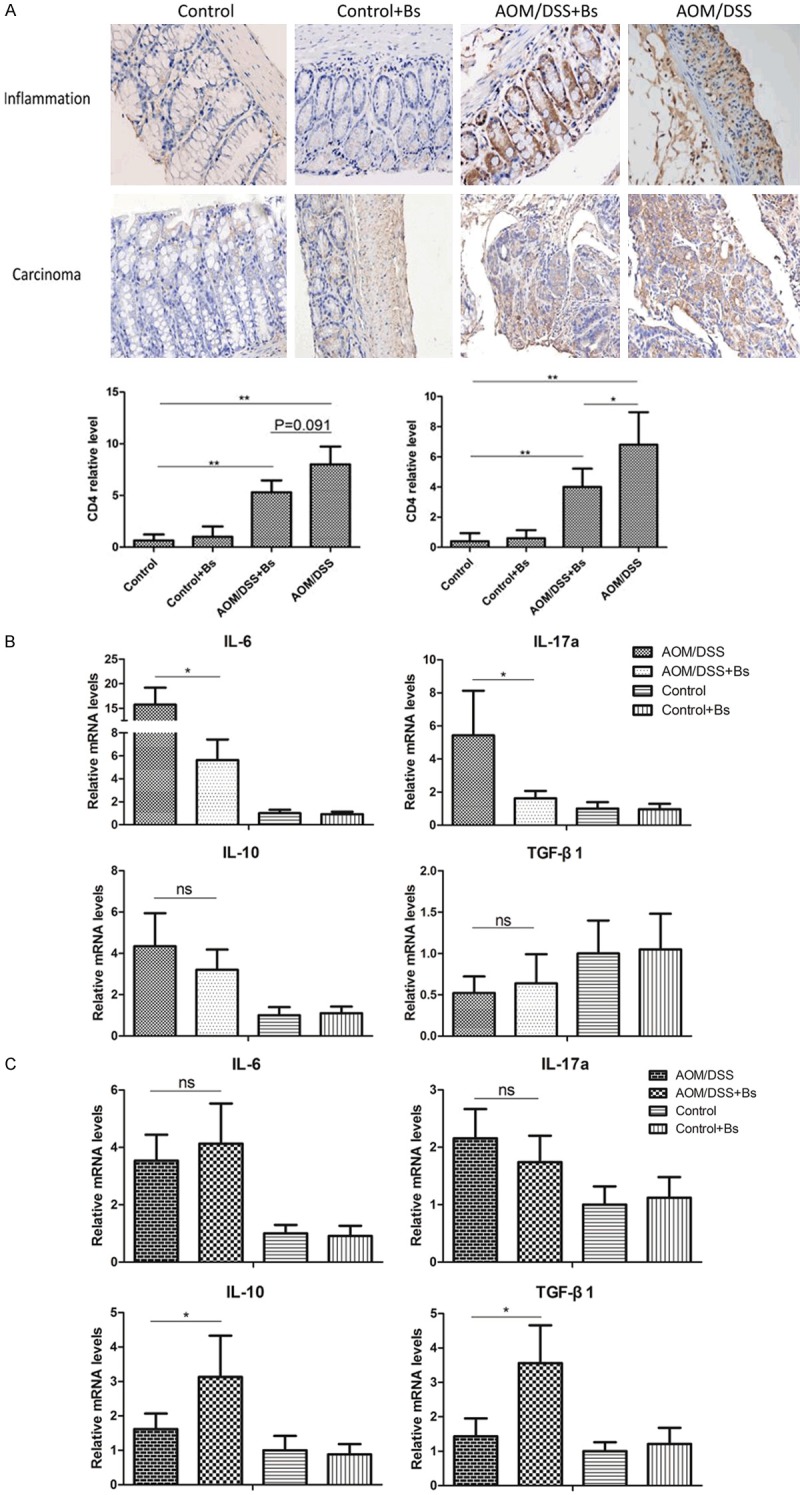
Expression levels of CD4 were detected by immunohistochemical staining in the inflammatory and carcinoma stages (200 ×) (A), and expression levels of IL-6, IL-17, IL-10, and TGF-β1 were detected by PCR during the inflammation (B) and carcinoma stages (C). *P < 0.05, **P < 0.01.
Discussion
A mouse AOM/DSS model for CAC was established, and the mice were intervened with Bs. The intestinal inflammation severity and DAI were found to be lower in the mice of the AOM/DSS + Bs group compared with that in the AOM/DSS group, with a significantly reduced cancer size and amount in the mice of the AOM/DSS + Bs group. Thus, Bs intervention altered the intestinal floras, relieved the intestinal inflammations, and inhibited the occurrence of CAC by enhancing the expression of junction proteins in the intestinal mucosa, repairing the intestinal mucosal barrier, and mediating the intestinal immunity.
Increasing reports in recent years have shown the involvement of intestinal floras in the carcinogenesis and progression of colon cancers, and many have also proved the significant differences in intestinal floras between normal subjects and those under the disease states (IBD and colon cancer). However, whether alterations in the intestinal floras were caused by the diseases or these alterations promoted the pathogenesis and progression of the diseases is still unknown. This study hypothesized that changes in the intestinal flora community and species richness might promote or inhibit the occurrence of colon cancers. Significant variations were observed in the structures and components of intestinal floras during chronic colitis, while Bs intervention could counterbalance the adverse results. The number of species increased with a lower intergroup difference in the AOM/DSS + Bs group compared with that in the AOM/DSS group in this study, indicating a favorable consequence resulting from the changes in the intestinal flora community following Bs intervention. This might correlate with the inhibition of colon carcinogenesis. Khazaie et al. [20] reported that Lactobacillus reduced the incidence of colon adenoma, which might be associated with lipoteichoic acid, a product of Lactobacillus. The present results proved that the abundance of Lactobacillus during the cancer phase was significantly higher in the AOM/DSS + Bs group compared with that in the AOM/DSS group. Moreover, Prevotella abundance increased in both the AOM/DSS and AOM/DSS + Bs groups from the inflammation phase to the cancer phase. Prevotella has been reported to promote DSS-induced colitis [21] indicating that it might act as a harmful bacterial genus contributing to carcinogenesis, while Bs had little impact upon it. Moreover, the content of Paraprevotella was high in the AOM/DSS group during the cancer phase, while the abundance of Paraprevotella in the AOM/DSS + Bs group significantly decreased during the cancer phase. Paraprevotella is a genus of the Bacteroides family, which has been rarely reported previously. This study speculated Paraprevotella as a harmful bacterium involved in carcinogenesis. At the species level, the abundance of B. acidifaciens in the AOM/DSS + Bs group was found to increase during the cancer phase. In a study that investigated the cancer-inhibitory role of Gynostemma saponins, [22] the probiotic B. acidifaciens was considered to be one of the possible anti-cancer agent; therefore, B. acidifaciens might be correlated with the inhibition of colon cancer. In summary, Bs intervention adjusted the internal flora community, increased the probiotics, and reduced harmful bacteria following the flora variations induced by chronic inflammation.
Intestinal mucosa was exposed to a large number of foreign antigens and microbes from the external environment. Intact mucosa can prevent the shifts of harmful bacteria and associating products, and therefore, its barrier function is crucial to the human body. However, TJ is predominant in the mediation of permeability and integrity of colon epithelial cells. It has been proved that probiotics enhance the mucosa barrier function and adjust the expression and distribution of TJ proteins [23-25]. The ultrastructures of the colon epithelial cells from each treatment group were observed under a transmission electron microscope in the present study revealing that colon epithelial cells in the mice were severely damaged following treatment with AOM/DSS, while those with Bs intervention were repaired. Moreover, the TJ proteins ZO-1 and occludin were downregulated with abnormal distributions in the AOM/DSS group, while they were upregulated in the AOM/DSS + Bs group compared with that in the AOM/DSS group. Therefore, Bs could effectively repair mucosal damages and enhance the mucosa barrier.
Inflammation is considered as an important contributor to carcinogenesis [2,16]. Increasing evidence in recent years has shown that probiotics can abate the progression of inflammation or even halt the transition from inflammation to cancer possibly through their mediations over intestinal immunity. The expression of CD4 in the mouse intestinal tissues during the inflammation phase was detected using immunohistochemical techniques, revealing a significantly higher CD4 content in the AOM/DSS group than in the AOM/DSS + Bs group. This result showed the active expression of CD4 T lymphocytes during the inflammation phase, which might be correlated with carcinogenesis. Then, the cytokines secreted by TH17 and Treg cells were detected. During the inflammation phase, the expression levels of both IL-6 and IL-17a were downregulated following the Bs intervention. IL-6 could activate STAT3 and promote colon epithelial proliferation, while IL-17a was also involved in the carcinogenesis of CAC [26-28]. However, the anti-inflammatory cytokine IL-10 was also upregulated in the AOM/DSS model group, which might be correlated with the intestinal secondary immune responses during the acute inflammation phase. However, all the cytokines secreted by TH17 and Treg cells were significantly higher in the AOM/DSS + Bs group than in the AOM/DSS group. IL-10 and TGF-β1 secreted by Treg cells have been proved to inhibit carcinogenesis during the cancer phase. The probiotics affect carcinogenesis through immune activation, which was consistent with the findings on the impacts of probiotics on IBD reported by Pagnini et al. [29].
Moreover, cell proliferation and apoptosis were important factors influencing cancer growth. Konishi et al. [30] found that ferrichrome produced by the Lactobacillus inhibited colon cancer progression via c-Jun N-terminal kinase-mediated apoptosis. The expression level of caspase-3 was significantly higher in the AOM/DSS + Bs group than in the AOM/DSS group in this study, while the expression level of Ki-67 was significantly lower in the AOM/DSS + Bs group compared with that in the AOM/DSS group. All these results indicated that Bs intervention promoted apoptosis and inhibited proliferation in the AOM/DSS model. The specific mechanisms remain unclear and require further investigations, although they may be correlated with certain metabolic(s) derived from Bs.
Conclusions
In conclusions, Bs intervention reduced intestinal inflammation and DAI and significantly lowered the carcinogenesis rate; the underlying mechanisms may be correlated with the mediation of Bs intervention over variations in mouse intestinal floras by increasing the number of probiotics, inhibiting the reproduction of harmful bacteria, repairing intestinal mucosal barrier through upregulating the expression of intestinal mucosal TJ proteins, rendering the expression of proinflammatory cytokines, promoting the anti-inflammatory cytokines, and adjusting intestinal immunity, so as to relieve intestinal inflammations and inhibit the occurrence of CAC.
Acknowledgements
This research was funded by National Natural Science Foundation of China (grant number 81301708). The author would like to thank Beijing Hanmi Pharmaceutical Co. Ltd. for the kind provision of Bs freeze-dried powder (R0179).
Disclosure of conflict of interest
None.
Supporting Information
References
- 1.Dejea C, Wick E, Sears CL. Bacterial oncogenesis in the colon. Future Microbiol. 2013;8:445–460. doi: 10.2217/fmb.13.17. [DOI] [PMC free article] [PubMed] [Google Scholar]
- 2.Trinchieri G. Cancer and inflammation: an old intuition with rapidly evolving new concepts. Annu Rev Immunol. 2012;30:677–706. doi: 10.1146/annurev-immunol-020711-075008. [DOI] [PubMed] [Google Scholar]
- 3.Ekbom A, Helmick C, Zack M, Adami HO. Increased risk of large-bowel cancer in crohn’s disease with colonic involvement. Lancet. 1990;336:357–359. doi: 10.1016/0140-6736(90)91889-i. [DOI] [PubMed] [Google Scholar]
- 4.Jess T, Rungoe C, Peyrin-Biroulet L. Risk of colorectal cancer in patients with ulcerative colitis: a meta-analysis of population-based cohort studies. Clin Gastroenterol Hepatol. 2012;10:639–645. doi: 10.1016/j.cgh.2012.01.010. [DOI] [PubMed] [Google Scholar]
- 5.Terzic J, Grivennikov S, Karin E, Karin M. Inflammation and colon cancer. Gastroenterology. 2010;138:2101–2114. e2105. doi: 10.1053/j.gastro.2010.01.058. [DOI] [PubMed] [Google Scholar]
- 6.Ullman TA, Itzkowitz SH. Intestinal inflammation and cancer. Gastroenterology. 2011;140:1807–1816. doi: 10.1053/j.gastro.2011.01.057. [DOI] [PubMed] [Google Scholar]
- 7.Antonic V, Stojadinovic A, Kester KE, Weina PJ, Brucher BL, Protic M, Avital I, Izadjoo M. Significance of infectious agents in colorectal cancer development. J Cancer. 2013;4:227–240. doi: 10.7150/jca.5835. [DOI] [PMC free article] [PubMed] [Google Scholar]
- 8.Zur Hausen H. The search for infectious causes of human cancers: where and why. Virology. 2009;392:1–10. doi: 10.1016/j.virol.2009.06.001. [DOI] [PubMed] [Google Scholar]
- 9.Ley RE, Peterson DA, Gordon JI. Ecological and evolutionary forces shaping microbial diversity in the human intestine. Cell. 2006;124:837–848. doi: 10.1016/j.cell.2006.02.017. [DOI] [PubMed] [Google Scholar]
- 10.Arthur JC, Jobin C. The struggle within: microbial influences on colorectal cancer. Inflamm Bowel Dis. 2011;17:396–409. doi: 10.1002/ibd.21354. [DOI] [PMC free article] [PubMed] [Google Scholar]
- 11.Arthur JC, Perez-Chanona E, Muhlbauer M, Tomkovich S, Uronis JM, Fan TJ, Campbell BJ, Abujamel T, Dogan B, Rogers AB, Rhodes JM, Stintzi A, Simpson KW, Hansen JJ, Keku TO, Fodor AA, Jobin C. Intestinal inflammation targets cancer-inducing activity of the microbiota. Science. 2012;338:120–123. doi: 10.1126/science.1224820. [DOI] [PMC free article] [PubMed] [Google Scholar]
- 12.Liang X, Li H, Tian G, Li S. Dynamic microbe and molecule networks in a mouse model of colitis-associated colorectal cancer. Sci Rep. 2014;4:4985. doi: 10.1038/srep04985. [DOI] [PMC free article] [PubMed] [Google Scholar]
- 13.Isaacs K, Herfarth H. Role of probiotic therapy in IBD. Inflamm Bowel Dis. 2008;14:1597–1605. doi: 10.1002/ibd.20465. [DOI] [PubMed] [Google Scholar]
- 14.Bibiloni R, Fedorak RN, Tannock GW, Madsen KL, Gionchetti P, Campieri M, De Simone C, Sartor RB. VSL#3 probiotic-mixture induces remission in patients with active ulcerative colitis. Am J Gastroenterol. 2005;100:1539–1546. doi: 10.1111/j.1572-0241.2005.41794.x. [DOI] [PubMed] [Google Scholar]
- 15.Bolognani F, Rumney CJ, Pool-Zobel BL, Rowland IR. Effect of lactobacilli, bifidobacteria and inulin on the formation of aberrant crypt foci in rats. Eur J Nutr. 2001;40:293–300. doi: 10.1007/s394-001-8359-7. [DOI] [PubMed] [Google Scholar]
- 16.Danese S. Inflammatory bowel disease and inflammation-associated colon cancer: partners in crime. Curr Drug Targets. 2008;9:360. doi: 10.2174/138945008784221134. [DOI] [PubMed] [Google Scholar]
- 17.Gong Y, Li H, Li Y. Effects of bacillus subtilis on epithelial tight junctions of mice with inflammatory bowel disease. J Interferon Cytokine Res. 2016;36:75–85. doi: 10.1089/jir.2015.0030. [DOI] [PubMed] [Google Scholar]
- 18.Zhang HL, Li WS, Xu DN, Zheng WW, Liu Y, Chen J, Qiu ZB, Dorfman RG, Zhang J, Liu J. Mucosa-reparing and microbiota-balancing therapeutic effect of bacillus subtilis alleviates dextrate sulfate sodium-induced ulcerative colitis in mice. Exp Ther Med. 2016;12:2554–2562. doi: 10.3892/etm.2016.3686. [DOI] [PMC free article] [PubMed] [Google Scholar]
- 19.Tang A, Li N, Li X, Yang H, Wang W, Zhang L, Li G, Xiong W, Ma J, Shen S. Dynamic activation of the key pathways: linking colitis to colorectal cancer in a mouse model. Carcinogenesis. 2012;33:1375–1383. doi: 10.1093/carcin/bgs183. [DOI] [PubMed] [Google Scholar]
- 20.Khazaie K, Zadeh M, Khan MW, Bere P, Gounari F, Dennis K, Blatner NR, Owen JL, Klaenhammer TR, Mohamadzadeh M. Abating colon cancer polyposis by lactobacillus acidophilus deficient in lipoteichoic acid. Proc Natl Acad Sci U S A. 2012;109:10462–10467. doi: 10.1073/pnas.1207230109. [DOI] [PMC free article] [PubMed] [Google Scholar]
- 21.Dziarski R, Park SY, Kashyap DR, Dowd SE, Gupta D. Pglyrp-regulated gut microflora prevotella falsenii, parabacteroides distasonis and bacteroides eggerthii enhance and alistipes finegoldii attenuates colitis in mice. PLoS One. 2016;11:e0146162. doi: 10.1371/journal.pone.0146162. [DOI] [PMC free article] [PubMed] [Google Scholar]
- 22.Chen L, Tai WC, Brar MS, Leung FC, Hsiao WL. Tumor grafting induces changes of gut microbiota in athymic nude mice in the presence and absence of medicinal gynostemma saponins. PLoS One. 2015;10:e0126807. doi: 10.1371/journal.pone.0126807. [DOI] [PMC free article] [PubMed] [Google Scholar]
- 23.Chen HQ, Yang J, Zhang M, Zhou YK, Shen TY, Chu ZX, Zhang M, Hang XM, Jiang YQ, Qin HL. Lactobacillus plantarum ameliorates colonic epithelial barrier dysfunction by modulating the apical junctional complex and PepT1 in IL-10 knockout mice. Am J Physiol Gastrointest Liver Physiol. 2010;299:G1287–1297. doi: 10.1152/ajpgi.00196.2010. [DOI] [PubMed] [Google Scholar]
- 24.Fukuda S, Toh H, Hase K, Oshima K, Nakanishi Y, Yoshimura K, Tobe T, Clarke JM, Topping DL, Suzuki T, Taylor TD, Itoh K, Kikuchi J, Morita H, Hattori M, Ohno H. Bifidobacteria can protect from enteropathogenic infection through production of acetate. Nature. 2011;469:543–547. doi: 10.1038/nature09646. [DOI] [PubMed] [Google Scholar]
- 25.Mennigen R, Nolte K, Rijcken E, Utech M, Loeffler B, Senninger N, Bruewer M. Probiotic mixture VSL#3 protects the epithelial barrier by maintaining tight junction protein expression and preventing apoptosis in a murine model of colitis. Am J Physiol Gastrointest Liver Physiol. 2009;296:G1140–1149. doi: 10.1152/ajpgi.90534.2008. [DOI] [PubMed] [Google Scholar]
- 26.Bromberg J, Wang TC. Inflammation and cancer: IL-6 and STAT3 complete the link. Cancer Cell. 2009;15:79–80. doi: 10.1016/j.ccr.2009.01.009. [DOI] [PMC free article] [PubMed] [Google Scholar]
- 27.Grivennikov S, Karin E, Terzic J, Mucida D, Yu GY, Vallabhapurapu S, Scheller J, Rose-John S, Cheroutre H, Eckmann L, Karin M. IL-6 and stat3 are required for survival of intestinal epithelial cells and development of colitis-associated cancer. Cancer Cell. 2009;15:103–113. doi: 10.1016/j.ccr.2009.01.001. [DOI] [PMC free article] [PubMed] [Google Scholar]
- 28.Neufert C, Pickert G, Zheng Y, Wittkopf N, Warntjen M, Nikolaev A, Ouyang W, Neurath MF, Becker C. Activation of epithelial STAT3 regulates intestinal homeostasis. Cell Cycle. 2010;9:652–655. doi: 10.4161/cc.9.4.10615. [DOI] [PubMed] [Google Scholar]
- 29.Pagnini C, Saeed R, Bamias G, Arseneau KO, Pizarro TT, Cominelli F. Probiotics promote gut health through stimulation of epithelial innate immunity. Proc Natl Acad Sci U S A. 2010;107:454–459. doi: 10.1073/pnas.0910307107. [DOI] [PMC free article] [PubMed] [Google Scholar]
- 30.Konishi H, Fujiya M, Tanaka H, Ueno N, Moriichi K, Sasajima J, Ikuta K, Akutsu H, Tanabe H, Kohgo Y. Probiotic-derived ferrichrome inhibits colon cancer progression via JNK-mediated apoptosis. Nat Commun. 2016;7:12365. doi: 10.1038/ncomms12365. [DOI] [PMC free article] [PubMed] [Google Scholar]
Associated Data
This section collects any data citations, data availability statements, or supplementary materials included in this article.