Abstract
This study tested the hypothesis that melatonin (Mel) and adipose-derived mesenchymal stem cell-derived exosomes effectively suppress dextran sulfate sodium (DSS)-induced acute inflammatory colitis (AIC) in rats. To determine whether Mel-exosome treatment could ameliorate the severity of AIC, we treated Sprague Dawley rats with DSS-induced AIC with Mel, exosomes, or combined Mel-exosome therapy and evaluated the effects on AIC. First, to induce an inflammatory response in vitro, we treated HT-29 cells with lipopolysaccharide (LPS) and evaluated the response to Mel and/or exosome treatment. We found that expression of NOX-1, NOX-2, MMP-9, NF-κB, iNOS, ICAM-1, and COX-2 was significantly higher in HT-29 cells treated with LPS than in control cells, and was significantly reduced by either exosome or Mel treatment (P<0.001 for all). In vivo, flow cytometric analysis showed that, compared to untreated rats with AIC, the number of circulating inflammatory cells was lowest in rats treated with combined Mel-exosome treatment than in rats treated with either Mel or exosomes alone (P<0.0001). Compared with controls, as well as Mel or exosome treatment alone, combined Mel-exosome treatment ameliorated the effects of DSS-induced AIC as evidenced by changes in the expression of markers for inflammation, oxidative stress, apoptosis, and fibrosis (P<0.0001 for all). Additionally, histopathological findings showed that colon injury score, expression of inflammatory and DNA-damage markers, and bloody stool were all improved following combined Mel-exosome treatment (P<0.0001 for all). In conclusion, combined Mel-exosome treatment significantly protected the rat colon against DSS-induced AIC injury.
Keywords: Dextran sulfate sodium, acute colitis, inflammation, oxidative stress, melatonin, exosome
Introduction
Ulcerative colitis (UC) and Crohn’s disease are two conditions known as a whole as inflammatory bowel disease. The incidence of UC is estimated to vary from 0.5 to 24.5 per 100,000 inhabitants worldwide [1]. It is well recognized that UC is a chronic inflammatory disease with unknown etiology and partially understood pathogenesis [2-4]. Starting from the rectum, the disease may frequently involve varying lengths of colonic mucosa and typical clinical presentations are rectal bleeding and diarrhea. Additionally, at least 11% of patients with UC have extra-intestinal manifestations such as joint involvement, hepatobiliary disease, and several types of eye and skin lesions [1]. These symptoms frequently affect a patient’s quality of life, everyday function, and may lead to psycho-social incapacitation.
The main treatment for UC includes initial medical management with corticosteroids and anti-inflammatory agents (e.g., sulfasalazine or 5-aminosalicylate drugs) in combination with rehydration and symptomatic treatment using antidiarrheal agents. Surgery is considered when medical treatment fails or when a surgical emergency occurs (e.g., perforation of the colon). Surgical approaches including total colectomy (panproctocolectomy) and ileostomy, total colectomy, and ileoanal pouch reconstruction or ileorectal anastomosis; subtotal colectomy with end-ileostomy is recommended in an emergency situation [5]. Currently, the treatment of UC remains a formidable challenge to clinicians. Not only are the current therapeutic modalities only partially effective, but they are also frequently associated with undesirable systemic side effects. Therefore, a safe and effective therapy is eagerly desired by patients with persistent UC.
Accumulating evidence has shown that mesenchymal stem cells (MSCs), especially adipose-derived MSCs (ADMSCs), have therapeutic potential because of their pro-angiogenic, anti-inflammatory, and immunomodulatory properties against ischemia-related organ dysfunction [6,7]. Exosomes, which are micro-vesicles derived from a variety of cells (e.g., activated or apoptotic cells), are membrane fragments with sizes ranging from 60-120 nm [8-10]. Additionally, depending on the cell type from which they are secreted, exosomes contain a rich collection of microRNAs [11]. Furthermore, previous studies have demonstrated that MSC-derived exosomes have distinctive properties, namely, promotion of angiogenesis, immunomodulation, and paracrine effects that preserve organ function following injury in preclinical studies [11-14].
Melatonin (Mel) (N-acetyl-5-methoxytryptamine), a hormone mainly produced by the mitochondria of the pineal gland, is a ubiquitous free radial scavenger that exerts anti-oxidative effects and ameliorates damage caused by reactive oxygen and nitrogen species in all subcellular compartments [15-19]. In addition, a number of studies have suggested that the anti-inflammatory effects of Mel are attributable to its ability to regulate different molecular pathways [16,20,21]. Accordingly, the present study tested the hypothesis that Mel-exosome therapy protects the colon against acute inflammatory colitis (AIC) in rats.
Materials and methods
Ethics
All animal experimental procedures were approved by the Institute of Animal Care and Use Committee at Kaohsiung Chang Gung Memorial Hospital (Affidavit of Approval of Animal Use Protocol No. 2015111602) and performed in accordance with the Guide for the Care and Use of Laboratory Animals (The Eighth Edition of the Guide for the Care and Use of Laboratory Animals [NRC 2011]).
Animals purchased from BioLASCO Taiwan Co., Ltd. were housed in an Association for Assessment and Accreditation of Laboratory Animal Care International-approved animal facility in our hospital with controlled temperature and light cycle (24°C and 12/12 light cycle).
Animal grouping
Animals (n = 60) were categorized into the following treatment groups: group 1 (sham control (SC)), group 2 (AIC), group 3 (AIC + exosomes [50 μM/kg days 5, 7, and 10 after dextran sodium sulfate (DSS) administration]), group 4 (AIC + Mel [50 mg/kg/day on day 5 after DSS administration]), and group 5 (AIC + Melexosome).
DSS-induced AIC model in rats
DSS is a water-soluble, negatively charged sulfated polysaccharide with a highly variable molecular weight ranging from 5 to 1400 kDa. The most severe murine colitis, which closely resembles human UC, can be induced following administration of 40-50 kDa DSS in the drinking water. The mechanism by which DSS induces intestinal inflammation is likely the result of damage to the epithelial monolayer lining of the large intestine, which allows the dissemination of proinflammatory intestinal contents (e.g. bacteria and their products) into underlying tissue. The DSS colitis model is very popular in inflammatory bowel disease research due to its rapidity, simplicity, reproducibility, controllability, and morphological and symptomatic resemblance to UC in humans. Acute, chronic, and relapsing models of intestinal inflammation can be achieved by modifying the concentration of DSS and the frequency of administration [22,23].
Here, our experimental model of AIC in rats was induced by adding 5% (w/v) DSS (45 kDa; TdB Consultance, Uppsala, Sweden) in the drinking water for 5 days. The 5% DSS solution was prepared daily using tap water. Animals were euthanized by day 14 after AIC induction, and the colon and circulatory blood were collected for individual study.
Cell culture and lipopolysaccharide (LPS) treatment
The HT-29 human mucus-secreting adenocarcinoma cell line (ATCC® HTB-38TM; American Type Culture Collection, Manassas, VA, USA) was cultured in Dulbecco’s modified Eagle’s minimal essential medium (DMEM; Sigma, St. Louis, MO, USA) supplemented with 10% (v/v) heat-inactivated (56°C for 30 min) fetal bovine serum (FBS; Sigma), 25 mM HEPES (Sigma), 100 U/mL penicillin (Sigma, USA), and 100 l g/mL streptomycin (Sigma) in 25 cm2 culture flasks (Falcon, Beckton Dickinson, Sparks, MD, USA) at 37°C in 5% CO2. The cultures were supplied with fresh medium every other day and trypsinized using a 0.25% Trypsin-EDTA solution (Sigma) at 37°C. The final cell counts in suspension were measured using a hemocytometer. The cell suspension (1 × 10⁵ cells) was prepared in 4 mL complete DMEM and transferred to six-well tissue culture plates (Falcon 6-well, Beckton Dickinson). Medium was changed every other day.
To elucidate whether Mel and exosomes exerted anti-inflammatory and anti-oxidative stress effects, HT-29 cells were treated with LPS as an inflammatory stimulator and split into four treatment groups: (1) control group (PBS-treated) (1.0 × 10⁵/well), (2) HT-29 cells (1.0 × 10⁵) + LPS (1.0 μg/mL), (3) HT-29 cells (1.0 × 10⁵) + exosomes (50.0 μM) + LPS (1.0 μg/mL), and (4) HT-29 cells (1.0 × 10⁵) + Mel (100 μM) + LPS (1.0 μg/mL). HT-29 cells were pre-treated with exosomes or Mel for 3 h prior to adding LPS for 2 h, followed by LPS washout. The cells were then continuously cultured for 6 hours prior to being collected for analysis.
Isolation of ADMSCs
To prepare allogenic ADMSCs, eight Sprague Dawley rats were used. Adipose tissue surrounding the epididymis was carefully dissected, excised, and prepared using methods published in our previous reports [6,7]. After preprocessing, cell pellets were centrifuged at 600 × g for 5 minutes at room temperature and filtered through a 100 μm filter into a 50-mL conical tube. The flow-through was pipetted into a new 50 mL conical tube through a 40 μm filter. The tubes were centrifuged again at 600 × g for 5 minutes at room temperature and resuspended in saline. An aliquot of cell suspension was removed for cell culture in DMEM-low glucose medium containing 10% FBS for 14 days. Approximately 2.0-3.0 × 10⁶ ADMSCs were obtained from each rat.
Preparation, isolation, and dosage of exosomes
The preparation, isolation, and dosage of ADMSC-derived exosome were performed according to our previously published method [24]. Briefly, exosomes were isolated from the culture medium of ADMSCs. The exosomes were then purified and the proteins in different exosome fractions (1 μg, 2 μg, 10 μg, and 50 μg) were separated by SDS-PAGE. The resulting gel was stained with Coomassie blue for analysis. The following primary antibodies were used: mouse monoclonal anti-CD63 (Santa Cruz Biotechnology, Dallas, TX, USA), rabbit polyclonal anti-tumor susceptibility gene-101 (TSG101) (Abcam, Cambridge, MA, USA), and anti-β-catenin (Abcam).
Histopathological scoring assessment of colon injury
The criteria for assessing the mucosal damage of colon were based on our previous report with minimal modification [25]. Briefly, colon specimens were fixed in 4% paraformaldehyde; the crypt-villus orientation was maintained during the embedding procedure. Sections of 4 µm thickness were stained with hematoxylin and eosin (H&E). The degree of colon injury was evaluated using a light microscope by two senior technicians blinded to the treatment protocol.
Briefly, the injury score of colon was categorized from 0 to 5 based on the following criteria: grade 0 = mucosa with normal villi; grade 1 = development of sub-epithelial space at villus apex, frequently associated with capillary congestion; grade 2 = scattered epithelial denudation on villus tips; grade 3 = denuded tips with exposed lamina propria and villus blunting; grade 4 = epithelial shedding from both the apex and mid-region of the villi, associated with shortened and widened villus structure and exposure of dilated capillaries; grade 5 = complete destruction of villi and disintegration of lamina propria with ulceration.
Assessment of oxidative stress
The procedure and protocol for evaluating the protein expression of oxidative stress have been described in detail in our previous reports [6,7,25]. The Oxyblot Oxidized Protein Detection Kit was purchased from Chemicon (Billerica, MA, USA; S7150). DNPH (2,4-dinitrophenylhydrazine) derivatization was carried out on 6 μg of protein for 15 minutes according to the manufacturer’s instructions. One-dimensional electrophoresis was carried out on a 12% SDS-polyacrylamide gel after DNPH derivatization. Proteins were transferred to nitrocellulose membranes that were then incubated in the primary antibody solution (anti-dinitrophenol (DNP) 1:150) for 2 hours, followed by incubation in the secondary antibody solution (1:300) for 1 hour at room temperature. The washing procedure was repeated eight times within 40 minutes. Immunoreactive bands were visualized by enhanced chemiluminescence (ECL; Amersham Biosciences, Amersham, UK) which was then exposed to Biomax L film (Kodak, Rochester, NY, USA). For quantification, ECL signals were digitized using Labwork software (UVP, Waltham, MA, USA). For oxyblot protein analysis, a standard control was loaded on each gel.
Immunohistochemical (IHC) and immunofluorescent (IF) staining
The procedure and protocol for IF staining have been described in detail in our previous reports [6,7,25]. For IHC and IF staining, rehydrated paraffin sections were first treated with 3% H2O2 for 30 minutes and incubated with Immuno-Block reagent (BioSB, Santa Barbara, CA, USA) for 30 minutes at room temperature. Sections were then incubated with primary antibodies specifically against intercellular adhesion molecule (ICAM)-1 (1:200, Abcam), Cox-2 (1:100, Abcam), NAD(P)H quinone dehydrogenase (NQO1) (1:400, Abcam), glutathione peroxidase (GPx) (1:400, Abcam), CD14 (1:200, Santa Cruz Biotechnology), CD68 (1:100, Abcam), γ-H2AX (1:500, Abcam), CD3 (1:400, Abcam), CD4 (1:500, GeneTex, CA, USA), while sections incubated with the use of irrelevant antibodies served as controls. Three sections of the kidney from each rat were analyzed. For quantification, three randomly selected high-power fields (HPFs) (200 × or 400 × for IHC and IF studies) were analyzed in each section. The mean number of positively stained cells per HPF for each animal was then determined by summing all numbers and dividing by 9.
An IHC-based blinded scoring system was adopted for semi-quantitative analyses of NQO1 and GPx staining in the colon as a percentage of positive cells (score of positively stained cells: 0 = negative staining; 1 = <15%; 2 = 15-25%; 3 = 25-50%; 4 = 50-75%; 5 = >75%-100%/per HPF).
Western blot analysis
The procedure and protocol for western blot analysis were based on our recent reports [6,7,25]. Briefly, equal amounts (50 μg) of protein extracts were loaded and separated by SDS-PAGE using acrylamide gradients. After electrophoresis, the separated proteins were transferred electrophoretically to a polyvinylidene difluoride membrane (Amersham Biosciences). Nonspecific sites were blocked by incubating the membrane in blocking buffer (5% nonfat dry milk in T-Tris-buffered saline [TBS containing 0.05% Tween-20]) overnight. The membranes were then incubated with the indicated primary antibodies for 1 hour at room temperature. Primary antibodies included: matrix metalloproteinase (MMP)-9 (1:3000, Abcam), tumor necrosis factor (TNF)-α (1:1000, Cell Signaling, Danvers, MA, USA), nuclear factor (NF)-κB (1:600, Abcam), interleukin (IL)-1β (1:1000, Cell Signaling), ICAM-1 (1:1000, Abcam), IL-6 (1:750, Abcam), IL-10 (1:1000, Abcam), toll-like receptor (TLR)-4 (1:500, Novus Biologicals, Littleton, CO, USA), NOX-1 (1:1500, Sigma), NOX-2 (1:750, Sigma), NOX-4 (1:1000, Abcam), Cox-2 (1:1000, Abcam), mitochondrial Bax (1:1000, Abcam), cleaved (c) caspase (c-Casp 3) (1:1000, Cell Signaling), cleaved poly (ADP-ribose) polymerase (c-PARP) (1:1000, Cell Signaling), inducible nitric oxide synthase (iNOS) (1:250, Abcam), phosphorylated (p)-Smad3 (1:1000, Cell Signaling), p-Smad1/5 (1:1000, Cell Signaling), transforming growth factor (TGF)-1β (1:5000, Abcam), bone morphogenetic protein (BMP)-2 (1:500, Abcam), NQO1 (1:1000, Abcam), HO-1 (1:500, Merck, San Diego, CA United States), and actin (1:10000, Chemicon, Billerica, MA, USA). Membranes were incubated with a horseradish peroxidase-conjugated anti-rabbit immunoglobulin IgG (1:2000, Cell Signaling) secondary antibody for 1 hour incubation at room temperature. The washing procedure was repeated eight times within 1 hour. Immunoreactive bands were visualized by enhanced chemiluminescence (ECL; Amersham Biosciences) and were exposed to Biomax L film (Kodak, Rochester, NY, USA). For the purpose of quantification, ECL signals were digitized using Labwork software (UVP).
Fluorescein-based (FITC-dextran 4-kDa) gut permeability assay
To assess gut permeability in vivo, a fluorescein-based assay was performed according to previous [26] and our recent [25] studies with some modifications. By day 14 after AIC induction, the lumen of a colon segment (10-15 cm) of each group of animals was carefully clamped. The 4-kDa FITC-conjugated dextran (FD4; Sigma), dissolved in Krebs buffer and protected from light, was immediately administered into the lumen of the clamped colon segment at a final concentration of 0.5 mg/mL. One hour after colon clamping, the clamp was released, and the abdominal wall was closed. Following the 60 minutes of colon clamping, 0.5 mL of arterial blood was sampled, from which the plasma was obtained. Fluorescence intensity of the plasma was then quickly measured at an excitation/emission wavelength of 496/520 nm using a plate reader. The concentration (mg/mL) of FD4 in plasma was calculated using a standard curve.
Statistical analysis
Quantitative data were expressed as mean ± standard deviation (SD). Statistical analysis was performed using ANOVA, followed by the Bonferroni multiple-comparison post hoc test. SAS statistical software for Windows version 8.2 (SAS institute, Cary, NC) was utilized. A probability value <0.05 was considered statistically significant.
Results
Effects of Mel and exosomes on inhibition of LPS-induced inflammation and oxidative stress
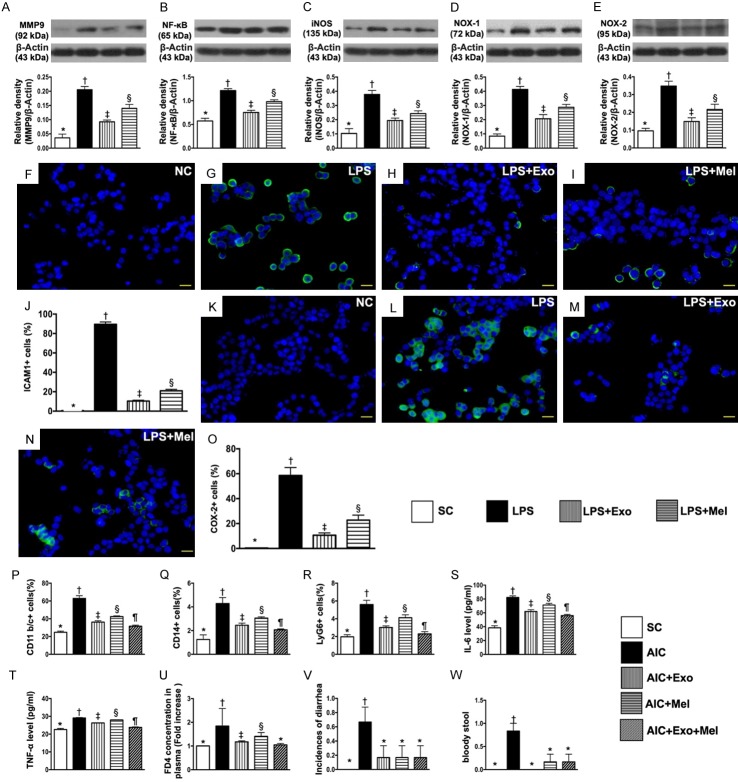
As expected, the protein expression of MMP-9, NF-κB and iNOS, three indicators of inflammation, was highest in LPS-treated HT-29 cells and lowest in the control group (Figure 1A-C). Additionally, we found that levels of these inflammation markers were significantly higher in HT-29 cells treated with LPS and Mel than in HT-29 cells treated with LPS and exosomes. The protein expression of NOX-1 and NOX-2, two indices of oxidative stress, exhibited an identical pattern of inflammation across the four groups (Figure 1D, 1E). Our findings suggested that both Mel and exosome treatment had anti-inflammation and anti-oxidative stress effects on HT-29 cells. Cellular expression of positively stained ICAM-1 and COX-2, two indicators of cellular inflammatory biomarkers, revealed an identical pattern of protein inflammatory biomarkers (Figure 1F-O).
Figure 1.
Effects of melatonin and exosome on inhibiting LPS-induced inflammation and oxidative stress in culturing HT-29 cells, flow cytometric/ELISA analyses of circulating inflammatory biomarkers and stool assessment by day 14 after AIC induction, and assessment of fluorescein-based gut permeability by 90 min interval. A. Protein expression of matrix metalloproteinase (MMP)-9, * vs. other groups with different symbols (†, ‡, §), P<0.0001. B. Protein expression of nuclear factor (NF)-κB, * vs. other groups with different symbols (†, ‡, §), P<0.001. C. Protein expression of inducible nitric oxide synthase (iNOS), * vs. other groups with different symbols (†, ‡, §), P<0.0001. D. Protein expression of NOX-1, * vs. other groups with different symbols (†, ‡, §), P<0.0001. E. Protein expression of NOX-2, * vs. other groups with different symbols (†, ‡, §), P<0.0001. F-I. Showing immunofluorescent (IF) microscopic finding (400 ×) of cellular expression of intercellular adhesion molecule (ICAM)-1 (green color). J. Analytical result of number of ICAM-1+ cells, * vs. other groups with different symbols (†, ‡, §), P<0.0001. K-N. Showing IF microscopic finding (400 ×) of cellular expression of Cox-2 (green color). O. Analytical result of number of Cox-2+ cells, * vs. other groups with different symbols (†, ‡, §), P<0.0001. Scale bars in right lower corner represent 20 µm. NC = normal control (i.e., treated by vehicles); LPS = lipopolysaccharide; Mel = melatonin; Exo = exosome. P. Flow cytometric analysis of circulating number of CD11b/c+ cells, * vs. other groups with different symbols (†, ‡, §, ¶), P<0.0001. Q. Flow cytometric analysis of circulating number of CD14+ cells, * vs. other groups with different symbols (†, ‡, §, ¶), P<0.0001. R. Flow cytometric analysis of circulating number of Ly6G+ cells, * vs. other groups with different symbols (†, ‡, §, ¶), P<0.0001. S. ELISA analysis of circulating level of IL-6, * vs. other groups with different symbols (†, ‡, §, ¶), P<0.0001. T. ELISA analysis of circulating level of TNF-1α, * vs. other groups with different symbols (†, ‡, §, ¶), P<0.0001. U. Th ratio of plasma concentration of FD4, * vs. other groups with different symbols (†, ‡, §), P<0.0001. V. The incidences of diarrhea >5 days, * vs. †, P<0.001. W. The incidence of bloody stool, * vs. †, P<0.001. All statistical analyses were performed by one-way ANOVA, followed by Bonferroni multiple comparison post hoc test (n = 6 for each group). Symbols (*, †, ‡, §, ¶) indicate significance at the 0.05 level. SC = sham control; AIC = acute inflammatory colitis; Mel = melatonin; Exo = exosome.
The result of flow cytometric analysis of circulating inflammatory biomarkers showed that the numbers of circulating cells expressing CD11b/c+, CD14+, and Ly6G+, three indicators of inflammatory biomarkers, were highest in untreated rats with AIC, lowest in SC rats, significantly higher in the AIC-Mel group than in AIC-exosome and AIC-exosome-Mel groups, and significantly higher in the AIC-exosome group than in AIC-exosome-Mel group (Figure 1P-R). Additionally, ELISA analysis showed that the circulating level of IL-6 and TNF-α, two inflammatory mediators, reflected the same expression pattern across the five groups as the flow-cytometry analysis (Figure 1S, 1T).
To confirm the increase of gut permeability, an index of mucosal barrier damage was assessed using a fluorescein-based gut permeability assay in rats with DSS-induced AIC. The results showed that the ratio of plasma concentration of FD4 was lowest in SC and AIC-exosome-Mel groups, highest in the AIC group, and significantly higher in the AIC-Mel group than in the AIC-exosome group; there was no difference in FD4 concentration between SC and AIC-exosome-Mel groups (Figure 1U). We also found that the incidence of bloody stool and diarrhea >5 days in the five groups followed the same pattern as the flow cytometry results (Figure 1V, 1W).
The effects of Mel and exosome treatment on expression of inflammatory and oxidative stress biomarkers following DSS-induced AIC
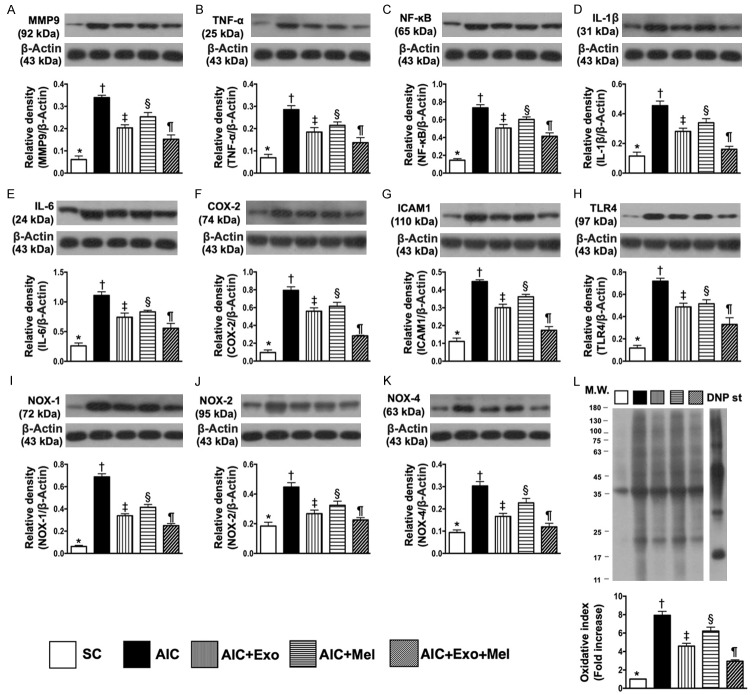
We evaluated the protein expression of MMP-9, TNF-α, NF-κB, IL-1β, IL-6, Cox-2, ICAM-1, and TLR-4 in the colon 14 days after induction of AIC by DSS treatment. We found that expression of these eight inflammatory biomarkers were highest in the colons of rats with AIC, lowest in SC colons, significantly higher in the colons of AIC-Mel-treated rats than in the colons of AIC-exosome- and AIC-exosome-Mel-treated rats, and significantly higher in AIC-exosome-treated colons than in AIC-exosome-Mel-treated colons (Figure 2A-H). Additionally, the protein expression of NOX-1, NOX-2, NOX-4, and oxidized protein, four indicators of oxidative stress, were highest in the colons of untreated rats with AIC, lowest in SC colons, significantly higher in the colons of rats treated with AIC-Mel than with AIC-exosome and AIC-exosome-Mel, and significantly higher in the colons of AIC-exosome-treated rats than in AIC-exosome-Mel-treated rats (Figure 2I-L).
Figure 2.
Protein expressions of inflammatory biomarkers and oxidative stress biomarkers in colon by day 14 after AIC induction. A. Protein expression of matrix metalloproteinase (MMP)-9, * vs. other groups with different symbols (†, ‡, §, ¶), P<0.0001. B. Protein expression of tumor necrosis factor (TNF)-α, * vs. other groups with different symbols (†, ‡, §, ¶), P<0.0001. C. Protein expression of nuclear factor (NF)-κB, * vs. other groups with different symbols (†, ‡, §, ¶), P<0.0001. D. Protein expression of interleukin (IL-1β), * vs. other groups with different symbols (†, ‡, §, ¶), P<0.0001. E. Protein expression of IL-6, * vs. other groups with different symbols (†, ‡, §, ¶), P<0.0001. F. Protein expression of Cox-2, * vs. other groups with different symbols (†, ‡, §, ¶), P<0.0001. G. Protein expression of intercellular adhesion molecule (ICAM)-1, * vs. other groups with different symbols (†, ‡, §, ¶), P<0.0001. H. Protein expression of toll-like receptor 4 (TLR4), * vs. other groups with different symbols (†, ‡, §, ¶), P<0.0001. I. Protein expression of NOX-1, * vs. other groups with different symbols (†, ‡, §, ¶), P<0.0001. J. Protein expression of NOX-2, * vs. other groups with different symbols (†, ‡, §, ¶), P<0.001. K. Protein expression of NOX-4, * vs. other groups with different symbols (†, ‡, §, ¶), P<0.0001. L. Oxidized protein expression, * vs. other groups with different symbols (†, ‡, §, ¶), P<0.0001. (Note: left and right lanes shown on the upper panel represent protein molecular weight marker and control oxidized molecular protein standard, respectively). M.W = molecular weight; DNP = 1-3 dinitrophenylhydrazone. All statistical analyses were performed by one-way ANOVA, followed by Bonferroni multiple comparison post hoc test (n = 6 for each group). Symbols (*, †, ‡, §, ¶) indicate significance at the 0.05 level. SC = sham control; AIC = acute inflammatory colitis; Mel = melatonin; Exo = exosome.
The effects of Mel and exosome treatment on protein expression of apoptotic, fibrotic, anti-inflammatory, anti-fibrotic, and antioxidant biomarkers following DSS-induced AIC
To determine whether Mel or exosome treatment affected AIC-induced apoptosis, we examined the protein expression of mitochondrial Bax, cleaved caspase 3, and cleaved PARP, three apoptosis markers in the colons of rats 14 days after AIC induction (Figure 3A-C). We found that expression of these markers was highest in untreated rats with AIC, lowest in the colons of SC rats, significantly higher in AIC-Mel-treated colons than in AIC-exosome- and AIC-exosome-Mel-treated rat colons, and significantly higher in AIC-exosome-treated colons than in those from AIC-exosome-Mel-treated rats. Additionally, the protein expressions of Smad3 and TGF-β, two indicators of fibrosis, demonstrated the same pattern as the apoptotic markers among the five groups (Figure 3D, 3E).
Figure 3.
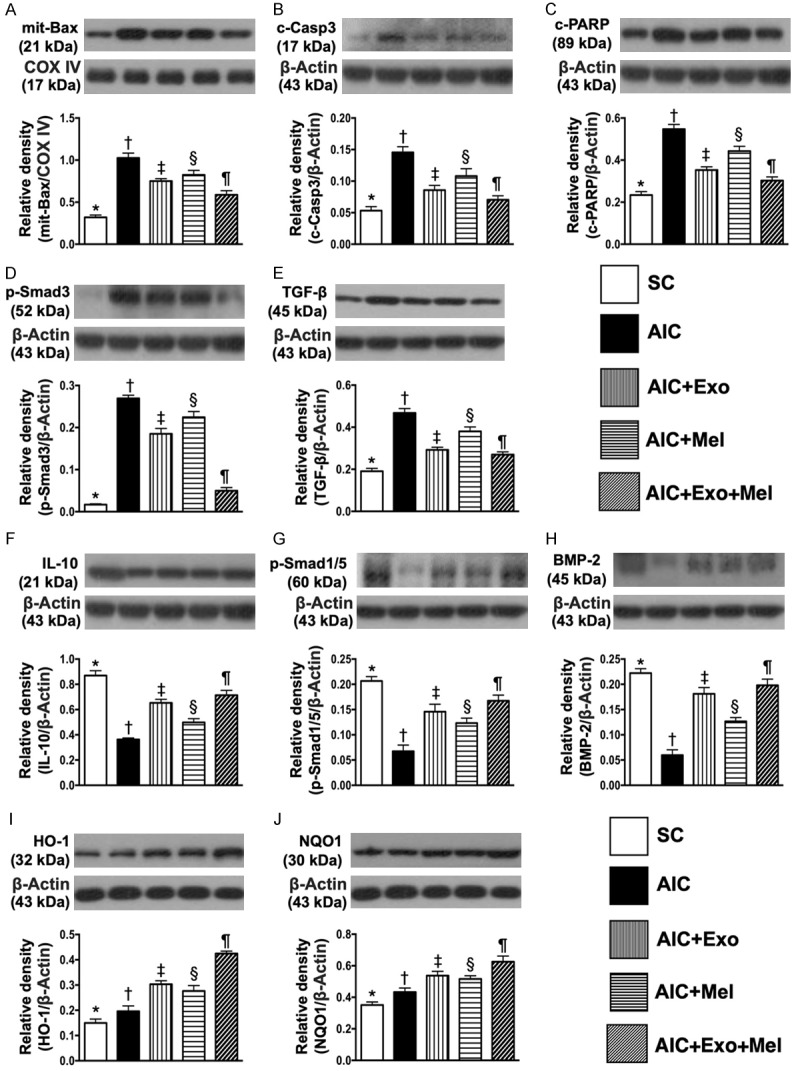
Protein expressions of apoptotic, fibrotic, anti-inflammatory, anti-fibrotic and antioxidant biomarkers in colon by day 14 after AIC induction. A. Protein expression of mitochondrial Bax, * vs. other groups with different symbols (†, ‡, §, ¶), P<0.0001. B. Protein expression of cleaved caspase 3 (c-Casp 3), * vs. other groups with different symbols (†, ‡, §, ¶), P<0.0001. C. Protein expression of cleaved poly (ADP-ribose) polymerase (c-PARP), * vs. other groups with different symbols (†, ‡, §, ¶), P<0.0001. D. Protein expression of phosphorylated (p)-Smad3, * vs. other groups with different symbols (†, ‡, §, ¶), P<0.0001. E. Protein expression of transforming growth factor (TGF)-β, * vs. other groups with different symbols (†, ‡, §, ¶), P<0.0001. F. Protein expression of interleukin (IL)-10, * vs. other groups with different symbols (†, ‡, §, ¶), P<0.0001. G. Protein expression of phosphorylated (p)-Smad1/5, * vs. other groups with different symbols (†, ‡, §, ¶), P<0.0001. H. Protein expression of bone morphogenic protein (BMP)-2, * vs. other groups with different symbols (†, ‡, §, ¶), P<0.0001. I. Protein expression of heme-oxygenase (HO)-1, * vs. other groups with different symbols (†, ‡, §, ¶), P<0.0001. J. Protein expression of NQO1, * vs. other groups with different symbols (†, ‡, §, ¶), P<0.001. All statistical analyses were performed by one-way ANOVA, followed by Bonferroni multiple comparison post hoc test (n = 6 for each group). Symbols (*, †, ‡, §, ¶) indicate significance at the 0.05 level. SC = sham control; AIC = acute inflammatory colitis; Mel = melatonin; Exo = exosome.
The protein expression of IL-10, an anti-inflammatory marker, was highest in SC rats, lowest in untreated rats with AIC, significantly lower in the colons of AIC-Mel-treated rats than in AIC-exosome- and AIC-exosome-Mel-treated rats, and significantly lower in the colons of AIC-exosome-treated rats than in those treated with AIC-exosome-Mel. Additionally, the protein expressions of Smad1/5 and BMP-2, two indices of anti-fibrosis, exhibited an identical expression pattern as IL-10 across the five groups (Figure 3F-H).
The protein expression of HO-1 and NQO1, two indicators of antioxidant activity, were lowest in SC rats, highest in the colons of AIC-exosome-Mel-treated rats, significantly lower in the colons of untreated rats with AIC than in those treated with AIC-Mel and AIC-exosome, and significantly lower in those treated with AIC-Mel than AIC-exosome (Figure 3I, 3J). Together, these results suggest an intrinsic response to acute inflammatory stimulation occurs in the colon and is further enhanced by Mel-exosome therapy.
Effects of Mel and exosome treatment on colon injury score and DNA-damage biomarkers following DSS-induced AIC
Fourteen days after induction of AIC, H&E staining demonstrated that colon injury scores were highest in rats with untreated AIC, lowest in SC rats, significantly higher in rats treated with AIC-Mel than AIC-exosome and AIC-exosome-Mel, and significantly higher in rats treated with AIC-exosome than AIC-exosome-Mel (Figure 4A-F). Additionally, the cellular expression of γ-H2AX, an indicator of DNA-damage, exhibited an identical pattern as the colon injury scores across the five groups (Figure 4G-L).
Figure 4.
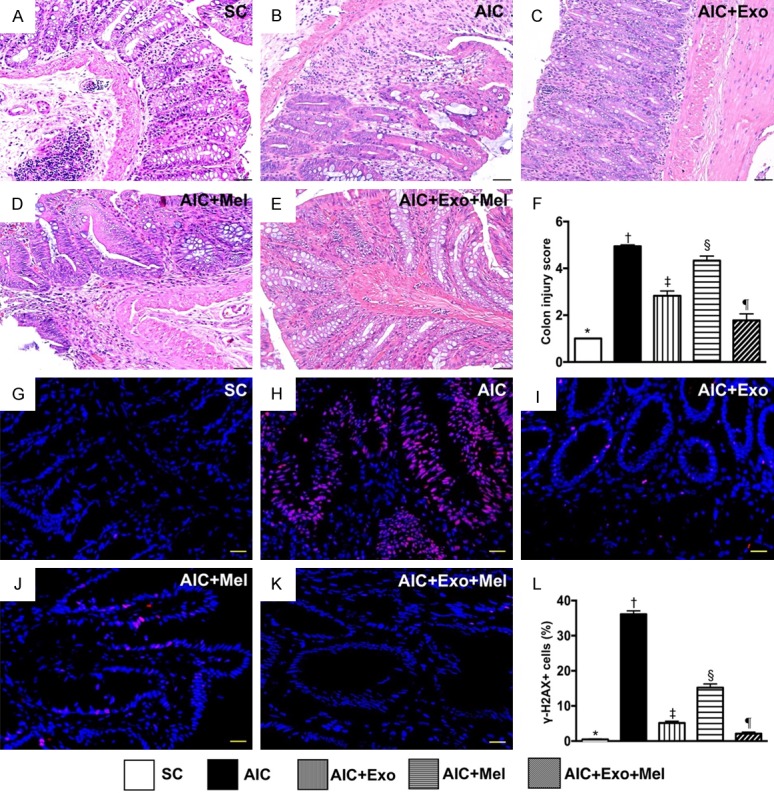
Assessment of colon injury score and DNA-damaged biomarker in colon by day 14 after AIC induction. A-E. Showing the pathological finding of H.E. stain (200 ×) for identification of colon injury scores. F. Analytical result of colon injury score, * vs. other groups with different symbols (†, ‡, §, ¶), P<0.0001. Scale bars in right lower corner represent 50 µm. G-K. Showing the immunofluorescent microscopic finding (400 ×) for identification of positively-stained γ-H2AX cells (pink color). L. Analytical result of number of γ-H2AX+ cells, * vs. other groups with different symbols (†, ‡, §, ¶), P<0.0001. Scale bars in right lower corner represent 20 µm. All statistical analyses were performed by one-way ANOVA, followed by Bonferroni multiple comparison post hoc test (n = 6 for each group). Symbols (*, †, ‡, §, ¶) indicate significance at the 0.05 level. SC = sham control; AIC = acute inflammatory colitis; Mel = melatonin; Exo = exosome.
Effect of Mel and exosome treatment on inflammatory biomarkers
To determine whether Mel and exosome treatments affect inflammation, we examined the cellular expression CD14 and CD68, two inflammatory biomarkers 14 days after induction of AIC. We found that expression of CD14 and CD68 were highest in untreated rats with AIC, lowest in SC rats, significantly higher in those treated with AIC-Mel than AIC-exosome and AIC-exosome-Mel, and significantly higher in rats treated with AIC-exosome than AIC-exosome-Mel (Figure 5). Additionally, the cellular expression of ICAM-1 and Cox-2, two additional inflammatory biomarkers, exhibited an identical expression pattern as CD14 across the five groups (Figure 6).
Figure 5.
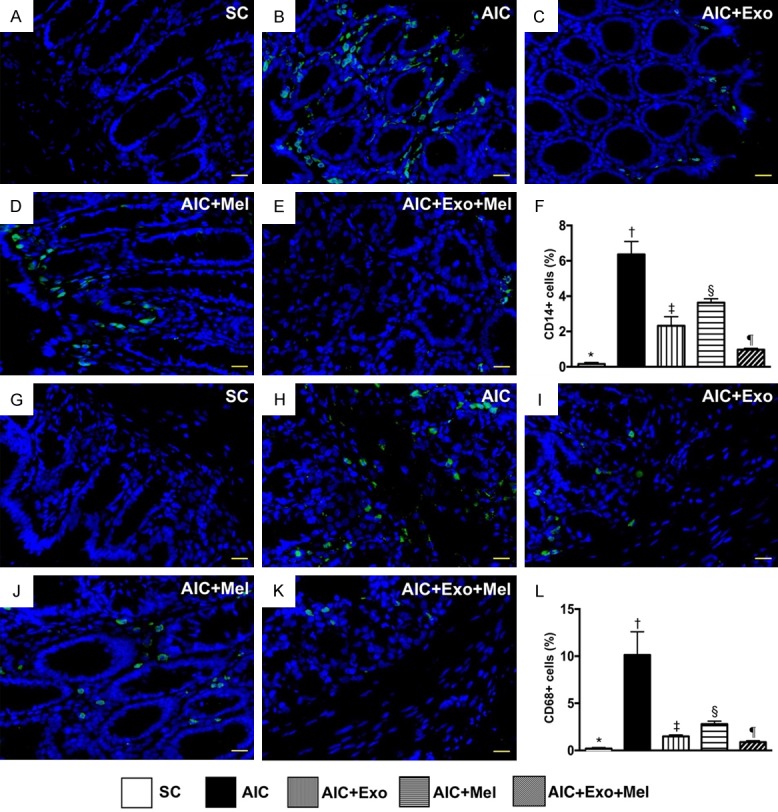
Cellular expressions of inflammation in colon by day 14 after AIC induction. A-E. Illustrating the immunofluorescent (IF) microscopic finding (400 ×) for identification of positively-stained CD14 cells (green color). F. Analytical result of number of CD14+ cells, * vs. other groups with different symbols (†, ‡, §, ¶), P<0.0001. G-K. Illustrating the IF microscopic finding (400 ×) for identification of positively-stained CD68 cells (green color). L. Analytical result of number of CD68+ cells, * vs. other groups with different symbols (†, ‡, §, ¶), P<0.0001. Scale bars in right lower corner represent 20 µm. All statistical analyses were performed by one-way ANOVA, followed by Bonferroni multiple comparison post hoc test (n = 6 for each group). Symbols (*, †, ‡, §, ¶) indicate significance at the 0.05 level. SC = sham control; AIC = acute inflammatory colitis; Mel = melatonin; Exo = exosome.
Figure 6.
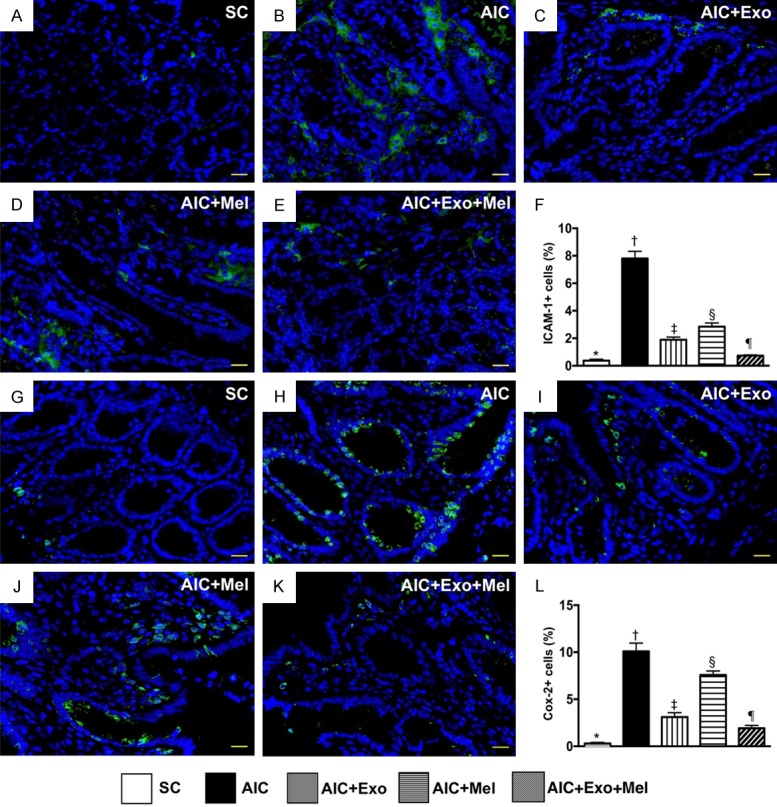
Inflammatory cell infiltration in colon by day 14 after AIC induction. A-E. Illustrating the immunofluorescent (IF) microscopic finding (400 ×) for identification of positively-stained intercellular adhesion molecule (ICAM)-1 cells. F. Analytical result of number of ICAM-1+ cells, * vs. other groups with different symbols (†, ‡, §, ¶), P<0.0001. G-K. Illustrating the IF microscopic finding (400 ×) for identification of positively-stained Cox-2 cells (green color). L. Analytical result of number of Cox-2+ cells, * vs. other groups with different symbols (†, ‡, §, ¶), P<0.0001. Scale bars in right lower corner represent 20 µm. All statistical analyses were performed by one-way ANOVA, followed by Bonferroni multiple comparison post hoc test (n = 6 for each group). Symbols (*, †, ‡, §, ¶) indicate significance at the 0.05 level. SC = sham control; AIC = acute inflammatory colitis; Mel = melatonin; Exo = exosome.
Effect of Mel and exosome treatment on cellular expression of antioxidants
To determine whether Mel and exosome treatment affect antioxidant activity, we measured expression of NQO1 and GPx, two markers of antioxidant activity, in the colon 14 days after induction of AIC. We found that NQO1 and GPx were lowest in SC rats, highest in rats with untreated AIC, significantly higher in rats treated with AIC-Mel than AIC-exosome and AIC-Mel-exosome, and significantly higher in those treated with AIC-exosome than AIC-exosome-Mel (Figure 7), suggesting an intrinsic response to acute inflammatory stimulation occurs in colon that is attenuated by Mel-exosome therapy.
Figure 7.
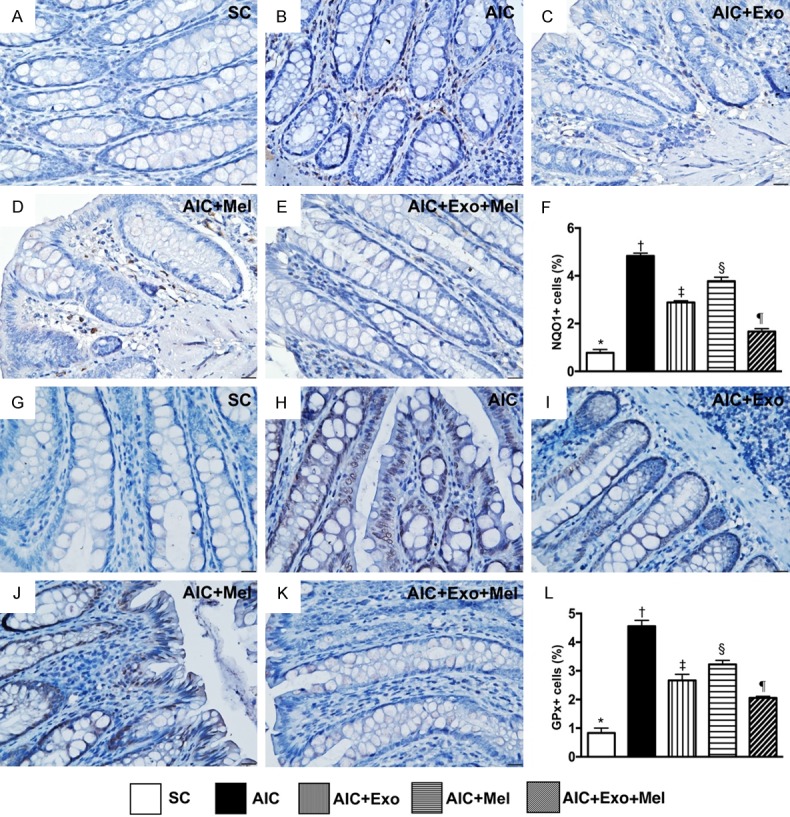
Cellular expressions of antioxidants in colon by day 14 after AIC induction. A-E. Showing immunohistochemical (IHC) microscopic finding (400 ×) for identification of positively-stained NAD(P)H quinone dehydrogenase (NQO) 1 cells (gray color). F. Analytical result of number of NQO1+ cells, * vs. other groups with different symbols (†, ‡, §, ¶), P<0.0001. G-K. Showing IHC microscopic finding (400 ×) for identification of positively-stained glutathione peroxidase (GPx) cells. L. Analytical result of number of GPx+ cells, * vs. other groups with different symbols (†, ‡, §, ¶), P<0.0001. Scale bars in right lower corner represent 20 µm. All statistical analyses were performed by one-way ANOVA, followed by Bonferroni multiple comparison post hoc test (n = 6 for each group). Symbols (*, †, ‡, §, ¶) indicate significance at the 0.05 level. SC = sham control; AIC = acute inflammatory colitis; Mel = melatonin; Exo = exosome.
Effects of Mel and exosome treatment on colonic immune cell infiltration following DSS-induced AIC
We next used IHC to measure the expression of CD3 and CD4, two indicators of immune cells in the colons of our rat models of AIC 14 days after induction of AIC. We found that CD3 and CD4 expression was highest in rats with untreated AIC, lowest in SC rats, significantly higher in those treated with AIC-Mel than AIC-exosome and AIC-exosome-Mel, and significantly higher in those treated with AIC-exosome than AIC-exosome-Mel (Figure 8).
Figure 8.
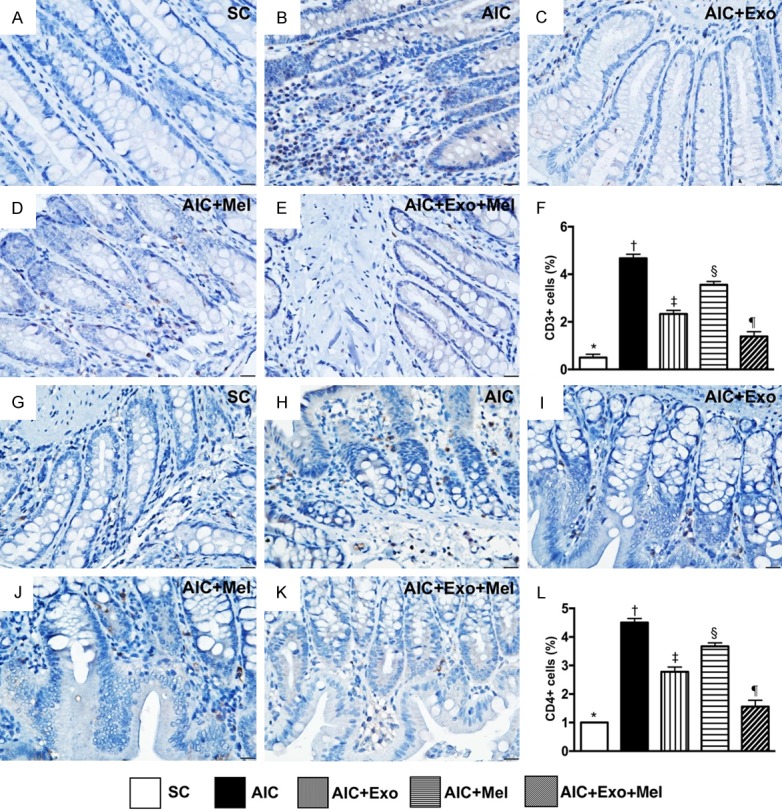
Expressions of immune cells in colon by day 14 after AIC induction. A-E. Showing immunohistochemical (IHC) microscopic finding (400 ×) for identification of positively-stained CD3 cells (gray color). F. Analytical result of number of CD3+ cells, * vs. other groups with different symbols (†, ‡, §, ¶), P<0.0001. G-K. Showing IHC microscopic finding (400 ×) for identification of positively-stained CD4 cells. L. Analytical result of number of CD4+ cells, * vs. other groups with different symbols (†, ‡, §, ¶), P<0.0001. Scale bars in right lower corner represent 20 µm. All statistical analyses were performed by one-way ANOVA, followed by Bonferroni multiple comparison post hoc test (n = 6 for each group). Symbols (*, †, ‡, §, ¶) indicate significance at the 0.05 level. SC = sham control; AIC = acute inflammatory colitis; Mel = melatonin; Exo = exosome.
Discussion
This study, which investigated the therapeutic impact of Mel-exosome in an experimental model of AIC, yielded striking preclinical information. First, when compared with SC rats, the levels of circulating inflammatory mediators were remarkably increased in animals with AIC. In contrast, these inflammatory biomarkers were remarkably reduced in animals with AIC following Mel or exosome therapy and further significantly reduced following combined Mel-exosome treatment. Additionally, colon permeability and injury score were notably higher in untreated animals with AIC than in controls; Mel or exosome treatment significantly improved colon permeability and injury score and combined Mel-exosome treatment had an even greater effect. Lastly, the inflammatory reaction and generation of oxidative stress were markedly suppressed by Mel or exosome treatment, not only in HT-29 cell culture, but also in the colons of rats with AIC, highlighting that these molecular-cellular perturbations could play a crucial role in the mechanistic signaling of AIC.
An association between increased circulating inflammatory cytokines and inflammatory bowel disease is well recognized [1,27]. One important finding in our study was that, compared with control group, circulating inflammatory cells (identified by flow cytometric analysis) and cytokines (identified by ELISA assessment) were substantially higher in untreated animals with AIC. Accordingly, our experimental results reinforced the findings of previous clinical studies [1,27]. Even more importantly, our findings further showed that these inflammatory mediators were substantially suppressed in animals with AIC who were treated with Mel or exosome therapy; an even greater effect was observed following combined Mel-exosome treatment.
To confirm whether our animal model of AIC was successfully induced, we not only assessed the fecal stool (bloody stool assessment), but also measured colon leakage/permeability (circulating FD4 fluorescein-dye intensity) as well as the colon injury score (pathological findings). Our results demonstrated that all of these parameters were remarkably increased in animals with untreated AIC compared with SC animals, suggesting that our experimental model of AIC was successful. Furthermore, we found that these parameters were remarkably reduced in animals with AIC following Mel or exosome treatment and were further remarkably reduced in animals with AIC animals following combined Mel-exosome treatment.
Surgical resection with or without anti-cytokine antibody therapy, like anti-TNF therapy, is commonly considered the last treatment resort for inflammatory bowel patients who are refractory to medical therapy or are in an emergency situation [28-30]. However, the long-term prognostic outcome of resection is unsatisfactory and unfavorable [30-32]. Accordingly, treatment of chronic inflammatory bowel disease remains a formidable challenge to clinicians [1,28-31], highlighting the urgent and paramount need to find an alternative safe and effective treatment modality.
Surprisingly, despite extensive research, the underlying etiology/mechanism of inflammatory bowel disease is currently not fully understood [1-5]. An essential finding in the present study was that inflammatory and oxidative stress biomarkers were notably increased in animals with AIC compared with control animals. Our findings may partially illustrate that the underlying mechanism of AIC could be multifactorial. Of importance was the fact that Mel and exosome therapy, and to a greater degree, combined Mel-exosome therapy, significantly reduced expression of these inflammatory and oxidative stress mediators in the colon. Furthermore, these therapies also resulted in significant upregulation of anti-inflammatory cytokines like IL-10, and downregulation of antioxidants like HO-1 and NQO1, in the colon. Our findings highlight that Mel-exosome treatment may be an alternative treatment option for inflammatory bowel disease patients who are refractory to medications and are not candidates for surgical intervention.
A principal finding in the present study was that the fibrotic, apoptotic, and DNA-damage biomarkers were significantly enhanced in animals with AIC animals compared with SC animals. However, these molecular-cellular perturbations were remarkably attenuated in animals with AIC following Mel or exosome therapy, and further attenuated in animals with AIC treated with combined Mel-exosome therapy. Interestingly, our previous studies have shown that Mel [32,33] and exosome treatment [34-36] effectively inhibit expression of fibrotic, apoptotic, and DNA-damage biomarkers in ischemic injured organs. In this way, in addition to being consistent with our previous studies [32-36], our present findings could, at least in part, explain why colon function and tissue were preserved by Mel-exosome therapy.
Study limitations
This study has limitations. First, the study period was only 14 days; therefore, the impact of Mel-exosome therapy on the long-term outcome of AIC was out of the scope. Second, despite extensive characterization in the present study, the underlying protective mechanism of Mel-exosome therapy on AIC is still not fully understood. Third, the optimal dosages of Mel and exosome were not tested. Therefore, whether the therapeutic effect of exosome treatment was superior to Mel or vice versa remains uncertain.
In conclusion, combined Mel-exosome therapy is superior to either one alone for protecting the rat colon from AIC injury.
Acknowledgements
This study was supported by a program grant from Chang Gung Memorial Hospital, Chang Gung University (Grant number: CMRPG8F0691).
Disclosure of conflict of interest
None.
References
- 1.Lukas M, Bortlik M, Maratka Z. What is the origin of ulcerative colitis? Still more questions than answers. Postgrad Med J. 2006;82:620–625. doi: 10.1136/pmj.2006.047035. [DOI] [PMC free article] [PubMed] [Google Scholar]
- 2.Vermeire S. Review article: genetic susceptibility and application of genetic testing in clinical management of inflammatory bowel disease. Aliment Pharmacol Ther. 2006;24(Suppl 3):2–10. doi: 10.1111/j.1365-2036.2006.03052.x. [DOI] [PubMed] [Google Scholar]
- 3.Shih DQ, Targan SR. Immunopathogenesis of inflammatory bowel disease. World J Gastroenterol. 2008;14:390–400. doi: 10.3748/wjg.14.390. [DOI] [PMC free article] [PubMed] [Google Scholar]
- 4.Brain O, Travis SP. Therapy of ulcerative colitis: state of the art. Curr Opin Gastroenterol. 2008;24:469–474. doi: 10.1097/MOG.0b013e3282ff0dd5. [DOI] [PubMed] [Google Scholar]
- 5.Van Assche G, Vermeire S, Rutgeerts P. Treatment of severe steroid refractory ulcerative colitis. World J Gastroenterol. 2008;14:5508–5511. doi: 10.3748/wjg.14.5508. [DOI] [PMC free article] [PubMed] [Google Scholar]
- 6.Chen HH, Lin KC, Wallace CG, Chen YT, Yang CC, Leu S, Chen YC, Sun CK, Tsai TH, Chen YL, Chung SY, Chang CL, Yip HK. Additional benefit of combined therapy with melatonin and apoptotic adipose-derived mesenchymal stem cell against sepsis-induced kidney injury. J Pineal Res. 2014;57:16–32. doi: 10.1111/jpi.12140. [DOI] [PubMed] [Google Scholar]
- 7.Yip HK, Chang YC, Wallace CG, Chang LT, Tsai TH, Chen YL, Chang HW, Leu S, Zhen YY, Tsai CY, Yeh KH, Sun CK, Yen CH. Melatonin treatment improves adipose-derived mesenchymal stem cell therapy for acute lung ischemia-reperfusion injury. J Pineal Res. 2013;54:207–221. doi: 10.1111/jpi.12020. [DOI] [PubMed] [Google Scholar]
- 8.Rossol-Allison J, Ward CJ. Exosomes to the rescue. J Am Soc Nephrol. 2015;26:2303–2304. doi: 10.1681/ASN.2015030254. [DOI] [PMC free article] [PubMed] [Google Scholar]
- 9.Akyurekli C, Le Y, Richardson RB, Fergusson D, Tay J, Allan DS. A systematic review of preclinical studies on the therapeutic potential of mesenchymal stromal cell-derived microvesicles. Stem Cell Rev. 2015;11:150–160. doi: 10.1007/s12015-014-9545-9. [DOI] [PubMed] [Google Scholar]
- 10.Burger D, Vinas JL, Akbari S, Dehak H, Knoll W, Gutsol A, Carter A, Touyz RM, Allan DS, Burns KD. Human endothelial colony-forming cells protect against acute kidney injury: role of exosomes. Am J Pathol. 2015;185:2309–2323. doi: 10.1016/j.ajpath.2015.04.010. [DOI] [PubMed] [Google Scholar]
- 11.Chen HH, Lai PF, Lan YF, Cheng CF, Zhong WB, Lin YF, Chen TW, Lin H. Exosomal ATF3 RNA attenuates pro-inflammatory gene MCP-1 transcription in renal ischemia-reperfusion. J Cell Physiol. 2014;229:1202–1211. doi: 10.1002/jcp.24554. [DOI] [PubMed] [Google Scholar]
- 12.Zhou Y, Xu H, Xu W, Wang B, Wu H, Tao Y, Zhang B, Wang M, Mao F, Yan Y, Gao S, Gu H, Zhu W, Qian H. Exosomes released by human umbilical cord mesenchymal stem cells protect against cisplatin-induced renal oxidative stress and apoptosis in vivo and in vitro. Stem Cell Res Ther. 2013;4:34. doi: 10.1186/scrt194. [DOI] [PMC free article] [PubMed] [Google Scholar]
- 13.Zou X, Zhang G, Cheng Z, Yin D, Du T, Ju G, Miao S, Liu G, Lu M, Zhu Y. Microvesicles derived from human Wharton’s Jelly mesenchymal stromal cells ameliorate renal ischemia-reperfusion injury in rats by suppressing CX3CL1. Stem Cell Res Ther. 2014;5:40. doi: 10.1186/scrt428. [DOI] [PMC free article] [PubMed] [Google Scholar]
- 14.Fleig SV, Humphreys BD. Rationale of mesenchymal stem cell therapy in kidney injury. Nephron Clin Pract. 2014;127:75–80. doi: 10.1159/000363680. [DOI] [PubMed] [Google Scholar]
- 15.Reiter RJ, Acuna-Castroviejo D, Tan DX, Burkhardt S. Free radical-mediated molecular damage. Mechanisms for the protective actions of melatonin in the central nervous system. Ann N Y Acad Sci. 2001;939:200–215. [PubMed] [Google Scholar]
- 16.Reiter RJ, Calvo JR, Karbownik M, Qi W, Tan DX. Melatonin and its relation to the immune system and inflammation. Ann N Y Acad Sci. 2000;917:376–386. doi: 10.1111/j.1749-6632.2000.tb05402.x. [DOI] [PubMed] [Google Scholar]
- 17.Reiter RJ, Tan DX, Cabrera J, D’Arpa D, Sainz RM, Mayo JC, Ramos S. The oxidant/antioxidant network: role of melatonin. Biol Signals Recept. 1999;8:56–63. doi: 10.1159/000014569. [DOI] [PubMed] [Google Scholar]
- 18.Reiter RJ, Tan DX, Manchester LC, Lopez-Burillo S, Sainz RM, Mayo JC. Melatonin: detoxification of oxygen and nitrogen-based toxic reactants. Adv Exp Med Biol. 2003;527:539–548. doi: 10.1007/978-1-4615-0135-0_62. [DOI] [PubMed] [Google Scholar]
- 19.Reiter RJ, Tan DX, Osuna C, Gitto E. Actions of melatonin in the reduction of oxidative stress. A review. J Biomed Sci. 2000;7:444–458. doi: 10.1007/BF02253360. [DOI] [PubMed] [Google Scholar]
- 20.Esposito E, Cuzzocrea S. Antiinflammatory activity of melatonin in central nervous system. Curr Neuropharmacol. 2010;8:228–242. doi: 10.2174/157015910792246155. [DOI] [PMC free article] [PubMed] [Google Scholar]
- 21.Mauriz JL, Collado PS, Veneroso C, Reiter RJ, Gonzalez-Gallego J. A review of the molecular aspects of melatonin’s anti-inflammatory actions: recent insights and new perspectives. J Pineal Res. 2013;54:1–14. doi: 10.1111/j.1600-079X.2012.01014.x. [DOI] [PubMed] [Google Scholar]
- 22.Chassaing B, Aitken JD, Malleshappa M, Vijay-Kumar M. Dextran sulfate sodium (DSS)-induced colitis in mice. Curr Protoc Immunol. 2014;104 doi: 10.1002/0471142735.im1525s104. Unit 15.25. [DOI] [PMC free article] [PubMed] [Google Scholar]
- 23.Randhawa PK, Singh K, Singh N, Jaggi AS. A review on chemical-induced inflammatory bowel disease models in rodents. Korean J Physiol Pharmacol. 2014;18:279–288. doi: 10.4196/kjpp.2014.18.4.279. [DOI] [PMC free article] [PubMed] [Google Scholar]
- 24.Ko SF, Yip HK, Zhen YY, Lee CC, Lee CC, Huang CC, Ng SH, Lin JW. Adipose-derived mesenchymal stem cell exosomes suppress hepatocellular carcinoma growth in a rat model: apparent diffusion coefficient, natural killer T-cell responses, and histopathological features. Stem Cells Int. 2015;2015:853506. doi: 10.1155/2015/853506. [DOI] [PMC free article] [PubMed] [Google Scholar]
- 25.Chang CL, Sung PH, Sun CK, Chen CH, Chiang HJ, Huang TH, Chen YL, Zhen YY, Chai HT, Chung SY, Tong MS, Chang HW, Chen HH, Yip HK. Protective effect of melatonin-supported adipose-derived mesenchymal stem cells against small bowel ischemia-reperfusion injury in rat. J Pineal Res. 2015;59:206–220. doi: 10.1111/jpi.12251. [DOI] [PubMed] [Google Scholar]
- 26.Huang CY, Hsiao JK, Lu YZ, Lee TC, Yu LC. Anti-apoptotic PI3K/Akt signaling by sodium/glucose transporter 1 reduces epithelial barrier damage and bacterial translocation in intestinal ischemia. Lab Invest. 2011;91:294–309. doi: 10.1038/labinvest.2010.177. [DOI] [PubMed] [Google Scholar]
- 27.Sartor RB. Current concepts of the etiology and pathogenesis of ulcerative colitis and Crohn’s disease. Gastroenterol Clin North Am. 1995;24:475–507. [PubMed] [Google Scholar]
- 28.Billioud V, Ford AC, Tedesco ED, Colombel JF, Roblin X, Peyrin-Biroulet L. Preoperative use of anti-TNF therapy and postoperative complications in inflammatory bowel diseases: a meta-analysis. J Crohns Colitis. 2013;7:853–867. doi: 10.1016/j.crohns.2013.01.014. [DOI] [PubMed] [Google Scholar]
- 29.Singh S, Al-Darmaki A, Frolkis AD, Seow CH, Leung Y, Novak KL, Ghosh S, Eksteen B, Panaccione R, Kaplan GG. Postoperative mortality among patients with inflammatory bowel diseases: a systematic review and meta-analysis of population-based studies. Gastroenterology. 2015;149:928–937. doi: 10.1053/j.gastro.2015.06.001. [DOI] [PubMed] [Google Scholar]
- 30.Justiniano CF, Aquina CT, Becerra AZ, Xu Z, Boodry CI, Swanger AA, Monson JRT, Fleming FJ. Postoperative mortality after nonelective surgery for inflammatory bowel disease patients in the era of biologics. Ann Surg. 2019;269:686–691. doi: 10.1097/SLA.0000000000002628. [DOI] [PubMed] [Google Scholar]
- 31.Debruyn JC, Soon IS, Hubbard J, Wrobel I, Panaccione R, Kaplan GG. Nationwide temporal trends in incidence of hospitalization and surgical intestinal resection in pediatric inflammatory bowel diseases in the United States from 1997 to 2009. Inflamm Bowel Dis. 2013;19:2423–2432. doi: 10.1097/MIB.0b013e3182a56148. [DOI] [PubMed] [Google Scholar]
- 32.Yip HK, Yang CC, Chen KH, Huang TH, Chen YL, Zhen YY, Sung PH, Chiang HJ, Sheu JJ, Chang CL, Chen CH, Chang HW, Chen YT. Combined melatonin and exendin-4 therapy preserves renal ultrastructural integrity after ischemia-reperfusion injury in the male rat. J Pineal Res. 2015;59:434–447. doi: 10.1111/jpi.12273. [DOI] [PubMed] [Google Scholar]
- 33.Sun CK, Lee FY, Kao YH, Chiang HJ, Sung PH, Tsai TH, Lin YC, Leu S, Wu YC, Lu HI, Chen YL, Chung SY, Su HL, Yip HK. Systemic combined melatonin-mitochondria treatment improves acute respiratory distress syndrome in the rat. J Pineal Res. 2015;58:137–150. doi: 10.1111/jpi.12199. [DOI] [PubMed] [Google Scholar]
- 34.Lin KC, Yip HK, Shao PL, Wu SC, Chen KH, Chen YT, Yang CC, Sun CK, Kao GS, Chen SY, Chai HT, Chang CL, Chen CH, Lee MS. Combination of adipose-derived mesenchymal stem cells (ADMSC) and ADMSC-derived exosomes for protecting kidney from acute ischemia-reperfusion injury. Int J Cardiol. 2016;216:173–185. doi: 10.1016/j.ijcard.2016.04.061. [DOI] [PubMed] [Google Scholar]
- 35.Chen KH, Chen CH, Wallace CG, Yuen CM, Kao GS, Chen YL, Shao PL, Chen YL, Chai HT, Lin KC, Liu CF, Chang HW, Lee MS, Yip HK. Intravenous administration of xenogenic adipose-derived mesenchymal stem cells (ADMSC) and ADMSC-derived exosomes markedly reduced brain infarct volume and preserved neurological function in rat after acute ischemic stroke. Oncotarget. 2016;7:74537–74556. doi: 10.18632/oncotarget.12902. [DOI] [PMC free article] [PubMed] [Google Scholar]
- 36.Sun CK, Chen CH, Chang CL, Chiang HJ, Sung PH, Chen KH, Chen YL, Chen SY, Kao GS, Chang HW, Lee MS, Yip HK. Melatonin treatment enhances therapeutic effects of exosomes against acute liver ischemia-reperfusion injury. Am J Transl Res. 2017;9:1543–1560. [PMC free article] [PubMed] [Google Scholar]


