Abstract
Metabonomic screening of human urine samples using 1H NMR spectroscopy has revealed the presence of signals resulting from the excretion of ethyl glucoside. Experiments in volunteers have demonstrated that this ethyl glucoside results from dietary exposure to the compound, which is present in beverages such as rice wine and sake, rather than representing a new route for the metabolism of ethanol by humans. The limited studies undertaken in volunteers indicate that ethyl glucoside has a longer biological half life than ethanol itself. The potential problems associated with using this glucoside metabolite as a marker of ethanol consumption are considered.
Introduction
1H NMR-based metabonomics has considerable potential as a means of rapidly providing metabolic fingerprints of individuals,1–3 and these contain information pertaining to both genotype (e.g. inborn errors of metabolism) or to “environmental” factors such as diet or diurnal variation.4,5 This ability to obtain a biochemical fingerprint of a biofluid or tissue sample, encoding the multifactorial heritable and environmentally influenced metabolic characteristics of an organism (the ‘metabotype’6), has proved invaluable for assessing the presence of disease7 and may in the future provide a means of identifying risk factors predicting the potential for disease. During the 1H NMR spectroscopic analysis of urine samples obtained from a large number of healthy male and female American, Chinese and Japanese volunteers, as part of a multi-population study on the influence of nutrition on blood pressure (INTERMAP),8 we have detected, in addition to ethanol itself, what appeared to be several ethanol-related components in the samples. The most prominent of these ethanol-like resonances were associated with an anomeric proton in the spectrum at δ 4.93 indicative of an ethanol conjugate of some sort. Initially we made the working assumption that this substance was the known ethanol metabolite, ethyl glucuronide, which has been recognised as a minor metabolite of ethanol for over 50 years9 having been first identified by Neubauer in 1901.10 Indeed more recent data suggest that ca. 0.04% of a dose of ethanol (25 g) are excreted as ethyl glucuronide in the urine of healthy volunteers.11 Ethyl glucuronide has a longer elimination half life than ethanol and its presence in urine and plasma12 and also, latterly, in human hair, has been used as a marker of alcohol consumption.13,14
Careful examination of the signals in the 1H NMR spectra of the urine samples obtained in the current study suggested that in fact the ethanol-related resonances more closely approximated to a glucoside rather than a glucuronide. Glucosides, are commonly found as secondary metabolites in plants and also provide a route of xenobiotic metabolism in arthropods. However, whilst not unknown as mammalian metabolites they are unusual and, despite extensive research into the metabolic fate of ethanol over many years glucosidation in humans has not been described. We also noted that there was a distinct geographical distribution of the ethyl glucoside resonances, with a predominance of examples from the Chinese and Japanese subjects (Teague et al., in preparation). Given that ethyl glucoside is a known component of rice wine (extensively used in cooking) and the alcoholic beverage sake,15,16 it seemed probable that the ethyl glucoside detected in urine of these subjects was a result of dietary exposure rather than a novel and hitherto unsuspected route of ethanol metabolism in man. We therefore have undertaken a limited number of preliminary experiments to test this hypothesis in western volunteers previously unexposed to rice wine and sake.
Methods
Sample collection
Following two days abstinence from the consumption of alcoholic beverages a healthy Caucasian male volunteer consumed 100 ml of sake (Takara Sake, Japan). Similarly, a healthy Caucasian female volunteer consumed 50 ml of rice wine (Shao xing Hua-Diao, Zhejiang, China). Apart from avoiding alcohol for the days preceding the study there were no other restrictions and the volunteers continued to partake of their normal diet and exercise regime etc.
Urine samples were collected at pre-dose and as voided over the subsequent 28 h (20 h for rice wine) period. Samples were then stored frozen at −40 °C prior to 1H NMR spectroscopic analysis.
Preparation of samples for 1H NMR spectroscopy
Urine samples for NMR spectroscopy were made up from 500 μL of urine, 250 μL of buffer solution (0.2 M Na2HPO4/0.2 M NaH2PO4, pH 7.4) and 75 μL of a solution of sodium 3-trimethylsilyl-(2,2,3,3–2H4)-1-proprionate (TSP) in D2O (final concentration 0.1 mg mL–1). Samples were mixed in a 96 deep well plate and left to stand for 10 min before centrifuging at 8,000 rpm for 5 min to remove any precipitate from the solution. The D2O/TSP provided both a deuterium lock signal for the NMR spectrometer and a chemical shift reference (δ 0.0).
Samples of sake and rice wine were lyophilised and reconstituted in buffer solution (0.2 M Na2HPO4/0.2 M NaH2PO4, pH 7.4).
NMR spectroscopic analysis of urine samples
One-dimensional 1H NMR spectra of urine were acquired at 600.22 MHz on a Bruker DRX-600 spectrometer using a standard 1D pulse sequence as described by Jeener et al.,17 using the first increment of a noesy sequence to achieve saturation of the water resonance. Sixty-four free induction decays (FIDs) were collected into 32k data points using a spectral width of 6009 Hz, an acquisition time of 2.73 s, and a total pulse recycle time of 4.73 s. The FIDs were multiplied by an exponential weighting function corresponding to a line broadening of 0.3 Hz prior to Fourier transformation (FT). Two-dimensional NMR spectra were acquired for isolated ethyl glucoside to aid assignment. A 1H–1H COSY NMR spectrum was measured using a standard COSY-90 sequence with gradient selection. The 90° pulse length was 9.5 μs and 2048 data points were collected with 48 transients, an acquisition time of 0.16 s and a relaxation delay of 2 s. A total of 128 increments were collected for the evolution. 1H–1H TOCSY NMR spectra were recorded using the DIPSI-2 spin-lock scheme as defined by Shaka et al.,18 with TPPI phase incrementation. For each increment 48 transients were collected into 2k data points for 128 increments with a spectral width of 6313 Hz. The mixing time was 80 ms and the spin-lock power was adjusted to be equivalent to 5 kHz. The data were zero-filled to 2k for both dimensions and a shifted sine-bell adopisation function was applied to the FID, in both dimensions, prior to FT. 1H–13C HMBC NMR spectra were acquired using the gradient selected sequence,19 408 transients per increment for 128 incrnments were collected into 2k data points. A spectral width of 6313 Hz in the 1H dimension and 33206 Hz in the 13C dimension were used with a relaxation delay of 2 s and an acquisition time of 0.16 s. The data were zero filled by a factor of 2 and a sine-bell squared adopisation function was applied to the FID, in both dimensions, prior to FT.
NMR spectroscopic analysis of sake and rice wine
Spectra were acquired for samples of sake and rice wine using the standard 1-D pulse sequence described for urine samples.
Solid phase extraction chromatography (SPEC) of whole urine
Urine samples (2 mL) were acidified to pH 2 with 1 M HCl and extracted on to a C18 bonded cartridge (Isolute, 200 mg, supplied by International Sorbent Technology Ltd, Hengoed, UK). The cartridges had previously been activated by washing with methanol (4 mL) and acidified water (6 mL, pH 2). The fractions were eluted with acidified water and methanol in the ratios, 5:0, 4:1, 3:2, 2:3, 1:4 and 0:5. All samples were dried and reconstituted in D2O prior to NMR spectroscopic analysis.
Directly coupled HPLC-NMR and MS spectroscopic analysis of SPE urine
The HPLC system comprised a Hewlett-Packard 1100 Series pump, a Bruker DAD detector (operating over the range 200–500 nm), a Bruker BNMI unit and a Bruker BPSU unit with a cassette of 36 sample loops. 95% of the output of HPLC was stored in the sample loops and 5% was injected into an EsquireLC Ion Trap mass spectrometer where it was monitored by electospray ionisation mass spectroscopy (ESI-MS) in the positive ion mode with ions up to m/z 500. The stored samples (in loops) were then transferred into a 4 mm LC-NMR probe equipped with Z-gradient via an inert polyether(ether) ketone capillary. The chromatography was controlled using the Bruker LC-NMR-MS controller with Hystar (NT2.2) software. Analysis was performed on a 5 mm Hypersil®BDS C18 reverse phase column (4.6 × 150 mm id). The mobile phase consisted of deuterated ammonium formate (25 mM, pH 3) in D2O plus acetonitrile, at 98:2 respectively. The flow rate was 0.5 mL min−1.
LC-NMR spectra were acquired on a Bruker DRX600 spectrometer at 300 K for each collected peak at 600.22 MHz using a standard 1D pulse sequence with water presaturation (90°−t1−90°−tm−90°−aq). The t1 was 3 μs and tm, the mixing time, was 150 ms. Long irradiation pulses were placed on top of the deuterated water signal (HOD) and acetonitrile peaks, respectively, to saturate the solvents signals during the recycle delay of 2.3 s and the mixing time. 1024 FIDs were collected into 32k data points using a spectral width of 12 kHz, an acquisition time of 1.36 s, and a total pulse recycle time of 3.66 s. The FIDs were multiplied by an exponential window function corresponding to a line broadening of 0.3 Hz prior to FT.
Results and discussion
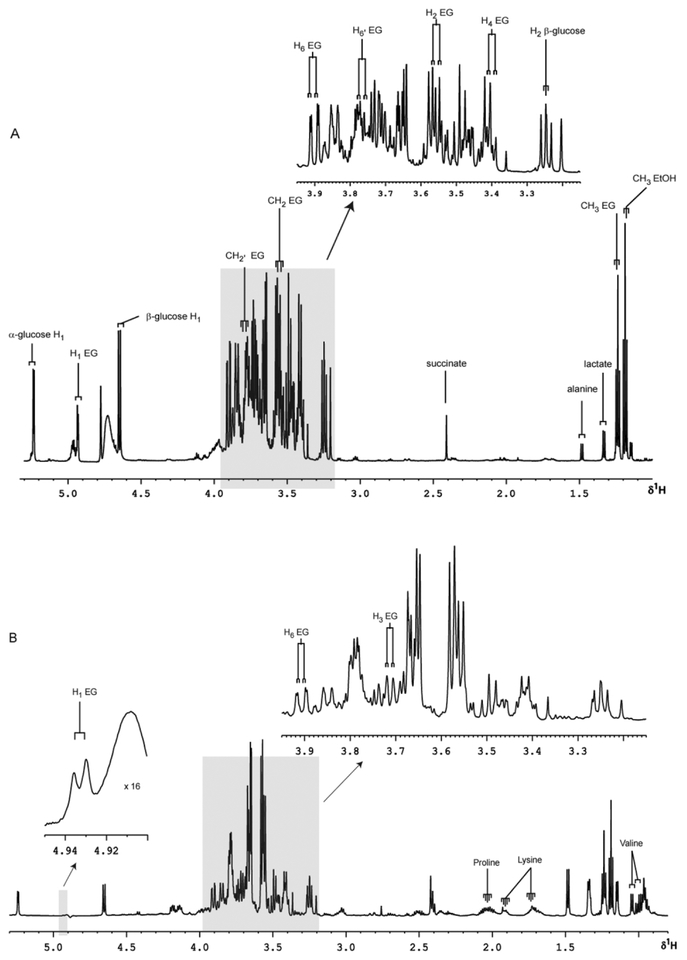
1H NMR spectra of rice wine and sake consumed in this study clearly show prominent resonances for ethanol and α-ethyl glucoside. Typical spectra of the sake and rice wine consumed in this study are shown in Fig. 1a and b (freeze dried and reconstituted).
Fig. 1.
Partial 600 MHz 1H NMR spectra with expanded regions of freeze-dried sake and Chinese rice wine. (A) sake, (B) rice wine. EG = ethyl glucoside; EtOH = ethanol.
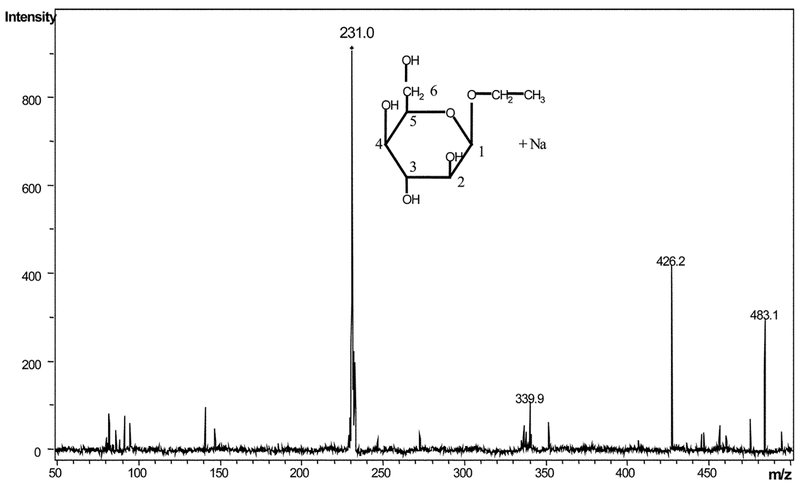
Sake and rice wine themselves contain large amounts of alcohol, which obscure the rest of the spectra, making identification of other molecules difficult. The ratios of glucoside to alcohol in sake and rice wine are approximately 1:75 and 1:175 respectively. After the removal of the ethanol by lyophilisation, a number of resonances assigned to known molecules were observed clearly in both beverages, including α and β-glucose (H1 d δ.2 and 4.65 respectively), alanine (δ 1.48), lactate (δ 1.33), succinate (δ 2.41) and a number of amino acids. Large amounts of ethyl glucoside were observed in both spectra, as identified by the CH3 triplet at δ1.24. The anomeric proton from ethyl glucoside is seen at δ 4.93. Further assignments were made from 1H–1H COSY-90, 1H–1H TOCSY and 1H–13C HMBC NMR spectra (data not shown), of isolated ethyl glucoside from the fourth HPLC-NMR peak (r.t. =6.06 min) from the SPEC acid wash of human urine (Table 1). The identity of ethyl glucoside in this fraction was confirmed by ESI-MS, where an ion m/z 231 corresponding to [M + Na]+, was observed (Fig. 2).
Table 1.
List of ethyl glucoside resonances observed in 600 MHz 1H and 1H–13C NMR spectra of isolated ethyl glucoside from HPLC-NMR of SPEC acid wash of human urine, with associated chemical shift and multiplicity data (pH 7)
| 1H shift (δ) | Multiplicityab | Assignment | 13C sliift (d)c |
|---|---|---|---|
| 1.24 | t | CH3 | 17.1 (CH3) |
| 3.41 | dd | H4 | 72.5 (C-4) |
| 3.55 | dd | H2 | 66.9 (C-2) |
| 3.57 | q | H(CH2) | 66.8 (CH2) |
| 3.69 | m | H5 | 74.7 (C-5) |
| 3.71 | dd | H3 | 76.1 (C-3) |
| 3.77 | dd | H6’ | |
| 3.80 | q | H’(CH2) | |
| 3.86 | dd | H6 | 63.6 (C-6) |
| 4.93 | d | H1 | 100.7 (C-l) |
d = doublet; t = triplet; q = quartet; m = multiplet; dd = doublet of doublets.
Some of these assignments were based on 1H–1H COSY and TOCSY NMR.
Assignments were based on 1H–13C HMBC spectrum.
Fig. 2.
ESI-MS spectrum of the ethyl glucoside sodium adduct isolated in the forth HPLC-NMR peak (r.t. = 6.06 min) from the SPEC acid wash of human urine.
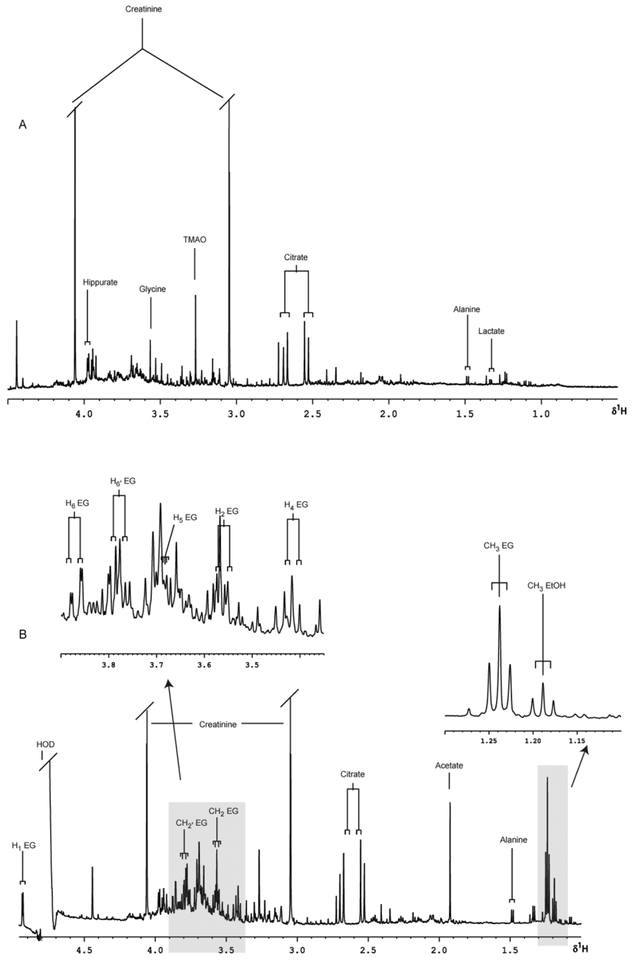
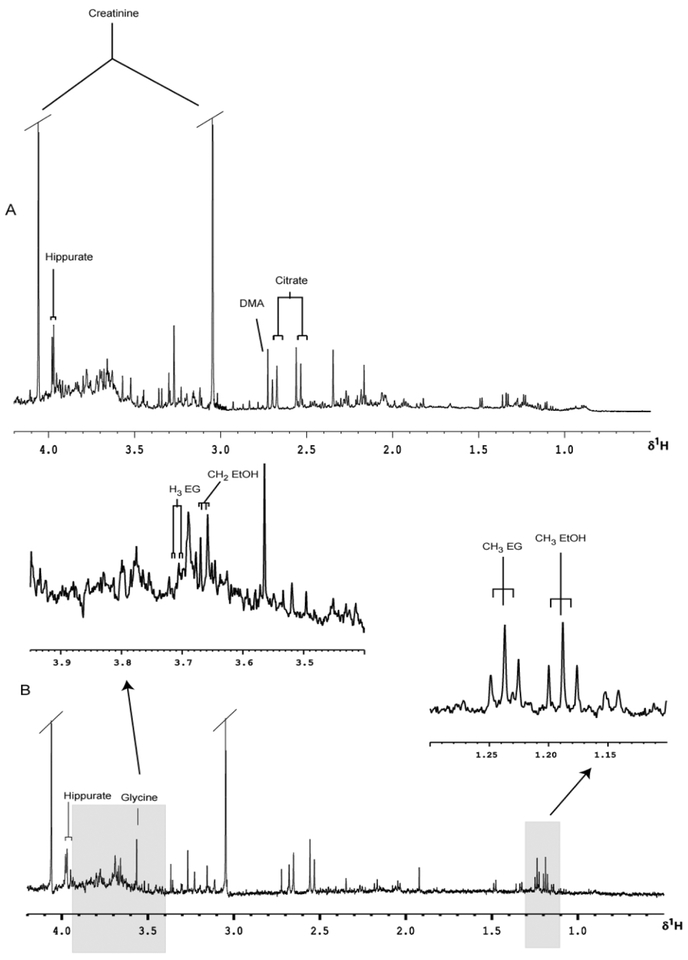
Typical predose 1H NMR spectra of urine, with the major peaks assigned, are shown for a male volunteer prior to the consumption of 100 ml of sake (Fig. 3a) and a female volunteer prior to the administration of 50 ml of rice wine (Fig. 4a). Whilst these spectra show a wealth of low molecular mass analytes no ethanol or ethanol-related signals are detectable in the predose samples obtained from either subject. However, following dosing of either sake or rice wine, signals for ethanol and ethyl glucoside were rapidly detected in the urine of both subjects (Figs. 3b and 4b). Subsequent experiments in volunteers administered alcoholic beverages shown by the same analytical methods not to contain ethyl glucoside, as determined using 1H NMR spectroscopy, did not reveal detectable quantities of this component in urine (data not shown). It therefore seems clear from these preliminary experiments that dietary ethyl glucoside is sufficiently metabolically stable in man to survive the various processes involved in absorption and distribution within the body prior to elimination of the compound via the urine.
Fig. 3.
Partial 600 MHz 1H NMR spectra of urine with expanded regions, (A) pre- and (B) 0–3 h post ingestion of 100 mL of sake.
Fig. 4.
Partial 600 MHz 1H NMR spectra of urine with expanded regions, (A) pre- and (B) 0–3 h post 50 mL ingestion of rice wine. Abbreviations; TMAO = trimethylamine-N-oxide; DMA = dimethylamine.
Analysis of urine samples taken over a period of 0–28 h (0–20 h for rice wine) indicated that concentrations of ethanol in urine declined more rapidly than ethyl glucoside which was still detectable up to 28 h after ingestion of either sake (28 h) or rice wine (20 h) in these subjects. An initial conclusion that might be drawn from such data is that ethyl glucoside, like ethyl glucuronide, might also be used to provide a marker of ethanol intake, with the advantage that it remains detectable in urine (and presumably plasma) some time after all of the ethanol has been eliminated. However, as alluded to above, rice wine is used in cooking and therefore exposure to ethyl glucoside is quite likely as a result of the consumption of essentially non-alcohol containing food. The potential for using ethyl glucoside as a marker for ethanol intake is therefore likely to prove to be impractical as a result.
Little has appeared in the literature concerning the pharmacological or toxicological effects of ethyl glucoside. Kitamura reported that a-ethylglucoside enhanced the differentiation of murine keratinocytes, which may be related to reduced barrier disruption by UV.15 Clearly, based on the fact that there has been widespread exposure of this material in humans, the toxicity of the compound cannot be particularly high. However, it is interesting to speculate how a molecule such as this might interact with the enzyme systems responsible for a range of endogenous metabolic processes involving either the metabolism of alcohol or of glucose. Certainly an investigation of some of these aspects, including a more quantitative study of the distribution and metabolic fate of ethyl glucoside, seems warranted.
In conclusion, analysis of human urine by 1H NMR has revealed the unexpected presence of ethyl glucoside. On the basis of preliminary studies in volunteers it has been established that this is likely to be due to the consumption of typical far eastern alcoholcontaining products and that the half life of ethyl glucoside greatly exceeds that of alcohol.
Acknowledgemens
We are grateful to Professor J. Staimler (North Western University) for constructive discussions. We also thank the INTERMAP consortium for financial support (E. Maibaum). The INTERMAP study was supported by Grant 2-RO1-HL50490 from the US National Heart, Lung, and Blood Institute, National Institutes of Health, Bethesda, Maryland; and by national agencies in China, Japan (the Ministry of Education, Science, Sports, and Culture, Grant-in-Aid for Scientific Research [A], No. 090357003), and the UK. Also we are grateful to Unilever for their continued financial support (C. Teague).
References
- 1.Holmes E, Foxall PJD, Nicholson JK, Neild GH, Brown SM, Beddell CR, Sweatman BC, Rahr E, Lindon JC, Spraul M and Neidig P, Anal. Biochem, 1994, 220, 284–296. [DOI] [PubMed] [Google Scholar]
- 2.Lindon JC, Nicholson JK and Everett JR, Annu. Rep. NMR Spectrosc, 1999, 38, 1–88. [Google Scholar]
- 3.Nicholson JK, Lindon JC and Holmes E, Xenobiotica, 1999, 29(11), 1181–1189. [DOI] [PubMed] [Google Scholar]
- 4.Holmes E, Foxall PJD, Spraul M, Farrant RD, Nicholson JK and Lindon JC, J. Pharm. Biomed. Anal, 1997, 15, 1647–1659. [DOI] [PubMed] [Google Scholar]
- 5.Bollard ME, Holmes E, Lindon JC, Mitchell SC, Branstetter D, Zhang W and Nicholson JK, Anal. Biochem, 2001, 295(2), 194–202. [DOI] [PubMed] [Google Scholar]
- 6.Gavaghan CL, Holmes E, Lenz E, Wilson ID and Nicholson JK, FEBS Lett, 2000, 484(3), 169–74. [DOI] [PubMed] [Google Scholar]
- 7.Brindle JT, Antti H, Holmes E, Tranter GE, Nicholson JK, Bethell HW, Clarke S, Schofield PM, McKilligin E, Mosedale DE and Grainger DJ, Nat. Med, 2002, 8(12), 1439–1444. [DOI] [PubMed] [Google Scholar]
- 8.Stamler J, Elliott P, Dennis B, Dyer AR, Kesteloot H, Liu K, Ueshima H and Zhou B, J. Hum. Hypertens, 2003, 17, 591–608. [DOI] [PMC free article] [PubMed] [Google Scholar]
- 9.Kamil I, Smith J and Williams R, Biochem. J, 1952, 51, 32–33. [Google Scholar]
- 10.Neubauer O, Arch. Exp. Pathol. Pharmakol, 1901, 46, 133–152. [Google Scholar]
- 11.Goll M, Schmitt G, Ganssmann B and Aderjan R, J. Anal. Toxicol, 2002, 26(5), 262–266. [DOI] [PubMed] [Google Scholar]
- 12.Wurst F, Kempter C, Seidl S and Alt A, Alcohol Alcohol, 1999, 34(1), 71–77. [DOI] [PubMed] [Google Scholar]
- 13.Alt A, Janda I, Seidl S and Wurst F, Alcohol Alcohol, 2000, 35(3), 313–314. [DOI] [PubMed] [Google Scholar]
- 14.Janda I, Weinmann W, Kuehnle T, Lahode M and Alt A, Forensic Sci. Int, 2002, 128(1–2), 59–65. [DOI] [PubMed] [Google Scholar]
- 15.Kitamura N, Ota Y, Haratake A, Horikoshi T, Tanno O and Horikoshi T, Skin Pharmacol, 1997, 10(3), 153–159. [DOI] [PubMed] [Google Scholar]
- 16.Imamura T and Tamura Z, Agric. Biol. Chem, 1971, 35, 321–324. [Google Scholar]
- 17.Jeener J, Meier BH, Bachmann P and Ernst RR, J. Chem. Phys, 1979, 71, 4546–4563. [Google Scholar]
- 18.Shaka AJ, Lee CJ and Pines A, J. Magn. Reson, 1988, 77, 274–293. [Google Scholar]
- 19.Rinaldi P and Keifer P, J. Magn. Reson., Ser. A, 1994, 108, 259–262. [Google Scholar]


