

Abstract
BACKGROUND:
The epidemiology of pneumonia has likely evolved in recent years, reflecting an aging population, changes in population immunity, and socioeconomic disparities.
METHODS:
Using the National (Nationwide) Inpatient Sample, estimated numbers and rates of pneumonia-associated hospitalizations for 2001–2014 were calculated. A pneumonia-associated hospitalization was defined as one in which the discharge record listed a principal diagnosis of pneumonia or a secondary diagnosis of pneumonia if the principal diagnosis was respiratory failure or sepsis.
RESULTS:
There were an estimated 20,361,181 (SE, 95,601) pneumonia-associated hospitalizations in the United States during 2001–2014 (average annual age-adjusted pneumonia- associated hospitalization rate of 464.8 per 100,000 population [95% CI, 462.5–467.1]). The average annual age-adjusted pneumonia-associated hospitalization rate decreased over the study period (P < .0001). In-hospital death occurred in 7.4% (SE, 0.03) of pneumonia-associated hospitalizations. Non-Hispanic American Indian/Alaskan Natives and non- Hispanic blacks had the highest average annual age-adjusted rates of pneumonia-associated hospitalization of all race/ethnicities at 439.2 (95% CI, 415.9–462.5) and 438.6 (95% CI, 432.5–444.7) per 100,000 population, respectively. During 2001–2014, the proportion of pneumonia-associated hospitalizations colisting an immunocompromising condition increased from 18.7% (SE, 0.2) in 2001 to 29.9% (SE, 0.2) in 2014. Total charges for pneumonia-associated hospitalizations in 2014 were over $84 billion.
CONCLUSIONS:
Pneumonia is a major cause of morbidity and mortality in the United States. Differences in rates and outcomes of pneumonia-associated hospitalizations between sociodemographic groups warrant further investigation. The immunocompromised population has emerged as a group experiencing a disproportionate burden of pneumonia-associated hospitalizations.
Keywords: epidemiology, pneumonia, respiratory failure, sepsis
Together, pneumonia and influenza rank as the eighth leading cause of death in the United States.1 While a pathogen is not identified even after extensive diagnostic evaluation in the majority of cases, influenza virus is known to be an important contributor to pneumonia.2,3
Factors such as an aging population, changes in population immunity (such as through vaccination and immunosuppressive comorbidities), and persisting socioeconomic disparities might be contributing to a shift in the national burden of pneumonia.4,5 While pneumonia disproportionately affects older adults, the mortality rate from pneumonia among older adults is declining.6–9 Among children, the very young face the greatest burden of pneumonia, though the introduction of the pneumococcal vaccine (eg, the 7-valent pneumococcal conjugate vaccine [PCV7] in 2000) has had an impact.10–12 People who are immunocompromised are at increased risk of pneumonia, but the national burden of pneumonia- associated hospitalizations among the immunocompromised has not been fully characterized.13–18 Finally, disparities have been noted in pneumonia death rates by race/ethnicity.19
To characterize the national burden of pneumonia after the introduction of PCV7, we analyzed hospital discharge data for pneumonia during 2001–2014.
Materials and Methods
Data Source
We used the National (Nationwide) Inpatient Sample (NIS) to retrospectively analyze hospital discharge data with a diagnosis of pneumonia for the general US population during 2001–2014.20 The NIS is a nationally representative database of hospitalizations and is the largest all-payer inpatient database in the United States. The full NIS includes > 7 million unweighted hospitalizations per year. For each discharge record in the NIS, we pulled up to 15 diagnoses (principal diagnosis plus 14 secondary diagnoses) that were coded on the basis of the International Classification of Diseases, Ninth Revision, Clinical Modification (ICD-9-CM).
Study Approval
Use of the NIS specifically prohibits identification of individual patients. This investigation was determined by the Centers for Disease Control and Prevention and the New York City Department of Health and Mental Hygiene to be nonhuman subject research.
Definitions
We defined a pneumonia-associated hospitalization as a hospitalization with a principal diagnosis of pneumonia (ICD-9-CM code 480–486, 487.0, 488.01, 488.11, or 488.81), or a secondary diagnosis of pneumonia if the principal diagnosis was respiratory failure (ICD-9- CM code 518.81, 518.82, 518.84, or 799.1) or sepsis (ICD-9-CM code 038, 785.52, 995.91, or 995.92).7 Of note, ICD-9-CM codes 487.0, 488.01, 488.11, and 488.81 relate to “influenza with pneumonia”; we did not include other “influenza” ICD-9-CM codes within the 487 and 488 categories because they did not specify an associated “pneumonia.” Together, these four ICD-9-CM codes accounted for 1.1% (SE, 0.01) of all pneumonia-associated hospitalizations during the study period.
A pneumonia episode was considered to be of unspecified etiology if the discharge record contained a principal diagnosis of “bronchopneumonia, organism unspecified” or “pneumonia, organism unspecified” (ICD-9-CM codes 485 and 486, respectively); all other pneumonia-associated hospitalizations that listed a pneumonia diagnostic code as the principal diagnosis other than ICD-9-CM codes 485 or 486 were considered to have a specified etiology.
Pneumonia-associated hospitalizations of persons who were immunocompromised were identified if an ICD-9-CM code for an immunocompromising condition was colisted on the discharge record21 (e-Table 1).
Data Analysis
Estimates and standard errors of the number of pneumonia-associated hospitalizations were calculated from the NIS, using the Healthcare Cost and Utilization Project weighting methodology.20,22,23 The unit of analysis was a hospitalization; NIS data do not have person identifiers, and therefore any repeat pneumonia-associated hospitalizations of the same patient were included.
Average annual and annual hospitalization rates with 95% CIs were expressed as the weighted number of hospitalizations per 100,000 persons of the corresponding population. Age-adjusted rates with 95% CIs were calculated by the direct method, with the 2000 projected US population as the standard; crude weights were calculated for specific age groups and income quartiles. Denominators were taken from the National Center for Health Statistics annual bridged race population estimates for the study period.24 We used Poisson regression to calculate rate ratios and 95% CIs, and test for trends over time. A P value < .05 was considered statistically significant.
Pneumonia-associated hospitalization records were examined by sex, age, race/ethnicity, region, ZIP code income quartile, month of admission, in-hospital death, colisting of immunocompromising conditions, and charges (in 2014 US dollars). Hospital charges reflected the amount that the medical facility billed for the hospitalization, but did not include professional (physician) fees. Income quartiles by ZIP code are consistent for the years 20032014 and were used in this study. To examine trends, we compared average annual rates for 2001–2003 to 2012–2014. Some discharge records had missing information on sex (0.1% [SE, < 0.01]), age (0.03% [SE, < 0.01]), race/ethnicity (19.0% [SE, 0.4]), and charges (1.7% [SE, 0.1]); adjustments were not made for missing data.
All analyses were generated with SAS, version 9.3. Weighted estimates and corresponding SEs were calculated with SUDAAN to account for the NIS sampling design.
Results
During 2001–2014, there were 463,384,760 (SE, 2,162,304) hospitalizations in the United States, including 20,361,181 (SE, 95,601) pneumonia-associated hospitalizations (4.4% [SE, 0.01]) (Table 1). This corresponds to an average of 1,454,370 (SE, 6,829) pneumonia-associated hospitalizations per year or an average annual age-adjusted pneumonia-associated hospitalization rate of 464.8 per 100,000 population (95% CI, 462.5–467.1). During 2001–2014, the annual age-adjusted rate of pneumonia-associated hospitalizations decreased (P < .0001) (Fig 1).
TABLE 1 ].
Pneumonia-Associated Hospitalizations by Sex, Age Group, Race/Ethnicity, Region, and Income: United States, 2001–2014
| Characteristics | No. of Pneumonia-Associated Hospitalizations (SE) |
Average Annual Age-Adjusted Pneumonia-Associated Hospitalization Rate per 100,000 Population (95% CI)a |
Rate Ratio (95% CI) |
Percentage of Pneumonia- Associated Hospitalizations With in-Hospital Death (SE) |
Total No. of Hospitalizations for Any Cause (SE) |
Percentage of Total Hospitalizations for Any Cause That Were Pneumonia-Associated (SE) |
|---|---|---|---|---|---|---|
| Total | 20,361,181 (95,601) | 464.8 (462.5–467.1) | NA | 7.4 (0.03) | 463,384,760 (2,162,304) | 4.4 (0.01) |
| Sex | ||||||
| Male | 9,790,653 (46,203) | 512.5 (510.0–515.1) | 1.2 (1.2–1.2) | 7.8 (0.03) | 186,938,629 (928,295) | 5.2 (0.02) |
| Female | 10,550,300 (50,676) | 432.1 (430.0–434.3) | Reference | 7.1 (0.03) | 275,523,617 (1,316,296) | 3.8 (0.01) |
| Age group, y | ||||||
| < 1 | 488,712 (8,186) | 872.6 (844.0–901.3) | 11.1 (10.6–11.6) | 0.3 (0.02) | 7,680,876 (167,980) | 6.4 (0.1) |
| 1–4 | 933,630 (14,699) | 419.4 (406.4–432.3) | 5.3 (5.1–5.6) | 0.2 (0.01) | 6,939,908 (152,249) | 13.5 (0.2) |
| 5–19 | 688,216 (11,541) | 78.8 (76.2–81.4) | Reference | 0.7 (0.03) | 22,736,621 (290,644) | 3.0 (0.03) |
| 20–44 | 1,716,761 (10,764) | 117.4 (116.0–118.9) | 1.5 (1.4–1.5) | 2.9 (0.03) | 125,349,016 (768,145) | 1.4 (0.01) |
| 45–64 | 4,623,712 (24,591) | 432.3 (427.8–436.8) | 5.5 (5.3–5.7) | 5.9 (0.03) | 120,942,503 (655,416) | 3.8 (0.01) |
| 65–74 | 3,720,715 (19,383) | 1,268.0 (1,255.0–1,280.9) | 16.1 (15.5–16.6) | 7.9 (0.04) | 69,136,959 (373,526) | 5.4 (0.02) |
| 75–84 | 4,702,338 (25,625) | 2,566.3 (2,538.9–2,593.7) | 32.6 (31.4–33.7) | 9.7 (0.04) | 70,337,015 (403,148) | 6.7 (0.02) |
| ≥ 85 | 3,477,158 (19,590) | 4,820.6 (4,767.4–4,873.8) | 61.2 (59.0–63.3) | 12.4 (0.1) | 39,861,257 (234,155) | 8.7 (0.03) |
| Race/ethnicity | ||||||
| Non-Hispanic white | 12,085,487 (92,577) | 362.3 (359.7–364.8) | 1.6 (1.5–1.7) | 7.9 (0.03) | 256,399,001 (2,119,606) | 4.7 (0.02) |
| Non-Hispanic black | 1,999,268 (30,548) | 438.6 (432.5–444.7) | 1.9 (1.8–2.1) | 7.1 (0.1) | 53,689,041 (815,539) | 3.7 (0.02) |
| Hispanic | 1,515,369 (32,123) | 370.6 (362.8–378.5) | 1.6 (1.5–1.8) | 6.2 (0.1) | 43,277,116 (855,647) | 3.5 (0.03) |
| Non-Hispanic AI/AN | 114,426 (6,081) | 439.2 (415.9–462.5) | 1.9 (1.6–2.2) | 5.8 (0.2) | 2,233,117 (114,545) | 5.1 (0.1) |
| Non-Hispanic A/PI | 360,096 (10,393) | 230.1 (222.5–237.8) | Reference | 9.6 (0.2) | 8,862,428 (218,170) | 4.1 (0.1) |
| Non-Hispanic other | 415,654 (12,880) | NA | NA | 7.4 (0.1) | 11,647,646 (341,393) | 3.6 (0.1) |
| Region | ||||||
| Northeast | 3,608,110 (40,867) | 423.7 (418.7–428.6) | 1.1 (1.1–1.2) | 8.9 (0.1) | 91,272,669 (1,011,020) | 4.0 (0.03) |
| Midwest | 4,903,744 (43,160) | 495.5 (490.9–500.2) | 1.3 (1.2–1.3) | 6.3 (0.1) | 106,770,549 (927,325) | 4.6 (0.03) |
| South | 8,188,107 (65,995) | 515.7 (511.5–519.9) | 1.3 (1.3–1.4) | 7.2 (0.04) | 178,179,742 (1,480,548) | 4.6 (0.03) |
| West | 3,661,220 (35,375) | 384.6 (380.4–388.8) | Reference | 8.0 (0.1) | 87,161,800 (775,528) | 4.2 (0.03) |
| Income quartileb | ||||||
| 0–25th percentile | 5,574,810 (52,859) | 609.4 (598.0–620.7) | 1.8 (1.7–1.9) | 7.0 (0.04) | 113,831,029 (1,142,892) | 4.9 (0.03) |
| 26–50th percentile | 4,743,812 (43,929) | 518.5 (509.1–527.9) | 1.5 (1.5–1.6) | 7.2 (0.04) | 101,491,744 (870,978) | 4.7 (0.02) |
| 51–75th percentile | 3,877,074 (39,034) | 423.8 (415.4–432.2) | 1.3 (1.2–1.3) | 7.5 (0.1) | 91,975,009 (840,911) | 4.2 (0.02) |
| 76–100th percentile | 3,082,668 (48,339) | 337.0 (326.6–347.3) | Reference | 8.3 (0.1) | 81,649,261 (1,292,464) | 3.8 (0.02) |
AI/AN = American Indian or Alaskan Native; A/PI = Asian or Pacific Islander: NA = not applicable.
Age and income quartile rates are not age-adjusted.
Income quartile includes only data during 2003–2014.
Figure 1-.

Annual age-adjusted rates of pneumonia-associated hospitalizations: United States, 2001–2014.
The majority of pneumonia-associated hospitalizations listed a pneumonia principal diagnosis (76.8% [SE, 0.1] of pneumonia-associated hospitalizations), corresponding to an average annual age-adjusted hospitalization rate of 358.3 per 100,000 population (95% CI, 356.4–360.1) (Table 2). The remaining pneumonia-associated hospitalizations listed a respiratory failure or sepsis principal diagnosis, corresponding to an average annual age-adjusted hospitalization rate of 106.6 per 100,000 population (95% CI, 105.8–107.3). The rate of pneumonia- associated hospitalizations with a pneumonia principal diagnosis decreased over the study period (P < .0001) while the rate for those with a respiratory failure or sepsis principal diagnosis increased (P < .0001) (Fig 1).
TABLE 2 ].
Pneumonia-Associated Hospitalizations by Discharge ICD-9-CM Category: United States, 2001–2014
| Disease Category (ICD-9-CM Code) | No. (SE) | Percent (SE)a |
|---|---|---|
| Pneumonia principal code | 15,638,813 (75,243) | 76.8 (0.1) |
| Noninfluenza viral pneumonia (480) | 334,129 (4,863) | 1.6 (0.02) |
| Pneumococcal pneumonia (481) | 335,198 (2,860) | 1.7 (0.01) |
| Nonpneumococcal bacterial pneumonia (482) | 1,539,852 (13,006) | 7.6 (0.1) |
| Pneumonia due to other specified organism (483) | 106,553 (3,217) | 0.5 (0.02) |
| Pneumonia in infectious diseases classified elsewhere (484) | 279 (38) | < 0.01 |
| Bronchopneumonia, organism unspecified (485) | 222,553 (4,267) | 1.1 (0.02) |
| Pneumonia, organism unspecified (486) | 12,876,224 (64,035) | 63.2 (0.1) |
| Influenza virus (487.0, 488.01, 488.11, or 488.81) | 224,026 (2,602) | 1.1 (0.01) |
| Respiratory failure or sepsis principal code with secondary pneumonia code | 4,722,369 (32,528) | 23.2 (0.1) |
| Respiratory failure (518.81, 518.82, 518.84, 799.1) | 1,510,290 (13,044) | 7.4 (0.1) |
| Sepsis (038, 785.52, 995.91, 995.92) | 3,212,078 (24,030) | 15.8 (0.1) |
| Total | 20,361,181 (95,601) | 100 |
ICD-9-CM = International Classification of Diseases, 9th Revision, Clinical Modification; NA = not applicable.
Percentage of pneumonia-associated hospitalizations.
The majority of pneumonia-associated hospitalizations with a pneumonia principal diagnosis were of unspecified pneumonia etiology (Table 2). The most common specified etiology among pneumonia-associated hospitalizations listing a pneumonia principal diagnosis was nonpneumococcal bacteria (ICD-9-CM code 482), accounting for 7.6% (SE, 0.1) of overall pneumonia-associated hospitalizations.
In-Hospital Death
In-hospital death occurred in 7.4% (SE, 0.03) of pneumonia-associated hospitalizations (Table 1). From 2001–2003 to 2012–2014, there was no significant change in the proportion of pneumonia-associated hospitalizations with in-hospital death. In-hospital death occurred in 3.9% (SE, 0.02) of pneumonia-associated hospitalizations listing a pneumonia principal diagnosis, vs 19.0% (SE, 0.1) of pneumonia-associated hospitalizations listing a respiratory failure or sepsis principal diagnosis.
Hospitalizations by Sex, Age Group, Race/ Ethnicity, Region, and Income Quartile
Male subjects had a higher average annual age-adjusted rate of pneumonia-associated hospitalization than female subjects (Table 1). Average annual age-adjusted rates of hospitalization decreased for both male and female subjects from 2001–2003 to 2012–2014 (Table 3).
TABLE 3 ].
Trend Analysis for Pneumonia-Associated Hospitalizations: United States, 2001–2014
| Characteristics | 2001–2003 Average Annual Age-Adjusted Hospitalization Rate per 100,000 Population (95% CI)a |
2012–2014 Average Annual Age-Adjusted Hospitalization Rate per 100,000 Population (95% CI)a |
Rate Ratio (95% CI)b |
|---|---|---|---|
| Total | 480.1 (475.0–485.2) | 438.5 (435.8–441.1) | 0.9 (0.9 to 0.9) |
| Sex | |||
| Male | 540.9 (534.9–546.9) | 477.3 (474.2–480.3) | 0.9 (0.9 to 0.9) |
| Female | 441.5 (436.6–446.3) | 411.2 (408.6–413.9) | 0.9 (0.9 to < 1.0) |
| Age, y | |||
| < 1 | 1,095.1 (1,019.4–1,170.9) | 567.6 (542.7–592.5) | 0.5 (0.5 to 0.6) |
| 1–4 | 470.9 (441.3–500.5) | 314.5 (300.2– 328.9) | 0.7 (0.6 to 0.7) |
| 5–19 | 80.7 (75.0–86.3) | 68.8 (65.5–72.1) | 0.9 (0.8 to 0.9) |
| 20–44 | 113.5 (110.6–116.5) | 119.1 (117.5–120.8) | 1.0 (> 1.0 to 1.1) |
| 45–64 | 392.8 (383.9–401.7) | 463.1 (457.4–468.8) | 1.2 (1.1 to 1.2) |
| 65–74 | 1,308.3 (1,278.9–1,337.7) | 1,187.1 (1,171.8–1,202.4) | 0.9 (0.9 to 0.9) |
| 75–84 | 2,697.7 (2,635.3–2,760.2) | 2,381.6 (2,351.7–2,411.5) | 0.9 (0.9 to 0.9) |
| ≥ 85 | 5,502.8 (5,368.2–5,637.4) | 4,304.8 (4,247.9–4,361.7) | 0.8 (0.8 to 0.8) |
| Race/Ethnicity | |||
| Non-Hispanic white | 320.6 (314.9–326.2) | 412.1 (409.0–415.1) | 1.3 (1.2 to 1.4) |
| Non-Hispanic black | 413.4 (397.9–429.0) | 479.7 (472.9–486.4) | 1.2 (> 1.0 to 1.3) |
| Hispanic | 412.1 (389.3–434.9) | 346.2 (338.4–353.9) | 0.8 (0.7 to < 1.0) |
| Non-Hispanic AI/AN | 188.4 (156.3–220.6) | 480.3 (451.7–509.0) | 2.6c |
| Non-Hispanic A/PI | 268.4 (242.9–293.9) | 218.2 (210.6–225.8) | 0.8 (0.6 to < 1.0) |
| Non-Hispanic other | NAd | NAd | NAd |
| Region | |||
| Northeast | 433.6 (421.8–445.4) | 398.2 (392.8–403.7) | 0.9 (0.9 to < 1.0) |
| Midwest | 502.0 (491.6–512.4) | 465.5 (460.2–470.7) | 0.9 (0.9 to < 1.0) |
| South | 540.4 (531.4–549.4) | 487.3 (482.5–492.2) | 0.9 (0.9 to < 1.0) |
| West | 399.9 (389.8–409.9) | 363.9 (359.0–368.9) | 0.9 (0.8 to < 1.0) |
| Income quartilee | |||
| 0–25th percentile | 617.0 (591.2–642.8) | 610.1 (597.0–623.2) | 1.0 (0.9 to 1.0) |
| 25–50th percentile | 542.7 (520.5–564.8) | 514.7 (504.8–524.5) | 0.9 (0.9 to < 1.0) |
| 50–75th percentile | 434.1 (415.8–452.5) | 414.8 (406.5–423.1) | 1.0 (0.9 to 1.0) |
| 75–100th percentile | 355.4 (331.8–379.0) | 321.7 (311.9–331.4) | 0.9 (0.8 to < 1.0) |
| Pneumonia principal code | 428.4 (423.9–433.0) | 282.8 (281.0–284.6) | 0.7 (0.6 to 0.7) |
| Respiratory failure or sepsis principal code with secondary pneumonia code |
51.6 (50.7–52.6) | 155.7 (154.4–156.9) | 3.0 (2.9 to 3.2) |
AI/AN = American Indian or Alaskan Native; A/PI = Asian or Pacific Islander; NA = not applicable.
Age and income quartile rates are not age-adjusted.
Rate ratio with 95% CI, using 2001–2000 as reference group.
Unreliable estimate: the relative standard error is too high.
No rate calculated as there is no corresponding census denominator.
Income quartile includes only data during 2003–2014. Therefore, the comparison years are 2003–2005 and 2012–2014.
The average annual rate of pneumonia-associated hospitalization was highest in those aged < 1 year and those aged ≥ 65 years (Table 1). The proportion of pneumonia-associated hospitalizations with in-hospital death was highest among people aged ≥ 65 years. The rate of pneumonia-associated hospitalizations decreased from 2001–2003 to 2012–2014 for all age groups except for the 20- to 44-year and 45- to 64-year age groups (Table 3).
Non-Hispanic American Indian/Alaskan Natives and non-Hispanic blacks had the highest average annual age- adjusted rates of pneumonia-associated hospitalization of all race/ethnicities; non-Hispanic Asian/Pacific Islanders had the lowest average annual age-adjusted rate (Table 1). The proportion of pneumonia-associated hospitalizations with in-hospital death was highest among non-Hispanic Asian/Pacific Islanders, whereas it was lowest among non-Hispanic American Indian/ Alaskan Natives and Hispanics. Both non-Hispanic Asian/Pacific Islanders and Hispanics saw a decrease in the average annual age-adjusted rate of pneumonia- associated hospitalizations from 2001–2003 to 2012–2014; the average annual age-adjusted rate of pneumonia-associated hospitalization increased among non-Hispanic whites and non-Hispanic blacks (Table 3).
The South had the highest rate of pneumonia-associated hospitalizations of all regions, though in-hospital death occurred more often in the Northeast (Table 1). All regions experienced a decrease in the rate of pneumonia-associated hospitalizations from 2001–2003 to 2012–2014 (Table 3).
The average annual rate of pneumonia-associated hospitalization decreased as income quartile increased (Table 1). The proportion of pneumonia-associated hospitalizations with in-hospital death increased with increasing income quartile. The mean age at in-hospital death was lowest in the lowest income quartile (73.1 years [95% CI, 72.9–73.2]) and highest (76.4 years [95% CI, 76.2–76.6]) in the highest income quartile.
Hospitalizations by Immune Status
During 2001–2014, the proportion of pneumonia-associated hospitalizations colisting an immunocompromising condition increased from 18.7% (SE, 0.2) in 2001 to 29.9% (SE, 0.2) in 2014 (Fig 2, and e-Figs 1–3). In-hospital death occurred in 10.9% (SE, 0.1) of pneumonia-associated hospitalizations colisting an immunocompromising condition compared with 6.3% (SE, 0.03) among those not colisting an immunocompromising condition (P < .0001).
Figure 2-.
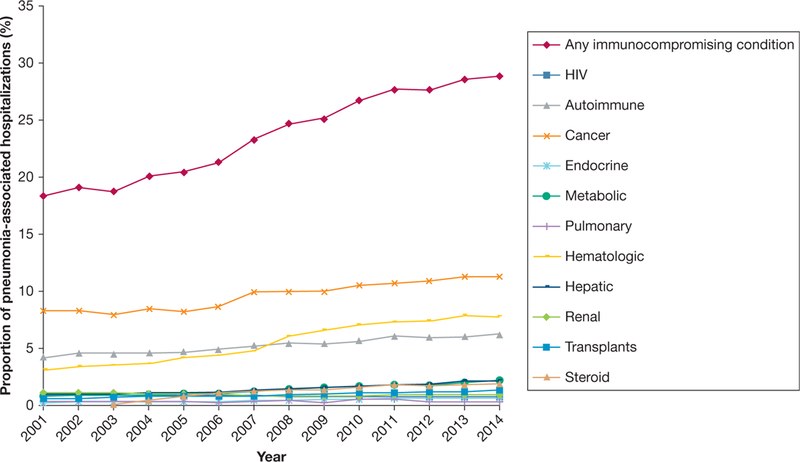
Proportion of pneumonia-associated hospitalizations colisting an immunocompromising condition: United States, 2001–2014.
Seasonality
Age-adjusted pneumonia-associated hospitalization rates were highest from December through March (Fig 3A). The proportion of pneumonia-associated hospitalizations with in-hospital death was highest for those with an admission month of July (8.2% [SE, 0.1]) and lowest in March (7.1% [SE, 0.1]), April (7.1% [SE, 0.1]), and May (7.1% [SE, 0.1]) (Fig 3B).
Figure 3-.

A, Age-adjusted rate of pneumonia-associated hospitalizations by month of admission: United States, 2001–2014. B, Proportion of pneumonia-associated hospitalizations with in-hospital death by month of admission: United States, 2001–2014
Charges
Total charges for pneumonia-associated hospitalizations in 2014 were $84,392,702,156 (SE, 1,285,930,398).
Discussion
This study underscores the large burden of pneumonia-associated hospitalizations in the United States, particularly among infants, older adults, those of lower socioeconomic status, certain race/ethnicities, and the immunocompromised. On average, approximately 1.5 million pneumonia-associated hospitalizations occurred per year, resulting in over $84 billion in charges in 2014.
We focused on a period after the introduction of PCV7, and observed that the average annual age-adjusted rate of pneumonia-associated hospitalizations and the proportion with in-hospital death decreased during the study period. This downward trend, largely driven by a downward trend in pneumonia principal diagnoses, may be related to several factors, including PCV7 introduction, changes in coding practices, and changes in health-care delivery, among others. While these trends are reassuring, the rate of pneumonia-associated hospitalizations that involved a principal diagnosis of respiratory failure or sepsis tripled from 2001–2003 to 2012–2014. This is consistent with previously reported data, and likely reflects a coding bias.7
Consistent with previous studies, infants and adults aged ≥ 65 years experienced higher average annual rates of pneumonia-associated hospitalization than other age groups.6,12 Pneumococcal and influenza vaccination are a primary means of pneumonia prevention among these age groups, but the proportion of the population vaccinated for these conditions remains below target levels.25,26 Meanwhile, average annual rates of pneumonia-associated hospitalization decreased during the study period for all age groups except persons aged 20–44 and 45–64 years. The reasons for the rise in pneumonia-associated hospitalization rate among these particular age groups are unclear.
Also consistent with previous studies, male subjects experienced higher average annual age-adjusted pneumonia-associated hospitalization rates than female subjects.27 Several lifestyle, behavioral, and socioeconomic factors may play a role in this difference.28 Male subjects also had a higher percentage of pneumonia-associated hospitalizations with in-hospital death than female subjects. Previous research has shown that differences in mortality persist even after adjusting for behavior and comorbidities, and sex-specific immune responses might play a role.29
Although inroads have been made in quantifying and elucidating the cause of racial and ethnic health disparities in pneumonia, our data show that differences persist.30,31 Consistent with previous reports, non- Hispanic blacks had among the highest rates of pneumonia-associated hospitalization among all race/ ethnicity groups—perhaps due to a higher prevalence of underlying pneumonia risk factors such as smoking and certain chronic conditions.31–34 Furthermore, we found that non-Hispanic American Indian/Alaskan Natives had a high rate of pneumonia-associated hospitalizations compared with other race/ethnicities.
These data are consistent with other studies that have examined health disparities among non-Hispanic American Indian/Alaskan Natives.35,36 Though non-Hispanic whites did not have as high a rate of pneumonia-associated hospitalizations compared with other race/ethnicities, the apparent increase in age-adjusted hospitalization rates over time among this demographic and among non-Hispanic blacks is concerning. Differences by race/ethnicity in the proportion of pneumonia-associated hospitalizations with in-hospital death (eg, 6.2% in Hispanics vs 9.6% in non-Hispanic Asian/Pacific Islanders) were also identified.
The association between income quartile and pneumonia-associated hospitalization rates that we found is consistent with data from other investigations.33 Lower income is associated with multiple pneumonia risk factors such as smoking, worse access to health care, and lower pneumococcal and influenza vaccination rates.25,34,37 There are likely additional effects of race/ethnicity and income; however, without population denominators of the distribution of race/ethnicity within each of the US income quartiles, we were unable to create rates to describe this relationship. Paradoxically, the proportion of pneumonia-associated hospitalizations with in-hospital death increased with income quartile. We suspect that this might be an artifact of age, given that mean age at in-hospital death also increased with income quartile.
The proportion of pneumonia-associated hospitalizations listing an ICD-9-CM code for an immunocompromising condition almost doubled from 2001 to 2014. Part of our findings may be explained by persons with immunocompromising conditions living longer.38,39 While the data we present highlight the importance of monitoring pneumonia among immunocompromised individuals, caution should be taken in their interpretation for multiple reasons. First, it is possible that our data related to immune status are subject to some unrecognized bias, as the codes we used have not been validated through chart review. Furthermore, the median number of secondary diagnoses listed on the discharge record for any hospitalization (not just pneumonia-associated hospitalizations) almost doubled from 3.8 (SE, 0.03) during 2001–2003 to 7.5 (SE, 0.02) during 2012–2014 (P < .05). Thus, there is likely a bias over time to list secondary diagnoses on the discharge record, and this might explain why the proportion of pneumonia- associated hospitalizations colisting an immunocompromising condition increased during the study period. Second, some of the ICD-9-CM codes we used to identify immunocompromising conditions include a wide spectrum of severity in which the early stages of disease might not greatly impair the immune system, thus potentially overestimating the proportion of pneumonia-associated hospitalizations involving immunocompromised people. Third, chronic kidney disease, a condition that can suppress the immune system, was purposely excluded from our analysis because additional subdiagnoses were added to the ICD- 9-CM code for this condition in 2005.40 When we tested the impact of including this ICD-9-CM code in our analysis, we observed a dramatic inflation in the proportion of pneumonia-associated hospitalizations colisting an immunocompromising condition starting in 2005 (e-Fig 4). Fourth, our data do not capture outpatient treatment of pneumonia, and pneumonia in an immunocompetent person is more likely to be treated in the outpatient setting41.
Understanding the etiology of pneumonia can help with targeting specific therapies for individual patients and with focusing public health interventions, but we found that > 60% of pneumonia-associated hospitalizations with a pneumonia principal diagnosis had no specified etiology. This is consistent with data from previous studies showing that a pneumonia etiology is often not identified even after extensive investigation.2,3
While hospital discharge data are useful for estimating trends in pneumonia-associated hospitalizations, there are limitations. The data presented reflect hospitalizations, not patients, and a single patient may be hospitalized more than once. As a sizeable proportion of patients with pneumonia are treated in the outpatient setting, our study estimates the more severe cases. We may have incorrectly estimated disease burden, due to use of nonspecific ICD-9-CM codes that included nonpneumonia illnesses and because we do not know the accuracy of the diagnoses listed on the discharge record. As administrative data can be affected by external factors such as reimbursement policies, the selection and distribution of principal and secondary diagnostic codes could be biased.42 However, to overcome a well-documented selection bias in coding for pneumonia, we chose to define “pneumonia-associated hospitalizations” as discharge records in which there was either a pneumonia principal diagnosis or a pneumonia secondary diagnosis in combination with a principal diagnosis of respiratory failure or sepsis.7
In conclusion, pneumonia causes significant morbidity and mortality in the United States. Populations such as the very young and older persons have historically faced the greatest risk, which is still the case today. Persons who are immunocompromised have emerged as a group representing an increasing proportion of pneumonia-associated hospitalizations. Understanding the burden of pneumonia-associated hospitalizations can potentially inform clinical treatment and public health interventions, and should continue to be monitored.
Supplementary Material
Acknowledgments
FUNDING/SUPPORT: The authors have reported to CHEST that no funding was received for this study.
ABBREVIATIONS:
- ICD-9-CM
International Classification of Diseases, Ninth Revision, Clinical Modification
- NIS
National (Nationwide) Inpatient Sample
- PCV7
7-valent pneumococcal conjugate vaccine
Footnotes
Financial/nonfinancial disclosures: None declared.
Additional information: The e-Figures and e-Table can be found in the Supplemental Materials section of the online article.
Contributor Information
Brandon H. Hayes, Regional Veterinary Emergency and Specialty Center, Turnersville, NJ.
Dana L. Haberling, National Center for Emerging and Zoonotic Infectious Diseases, Centers for Disease Control and Prevention, Atlanta, GA.
Jordan L. Kennedy, National Center for Emerging and Zoonotic Infectious Diseases Centers for Disease Control and Prevention, Atlanta, GA.
Jay K. Varma, National Center for Emerging and Zoonotic Infectious Diseases, Centers for Disease Control and Prevention, Atlanta, GA; New York City Department of Health and Mental Hygiene, New York City, NY.
Alicia M. Fry, National Center for Immunization and Respiratory Diseases, Centers for Disease Control and Prevention, Atlanta, GA.
Neil M. Vora, New York City Department of Health and Mental Hygiene, New York City, NY; Career Epidemiology Field Officer Program, Division of State and Local Readiness, Centers for Disease Control and Prevention, Atlanta, GA..
References
- 1.National Center for Health Statistics. Leading Causes of Death. Atlanta, GA: Centers for Disease Control and Prevention; http://www.cdc.gov/nchs/fastats/leading-causes-of-death.htm. Last updated March 17, 2017. Accessed October 10, 2016. [Google Scholar]
- 2.Jain S, Self WH, Wunderink RG, et al. Community-acquired pneumonia requiring hospitalization among U.S. adults. N Engl J Med. 2015;373(5): 415–427. [DOI] [PMC free article] [PubMed] [Google Scholar]
- 3.Bartlett JG. Diagnostic tests for agents of community-acquired pneumonia. Clin Infect Dis. 2011;52(suppl 4):S296–S304. [DOI] [PubMed] [Google Scholar]
- 4.Hussey P, Anderson G, Berthelot JM, et al. Trends in socioeconomic disparities in health care quality in four countries. Int J Qual Health Care. 2008;20(1):53–61. [DOI] [PubMed] [Google Scholar]
- 5.Singh GK, Hiatt RA. Trends and disparities in socioeconomic and behavioural characteristics, life expectancy, and cause-specific mortality of native-born and foreign-born populations in the United States, 1979–2003. Int J Epidemiol. 2006;35(4): 903–919. [DOI] [PubMed] [Google Scholar]
- 6.Fry AM, Shay DK, Holman RC, Curns AT, Anderson LJ. Trends in hospitalizations for pneumonia among persons aged 65 years or older in the United States, 1988–2002. JAMA. 2005;294(21):2712–2719. [DOI] [PubMed] [Google Scholar]
- 7.Lindenauer PK, Lagu T, Shieh MS, Pekow PS, Rothberg MB. Association of diagnostic coding with trends in hospitalizations and mortality of patients with pneumonia, 2003–2009. JAMA. 2012;307(13):1405–1413. [DOI] [PubMed] [Google Scholar]
- 8.Metersky ML, Tate JP, Fine MJ, Petrillo MK, Meehan TP. Temporal trends in outcomes of older patients with pneumonia. Arch Intern Med. 2000;160(22):3385–3391. [DOI] [PubMed] [Google Scholar]
- 9.Ruhnke GW, Coca-Perraillon M, Kitch BT, Cutler DM. Marked reduction in 30-day mortality among elderly patients with community-acquired pneumonia. Am J Med. 2011;124(2): 171–178.e1. [DOI] [PMC free article] [PubMed] [Google Scholar]
- 10.Griffin MR, Zhu Y, Moore MR, Whitney CG, Grijalva CG. U.S. hospitalizations for pneumonia after a decade of pneumococcal vaccination. NEngl J Med. 2013;369(2):155–163. [DOI] [PMC free article] [PubMed] [Google Scholar]
- 11.Grijalva CG, Nuorti JP, Arbogast PG, Martin SW, Edwards KM, Griffin MR. Decline in pneumonia admissions after routine childhood immunisation with pneumococcal conjugate vaccine in the USA: a time-series analysis. Lancet. 2007;369(9568):1179–1186. [DOI] [PubMed] [Google Scholar]
- 12.Jain S, Williams DJ, Arnold SR, et al. Community-acquired pneumonia requiring hospitalization among U.S. children. NEngl J Med. 2015;372(9):835–845. [DOI] [PMC free article] [PubMed] [Google Scholar]
- 13.Schnell D, Mayaux J, de Bazelaire C, et al. Risk factors for pneumonia in immunocompromised patients with influenza. Respir Med. 2010;104(7):1050–1056. [DOI] [PubMed] [Google Scholar]
- 14.Ljungman P, Ward KN, Crooks BN, et al. Respiratory virus infections after stem cell transplantation: a prospective study from the Infectious Diseases Working Party of the European Group for Blood and Marrow Transplantation. Bone Marrow Transplant. 2001;28(5):479–484. [DOI] [PubMed] [Google Scholar]
- 15.Vila-Corcoles A, Ochoa-Gondar O, Rodriguez-Blanco T, Raga-Luria X, Gomez-Bertomeu F; EPIVAC Study Group. Epidemiology of community-acquired pneumonia in older adults: a population-based study. Respir Med. 2009;103(2):309–316. [DOI] [PubMed] [Google Scholar]
- 16.Nichols WG, Guthrie KA, Corey L, Boeckh M. Influenza infections after hematopoietic stem cell transplantation: risk factors, mortality, and the effect of antiviral therapy. Clin Infect Dis. 2004;39(9):1300–1306. [DOI] [PubMed] [Google Scholar]
- 17.Sousa D, Justo I, Dominguez A, et al. Community-acquired pneumonia in immunocompromised older patients: incidence, causative organisms and outcome. Clin Microbiol Infect. 2013;19(2):187–192. [DOI] [PubMed] [Google Scholar]
- 18.Harpaz R, Dahl RM, Dooling KL. Prevalence of immunosuppression among U.S. adults, 2013. JAMA. 2016;316(23): 2547–2548. [DOI] [PubMed] [Google Scholar]
- 19.Chang MH, Moonesinghe R, Athar HM, Truman BI. Trends in disparity by sex and race/ethnicity for the leading causes of death in the United States: 1999–2010. J Public Health Manag Pract. 2016;22(suppl 1):S13–S24. [DOI] [PubMed] [Google Scholar]
- 20.HCUP Databases. Healthcare Cost and Utilization Project (HCUP): Overview of the National (Nationwide) Inpatient Sample (NIS). Rockville, MD: Agency for Healthcare Research and Quality; http://www.hcup-us.ahrq.gov/nisoverview.jsp. Last updated March 2017. Accessed September 19, 2016. [Google Scholar]
- 21.Leung J, Harpaz R, Molinari NA, Jumaan A, Zhou F. Herpes zoster incidence among insured persons in the United States, 1993–2006: evaluation of impact of varicella vaccination. Clin Infect Dis. 2011;52(3):332–340. [DOI] [PubMed] [Google Scholar]
- 22.Houchens R, Elixhauser A. Final Report on Calculating National (Nationwide) Inpatient Sample (NIS) Variances for Data Years 2011 and Earlier HCUP Methods Series Report No. 2003–02. Rockville, MD: Agency for Healthcare Research and Quality; http://www.hcup-us.ahrq.gov/reports/methods/2003_02.jsp. Last revised December 11, 2015. Accessed September 19, 2016. [Google Scholar]
- 23.Houchens R, Ross D, Elixhauser A. Final Report On Calculating National (Nationwide) Inpatient Sample (NIS) Variances for Data Years 2012 and Later HCUP Methods Series Report No. 2015–09. Rockville, MD: Agency for Healthcare Research and Quality; http://www.hcup-us.ahrq.gov/reports/methods/2015_09.jsp. Published December 10, 2014. Accessed September 19, 2016. [Google Scholar]
- 24.Klein RJ, Schoemborn CA . Age adjustment using the 2000 projected U.S. population. Healthy People 2010 Stat Notes. 2001;20:1–10. [PubMed] [Google Scholar]
- 25.Williams WW, Lu PJ, O’Halloran A, et al. Surveillance of vaccination coverage among adult populations: United States, 2014. MMWR CDC Surveill Summ. 2016;65(1):1–36. [DOI] [PubMed] [Google Scholar]
- 26.Healthy People 2020. Immunization and Infectious Diseases: Objectives. https://www.healthypeople.gov/2020/topics-objectives/topic/immunization-and-infectious-diseases/objectives. Last updated October 24, 2017. Accessed April 20, 2017. [Google Scholar]
- 27.Van Hoy A Influenza and Pneumonia Mortality Data Trends, California 2000–2007. Sacramento, CA: California Department of Public Health; https://archive.cdph.ca.gov/programs/ohir/Pages/IandP2007Sex.aspx. Accessed August 7, 2017. [Google Scholar]
- 28.Falagas ME, Mourtzoukou EG, Vardakas KZ. Sex differences in the incidence and severity of respiratory tract infections. Respir Med. 2007;101(9):1845–1863. [DOI] [PubMed] [Google Scholar]
- 29.Reade MC, Yende S, D’Angelo G, et al. Differences in immune response may explain lower survival among older men with pneumonia. Crit Care Med. 2009;37(5):1655–1662. [DOI] [PMC free article] [PubMed] [Google Scholar]
- 30.Hausmann LR, Ibrahim SA, Mehrotra A, et al. Racial and ethnic disparities in pneumonia treatment and mortality. Med Care. 2009;47(9):1009–1017. [DOI] [PMC free article] [PubMed] [Google Scholar]
- 31.Frei CR, Mortensen EM, Copeland LA, et al. Disparities of care for African- Americans and Caucasians with community-acquired pneumonia: a retrospective cohort study. BMC Health Serv Res. 2010;10:143. [DOI] [PMC free article] [PubMed] [Google Scholar]
- 32.Wiese AD, Grijalva CG, Zhu Y, Mitchel EF Jr, Griffin MR. Changes in childhood pneumonia hospitalizations by race and sex associated with pneumococcal conjugate vaccines. Emerg InfectDis. 2016;22(6):1109–1112. [DOI] [PMC free article] [PubMed] [Google Scholar]
- 33.Burton DC, Flannery B, Bennett NM, et al. Socioeconomic and racial/ethnic disparities in the incidence of bacteremic pneumonia among US adults. Am J Public Health. 2010;100(10):1904–1911. [DOI] [PMC free article] [PubMed] [Google Scholar]
- 34.National Center for Health Statistics. Health, United States, 2015: With Special Feature on Racial and Ethnic Health Disparities. Hyattsville, MD: National Center for Health Statistics; https://www.cdc.gov/nchs/data/hus/hus15.pdf. Updated June 22, 2017. Accessed April 20, 2017. [PubMed] [Google Scholar]
- 35.Groom AV, Hennessy TW, Singleton RJ, Butler JC, Holve S, Cheek JE. Pneumonia and influenza mortality among American Indian and Alaska Native people, 1990–2009. Am J Public Health. 2014;104(suppl 3):S460–S469. [DOI] [PMC free article] [PubMed] [Google Scholar]
- 36.Holman RC, Curns AT, Kaufman SF, Cheek JE, Pinner RW, Schonberger LB. Trends in infectious disease hospitalizations among American Indians and Alaska Natives. Am J Public Health. 2001;91(3):425–431. [DOI] [PMC free article] [PubMed] [Google Scholar]
- 37.Hadler JL, Yousey-Hindes K, Perez A, et al. Influenza-related hospitalizations and poverty levels: United States, 2010–2012. MMWR Morb Mortal Wkly Rep. 2016;65(5):101–105. [DOI] [PubMed] [Google Scholar]
- 38.Rana A, Gruessner A, Agopian VG, et al. Survival benefit of solid-organ transplant in the United States. JAMA Surg. 2015;150(3):252–259. [DOI] [PubMed] [Google Scholar]
- 39.Marcus JL, Chao CR, Leyden WA, et al. Narrowing the gap in life expectancy between HIV-infected and HIV-uninfected individuals with access to care. J Acquir Immune Defic Syndr. 2016;73(l):39–46. [DOI] [PMC free article] [PubMed] [Google Scholar]
- 40.National Center for Health Statistics. Conversion Table of New ICD-9-CM Codes. Hyattsville, MD: National Center for Health Statistics; https://www.cdc.gov/ nchs/data/icd/icd-9-cm_fy14_cnvtbl_final.pdf. Published October 2013. Accessed December 12, 2016. [Google Scholar]
- 41.Mandell LA, Wunderink RG, Anzueto A, et al. Infectious Diseases Society of America/ American Thoracic Society consensus guidelines on the management of community-acquired pneumonia in adults. Clin Infect Dis. 2007;44 (suppl 2):S27–S72. [DOI] [PMC free article] [PubMed] [Google Scholar]
- 42.Sarrazin MS, Rosenthal GE. Finding pure and simple truths with administrative data. JAMA. 2012;307(13): 1433–1435. [DOI] [PubMed] [Google Scholar]
Associated Data
This section collects any data citations, data availability statements, or supplementary materials included in this article.