

Abstract

Although the α-helix has long been recognized as an all-important element of secondary structure, it generally requires stabilization by tertiary interactions with other parts of a protein’s structure. Highly charged single α-helical (SAH) domains, consisting of a high percentage (>75%) of Arg, Lys, and Glu residues, are exceptions to this rule but have been difficult to characterize structurally. Our study focuses on the 68-residue medial tail domain of myosin-VI, which is found to contain a highly ordered α-helical structure extending from Glu-6 to Lys-63. High hydrogen exchange protection factors (15–150), small (ca. 4 Hz) 3JHNHα couplings, and a near-perfect fit to an ideal model α-helix for its residual dipolar couplings (RDCs), measured in a filamentous phage medium, support the high regularity of this helix. Remarkably, the hydrogen exchange rates are far more homogeneous than the protection factors derived from them, suggesting that for these transiently broken helices the intrinsic exchange rates derived from the amino acid sequence are not appropriate reference values. 15N relaxation data indicate a very high degree of rotational diffusion anisotropy (D∥/D⊥ ≈ 7.6), consistent with the hydrodynamic behavior predicted for such a long, nearly straight α-helix. Alignment of the helix by a paramagnetic lanthanide ion attached to its N-terminal region shows a decrease in alignment as the distance from the tagging site increases. This decrease yields a precise measure for the persistence length of 224 ± 10 Å at 20 °C, supporting the idea that the role of the SAH helix is to act as an extension of the myosin-VI lever arm.
Introduction
Highly charged single α-helix (SAH) domains are found in a significant fraction (0.2–0.5%) of the human protein database.1 As previously pointed out,2−4 due to their high contents of charged and polar residues and the scarcity of X-ray structure data for such motifs, they originally were believed to form coiled-coil structures based upon predictions of secondary structure programs. Unlike normal α-helices, which require tertiary interactions (hydrogen bonding, hydrophobic, disulfide, and/or van der Waals) to maintain their helical structure, SAH domains are stabilized by a repeating pattern of four negatively (glutamate, E) and four positively (arginine, R, and/or lysine, K) charged residues that form dynamic intrahelical salt bridges, while the relatively long alkyl side chains of these residues provide stabilizing hydrophobic interactions. This unique, E4(R/K)4 feature of the peptide sequence can confer a much higher degree of stability across a wide range of temperatures, pH, and ionic strength than seen in, for example, poly-Ala helices.5−7
Although dispersed throughout the human genome, there are just a few examples of SAH domains isolated in solution, including those of caldesmon8 (∼160 residues) and those from the mechano-enzymes, myosin-VI,9 myosin-X,2 and myosin-VIIA.10,11 Functionally, within these proteins, the SAH domains are believed to either serve as rigid spacers between protein domains, such as seen in caldesmon, or act as an extension of the lever arms in the myosin family of proteins. The extension of the lever arm is critical in some myosins.12 The lever arm of the well-studied myosin-V has six calmodulin bound, which allows the two motor domains to simultaneously bind to actin monomers separated by 36 nm that corresponds to the half helical repeat of the actin filament. The lever arm of myosin-VI only has one calmodulin bound, but single molecule stepping studies demonstrate that it can also take steps consistent with a motor domain separation of 36 nm. This observation suggests that the extended SAH domain helps to provide the additional lever arm length in myosin-VI. Charged SAH domains are also encountered as structural elements in otherwise intrinsically disordered proteins such as MFAP1, where they appear to regulate the repeated conformational remodeling of the spliceosome, required for activity of this molecular machine.13 They can also function as interprotein “interaction motifs”, where the distinct electrostatic SAH surface can play an important role, while the degree of intrahelical ER/K stabilization can fine-tune the strength of the intermolecular interaction.13 The remarkable spring-like properties of charged SAH rods also hold strong potential for applications in protein design and engineering.14−18
Despite extensive biochemical and biophysical studies of SAH domains, atomic level structural characterization of such helices is very sparse. To date, there is only one X-ray structure of an SAH helix in isolation,10 and very few in the context of larger protein structures or structural complexes. The latter invariably raise the question to what extent the observed helical structures are impacted or stabilized by the lattice environment in which they are observed. For example, the (non-SAH) central helix of calmodulin contains two fully solvent-exposed turns of α-helix in its X-ray structure,19 whereas in solution this region of the central helix is fully disordered.20 Solution X-ray scattering (SAXS) experiments on the medial tail domain (MT) of myosin-VI reveal a length of ∼10–15 nm, fully consistent with an SAH structure.9,21 Two distinct kinks in this helix, deduced from the SAXS data, correlate with the positions of small hydrophobic patches interrupting the pattern of E4(R/K)4 residues. However, whereas the SAXS data suggested these kinks to be static, molecular dynamics calculations pointed to transient unfolding of the helical turns comprising these patches.22
Studies of SAH domains by NMR spectroscopy have proven challenging. The very high contents of Glu, Lys, and Arg residues, all in the α-helical region of Ramachandran space, lead to very poor resonance dispersion and cause many ambiguities in the conventional triple resonance assignment procedure. More than a decade ago, the 35-residue proximal tail region of myosin 10, containing a 26-residue SAH segment, was studied by NMR.2 However, although the NOEs and chemical shifts clearly indicated a strong α-helical signature for the SAH segment, resonance overlap precluded a residue-specific analysis. Very recently, however, an in-depth study of the myosin-VIIA SAH domain was reported by the same research group,11 providing strong evidence for the α-helical structure of this element, and, most importantly, providing quantitative information on the dynamic nature of individual salt bridges that are important for its stabilization. Remarkably, the α-helical structure appears not to be disrupted by a five-residue insert near its midpoint that deviates from the canonical ER/K sequence pattern.11
Here, we present a detailed multinuclear NMR characterization of the structure and dynamics of the 68-residue MT domain of S. scrofa (pig) myosin-VI (Figure 1A), comprising residues 918–985, which have been shown to adopt an SAH structure.9,21 Resonance dispersion of the 13Cα resonances is found to be particularly poor, as expected on the basis of the sequence composition and high α-helicity of the structure. 15N and 1HN resonance line widths are much larger than usual for a 68-residue construct because nearly all amide vectors are approximately parallel to the axis of the ∼100-Å helical rod, causing their effective rotational correlation times to be long. However, fairly well-resolved 1H–15N maps can be obtained through full perdeuteration of the nonexchangeable protons and utilization of the TROSY line-narrowing effect.23 Use of four-dimensional (4D) 1H–15N–15N–1H NOESY spectra at 900 MHz 1H frequency then enables full backbone amide resonance assignments. This strategy takes advantage of the α-helical nature of the structure, which gives rise to strong sequential 1HN–1HN NOEs, and allows a straightforward link to the corresponding 13Cα chemical shifts through standard TROSY-based triple resonance NMR,24 thereby providing important residue-specific secondary structure information that complements the NOE distance information.
Figure 1.
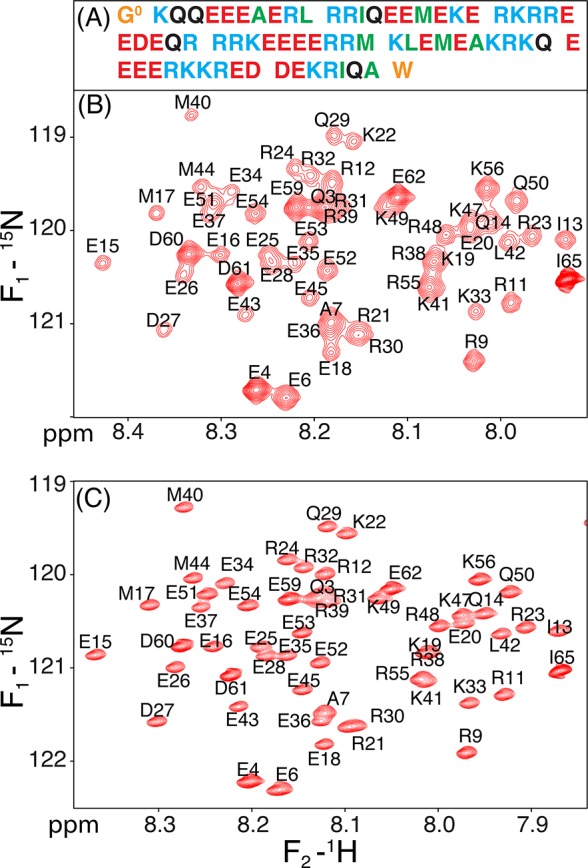
NMR spectra of myosin-VI E68W MT domain. (A) Sequence of the construct used, with residue types color coded as follows: Arg and Lys in blue; Glu and Asp in red; polar, neutral Gln in black; hydrophobic Ala, Leu, Ile and Met in green; and non-native N- and C-terminal residues in orange. (B) Most crowded region of the regular Rance-Kay HSQC spectrum of perdeuterated, amide-protonated 15N-enriched MT,72 recorded at 900 MHz 1H frequency, 20 °C, pH 6.3, 2 mM EDTA, yielding broad resonances. (C) TROSY-HSQC spectrum,23 recorded under identical conditions.
With full amide resonance assignments in hand, characterization of individual H-bonds by measurement of their protection against amide proton exchange (HX) with solvent provides direct access to the fraction of time such bonds are present.25 Although chemical shift dispersion of the aliphatic 13C and 1H resonances was far too low to permit measurement of sufficient experimental NOE restraints to define the SAH structure by conventional NOE-based methods, a full set of 1HN–1HN NOEs complemented by 15N–1HN, 15N–13C′, and 13C′–1HN RDCs could be measured in Pf1 alignment medium and sufficed to define the structure. Moreover, a nearly complete set of 3JHNHα couplings provided restraints for the φ backbone torsion angles.
Classical 15N relaxation analysis is adversely impacted by the near-parallel alignment of the 15N–1H bond vectors. However, when supplemented by 13C-detected 13Cα relaxation rates, the expected high degree of rotational diffusion anisotropy could be quantified. Importantly, chelation of a lanthanide tag near the N-terminal end of the SAH helix26 created strong local alignment of the helix relative to the magnetic field. Analogous to the pioneering work of Bertini et al.,27 the decrease in alignment as a function of distance from the tagging site then provides direct access to the persistence length of the helix. Together, these data provide a detailed characterization of both the structure and the backbone dynamics of the SAH domain embedded in the myosin-VI MT, revealing a highly regular, kink-free helical structure that extends from residue E6 to E62, with only a moderate degree of increased dynamics near the ends of the helix.
Methods
Expression and Purification
The cDNA of the native MT domain of S. scrofa (pig) myosin-VI, containing the SAH, was fused to the IgG domain B1 of Protein G (GB1) and cloned into the pET24a vector by Genscript (Piscataway, NJ), which subsequently performed site-directed mutagenesis to create MT variants (see below). Specifically, the N-terminus of SAH was spliced to a TEV cleavage site (ENLYFQG) added to the C-terminus of GB1 (GB1-TEV-SAH). To facilitate Ni:NTA purification, the GB1 domain included a 6xHis site at its N-terminus. The GB1-TEV-MT containing vector was transformed into E. coli BL21(DE3) cells and grown to an OD of ∼0.7 at 37 °C in M9 medium before induction with 1 mM of IPTG. Expression of the GB1-TEV-MT construct (3 h at 37 °C) was followed by centrifugation at 4000 rpm for 20 min at 4 °C. The cells were then resuspended in 50 mM Tris-HCl, 500 mM NaCl, 20 mM imidazole, pH 7.4, including cOmplete Roche protease inhibitor cocktail (Buffer A), and passed once through an Avestin Emulsiflex C3 homogenizer (ATA Scientific; Taren Point, Australia). The resulting lysate was then centrifuged for 1 h at 20 000 rpm and 4 °C. Next, the supernatant was filtered through a 0.22 mm filter before passage through a 5 mL GE His-trap column, equilibrated with buffer A, and eluted using a step gradient of 3% and 30% buffer B (buffer A plus 1 M imidazole), respectively. Fractions containing GB1-TEV-MT were collected and, if needed, concentrated to a volume of ∼5–7 mL before injection onto a Superdex 26/60 G75 column equilibrated with 25 mM Tris-HCl, 100 mM NaCl, 0.5 mM EDTA/TCEP, pH 8. To isolate the MT domain, TEV protease was added to the combined GB1-TEV-SAH fractions at a TEV:protein ratio of 1:50. After the reaction mixture was left for ∼16–18 h at room temperature, it was passed again through a 5 mL GE His-trap column using the aforementioned protocol. Purified MT was obtained in the flow-through. For NMR experiments, the MT domain was concentrated and buffer-exchanged into the buffers noted in the text. The construct used for our NMR studies has the following sequence, G K1QQEEEAERL RRIQEEMEKE RKRREEDEQR RRKEEEERRM KLEMEAKRKQ EEEERKKRED DEKRIQAE/W, where K1 corresponds to K917 in S. scrofa (pig) myosin-VI, which differs from H. sapiens by a K945Q substitution. The non-native N-terminal Gly is a remnant of the TEV cleavage sequence, and the C-terminal Glu was substituted by Trp during later stages of the project to facilitate quantification by optical density. The total mass of the polypeptide, assuming natural isotopic abundance, is 8972 Da (9029 Da for E68W).
For generating the requisite 15N-, 13C-, and 2H-isotopically enriched samples, 15N-ammonium chloride, 2H/13C d-glucose, or 2H d-glucose were used as the sole sources of nitrogen, carbon, and hydrogen. Additionally, for generating perdeuterated sample, deuterium oxide (99% D2O, Cambridge Isotope Laboratories, Boston, MA) was used in place of H2O in the expression medium and supplemented with 1 g/L of ISOGRO of the desired isotopic composition (Sigma-Aldrich).
For tagging MT with 4R,4S-DOTA-M8, loaded with either thulium (Tm) or lutetium (Lu), purified I13C MT domain was buffer-exchanged into 100 mM Tris-HCl pH 7.8 using a PD10 G25 column (GE Healthcare). The concentration of MT, post-PD10, was ∼20 μM. Immediately after buffer exchange, ∼20-fold molar excess of 4R,4S-DOTA-M8-Lu/Tm was added to the MT domain solution. The reaction mixture was then incubated for ∼18–20 h at room temperature before it was passed twice through a PD10 column to remove excess tag and exchange to NMR buffer. Liquid chromatography–electrospray ionization–mass spectrometry (LC–ESI–MS) was used to verify the identify and purity of the I13C MT-DOTA-Lu/Tm. No impurities or unlabeled I13C MT were observed in this LC–ESI–MS analysis.
Circular Dichroism Measurements
CD spectra were recorded in 20 mM sodium phosphate buffer, 2 mM EDTA, pH 6.3, on a JASCO J-810 spectropolarimeter using a 0.1 cm path length quartz cuvette. Thermal melt experiments were carried out by recording the CD signal at 222 nm as a function of increasing temperature from 0 to 80 °C at 0.5 °C/min. Using the CD spectra from 190–260 nm, the α-helical content was derived using the CDNN program.28
Backbone Assignment Experiments
All experiments used for backbone assignments were in 20 mM sodium phosphate buffer, 2 mM EDTA, pH = 6.3, 20 °C. The 4D 1H–15N–15N–1H HMQC-NOESY-TROSY-HSQC spectrum was pivotal in the assignment procedure and was carried out on a 900-MHz Bruker Avance-III spectrometer equipped with a z-gradient TCI cryogenic probe, on a 1 mM solution of 2H/15N MT in 92% H2O, 8% D2O, and assignments of the TROSY-HSQC spectrum subsequently were transferred to different conditions mostly by stepwise titration. To generate sufficient spectral resolution in the available measurement time (2.5 days), nonuniform sampling was employed,29 with acquisition times of 39.7 ms (1H,t1), 38.4 ms (15N,t2), 128 ms (15N,t3), and 170 ms (1H,t4), with a sparsity of 0.49% prior to extension of the time domain data. A total of four scans per FID was used to permit phase cycling for axial peak suppression. Spectral reconstruction was carried out with the SMILE program,30 yielding a final digital resolution of 6.7 Hz (1H,F1), 7.1 Hz (15N,F2), 1.6 Hz (15N,F3), and 2.2 Hz (1H,F4). Additionally, a 3D TROSY-HNCACB spectrum was recorded at 700 MHz 1H frequency on a 1 mM sample of 2H/15N/13C MT. All data were processed using NMRPipe,31 and assignments were made by means of analysis software included with NMRPipe, principally scroll.tcl and NMRDraw.
Backbone Dynamics
Heteronuclear TROSY-based relaxation experiments using previously described pulse sequences32 were carried at 600 and 800 MHz 1H frequency on a 1 mM solution of 2H/15N MT at 20 °C, to obtain 15N longitudinal (R1), transverse (R1ρ), and heteronuclear 15N{1H} NOE relaxation data. R1ρ measurements were carried out using a spin-lock field strength of 2.5 kHz (calibrated according to the power level needed to obtain a 100 μs 90° pulse width), and reported values were corrected for off-resonance effects using R1ρ = (R1ρ′ – sin2 φR1)/cos2 φ, where R1ρ′ is the experimentally measured value, R1ρ is the on-resonance value, and φ = tan–1(δ/νRF), with δ being the resonance offset and νRF the strength of the spin lock field, both in units of Hz.33 Analysis of the relaxation data was carried out using the Modelfree4 program,34 downloaded from the NYSBC Web site (www.NYSBC.org).
3JHNHα Measurement
Residue-specific values for 3JHNHα were obtained at 35 °C and 900 MHz from a fully protonated, 15N-enriched sample (1 mM) of MT. Two ARTSY-J experiments35 were carried out, using 3JHNHα dephasing durations, τd, of 30 and 50 ms. Using the relation 3JHNHα = (1 + 0.206R1ατd)Japparent,35 comparison of the two sets of Japparent values (Figure S1) yielded R1α = 5.7 s–1. Values reported here (Table S1) include the correction relative to the values measured for τd = 30 ms, and are 3.5% larger than Japparent at τd = 30 ms.
Hydrogen Exchange
HX rates were measured at 900 MHz 1H frequency at both 20 and 30 °C, using a 1 mM sample of perdeuterated, 15N-enriched MT sample in 95% H2O, 5% D2O, 25 mM sodium phosphate buffer, pH 7.8. Rates were measured using the WEX-III TROSY experiment,36 using acquisition durations of 155 ms (t1, 15N) and 122 ms (t2, 1HN), and seven durations for the water inversion interval, ranging from 5 ms to 1 s.
Residual Dipolar Couplings
RDCs were measured under various different alignment conditions. Two sets were collected where the MT alignment was induced by immersing it in a dilute liquid crystalline suspension of Pf1, purchased from ASLA Biotech, Riga, Latvia. The first sample contained 13 mg/mL Pf1 in 25 mM sodium phosphate buffer, pH 6.3, 2 mM EDTA; the second sample contained an additional 100 mM NaCl. Pf1 was purchased as a concentrated stock solution, which due to its high viscosity made precise pipetting challenging. Reported Pf1 sample concentrations therefore were derived from the observed 2H lock solvent splitting, using the approximation that a lock splitting of p Hz corresponds to p mg/mL Pf1.37 A third set of RDCs was acquired using paramagnetic alignment, in a solution containing 25 mM sodium phosphate buffer, pH 6.3, 2 mM EDTA. This latter set required generation of two samples, with either a paramagnetic (Tm) or diamagnetic (Lu) lanthanide chelated to a DOTA-M8 metal-binding tag, engineered and kindly provided to us by Dr. D. Haussinger.26 The DOTA-M8 was attached to Cys-13 of a I13C mutant of the MT construct. For all samples, 1H–15N RDCs were obtained at 900 MHz 1H frequency using the ARTSY experiment,38 which derives the RDCs from intensity ratios in two TROSY-HSQC spectra, recorded in an interleaved manner. Additionally, for the sample with added salt, one-bond 13C′–15N and two-bond 13C′–1HN RDCs were derived from the difference in splitting observed between two 900 MHz E.COSY-HSQC-TROSY spectra,39 recorded with and without Pf1 on a uniformly 15N/13C/2H-MT sample.
Results
Resonance Assignment and Secondary Structure
The highly repetitive MT sequence (Figure 1A) and its very high fraction (72%) of Arg, Glu, and Lys residues, which have nearly the same random coil chemical shifts, and therefore very similar 13Cα chemical shifts when embedded in α-helical secondary structure, caused numerous ambiguities when following the conventional triple resonance assignment protocol. Moreover, we observed rapid transverse relaxation of both the amide 1H and the 15N resonances, much faster than anticipated for the small size of the MT domain studied here (69 residues), resulting in broad, weak resonances (Figure 1B). The rapid transverse relaxation results from the high anisotropy of MT’s rotational diffusion tensor, where the amide vectors are aligned approximately parallel to the helical axis and thereby experience the slowest rotational diffusion.11 However, TROSY-HSQC measurements carried out at 900 MHz dramatically improve the attainable spectral resolution (Figure 1C) and remove the large variation in intensities that results from modest fractional differences in transverse relaxation rates. The anticipated high helicity of the MT domain22 (>90% based on CD measurements; Figure S2) resulted in relatively strong and quite uniform sequential amide–amide NOE connectivities, dNN. This feature, combined with improved resolution attained through TROSY detection and the use of nonuniform sampling (NUS), enabled the recording of highly resolved 4D amide–amide NOESY spectra on a perdeuterated, amide-protonated sample (Figure 2), which in addition to strong sequential, dNN(i,i ± 1), connectivities also showed numerous weaker dNN(i,i ± 2) and even dNN(i,i ± 3) NOEs, permitting straightforward and unambiguous linking of all amides throughout the entire helical section of the MT construct. Assignments of the most N- and C-terminal residues were confirmed by recording a TROSY-HNCACB spectrum, which also yielded 13Cα and some 13Cβ chemical shifts. Large secondary 13Cα chemical shifts confirm the uniformity of the helical structure of the MT domain, with a gradual reduction in secondary chemical shifts toward the termini of the MT domain, indicative of increased helical fraying (Figure 3A).
Figure 2.

Depiction of the residue assignment protocol for the MT domain using a 4D amide–amide HMQC-NOESY-TROSY-HSQC spectrum (900 MHz; 250 ms NOE mixing time; 20 °C), recorded with nonuniform (0.49% sparsity) sampling. (A) Projection of the 4D spectrum on the (F3, F4) TROSY-HSQC plane. The chemical shift scales have been adjusted to make them consistent with the HSQC cross sections by adjustment for the 1JNH/2 displacement of cross peak positions in TROSY-HSQC spectra. (B,C) Two-dimensional (F1, F2) cross sections, orthogonal to the (F3, F4) planes, at the chemical shift positions of the amide resonances of (B) E34, marked by the red cross hairs, and (C) E35, marked by the blue cross hairs. Cross peaks to i ± 1 and i ± 2 are marked by residue type and number. E34 in (B) also displays a weak cross peak with i – 3 residue R31.
Figure 3.

Residue-specific NMR parameters reporting on secondary structure of MT. (A) 13Cα secondary chemical shifts. Secondary chemical shifts are relative to the Poulsen random coil values,73 corrected for the effect of deuteration.74 (B) 3JHNHα couplings measured at 35 °C. Values were measured at 900 MHz 1H frequency using the ARTSY-J experiment, and corrected for the effect of R1(Hα).35 The secondary chemical shifts and 3JHNHα were measured at 35 °C, for a construct that includes E68.
Despite the rather fast transverse relaxation of the 1HN resonances, even in TROSY-type spectra, and the small values of 3JHNHα couplings in helical structure, reliable values for this coupling were measured at 35 °C using the recently introduced ARTSY-J experiment.35 This experiment relies on the comparison of the amide signal TROSY intensity in the presence and absence of 3JHNHα dephasing. The measurement was carried out for dephasing durations of 30 and 50 ms, yielding very close agreement between the two sets of data (Figure S1). These 3JHNHα values (Figure 3B) are highly consistent with the corresponding secondary 13Cα chemical shifts and confirm the uninterrupted helical structure of the MT domain, explaining the exceptionally high mean residue ellipticity at 222 nm of ca. −3500 deg·cm2/dmol at 20 °C (Figure S2).
Structure of MT
While initially the MT domain of myosin-VI was believed to be a dimeric coiled coil,40,41 its monomeric nature was subsequently established by multiple-angle light scattering.9 Indeed, indistinguishable resonance positions and line widths in our TROSY-HSQC spectra recorded at concentrations of 10 μM to 1 mM do not show any sign of intermolecular interactions (Figure S3A). With the uninterrupted α-helical structure of MT firmly established from 13Cα chemical shifts and 3JHNHα couplings, RDCs provide a unique and unambiguous route to study the global structure of the MT domain and probe for the presence of potential bends or kinks.
As anticipated, alignment of the highly charged MT domain in a liquid crystalline suspension of filamentous bacteriophage, Pf1, is impacted by its extreme deviation from spherical shape, which results in strong steric alignment. Additionally, the alignment is impacted by electrostatic interaction with the highly negatively charged Pf1 phage. This latter interaction can be reduced by increasing the ionic strength of the buffer, and measurements therefore were carried out at both our standard condition (20 mM sodium phosphate, 2 mM EDTA, pH 6.3) and the same buffer with addition of 100 mM NaCl. SAH domains are known to be little impacted by ionic strength at salt concentrations below ca. 1 M.4 Indeed, the NMR spectrum is minimally affected by the addition of 100 mM NaCl (Figure S3B), confirming that the structure is not altered within our detection limits, while making the spectrum more amenable to measuring RDCs at high precision.
Measurement of 1DNH RDCs in 13 mg/mL Pf1 shows considerably larger couplings in the sample containing the additional 100 mM NaCl than the measurement in standard buffer, confirming that the MT alignment is impacted by both steric and electrostatic interactions with the filamentous phage. In the sample containing 100 mM NaCl, the sinusoidal oscillation in the size of the RDC, commonly referred to as a dipolar wave pattern,42 is of small amplitude and nearly vanishes for the center region (E28-E37; Figure 4A), as expected when the helical axis becomes nearly coincident with the symmetry axis of a (nearly) axially symmetric alignment tensor (Supporting Information text). In fact, the small amplitudes of the dipolar wave oscillations on both the N- and the C-terminal sides of this center region already foreshadow that the helix axis does not contain any substantial kinks or bends. In the absence of the additional salt, the alignment of the MT domain is somewhat weaker, and the center of the helix orients at a small angle (of ca. 18°) relative to the z-axis of the now slightly more rhombic alignment tensor (Table S8). In the presence of salt, alignment was sufficiently strong to permit measurement of the smaller 1DC′N and 2DC′H RDCs, in addition to 1DNH. The relative precision at which these smaller couplings can be measured from a HSQC-TROSY-E.COSY spectrum39 is somewhat lower than that for 1DNH RDCs (Figure 4B,C), but nevertheless these couplings serve as important complements to 1DNH as they strongly increase the width of the orientational distribution of the sampled RDC vectors.
Figure 4.

Measurement of RDCs at 900 MHz, 20 °C. (A) 1DNH values measured in the presence of 13 mg/mL Pf1 in 20 mM sodium phosphate, 2 mM EDTA, pH 6.3 (black), and upon addition of 100 mM NaCl (red) on a 1 mM sample of perdeuterated 15N/13C enriched MT. Plotted values ignore the negative sign of γ(15N); i.e., the plotted negative values correspond to |1JNH + 1DNH| splittings smaller than 90 Hz. (B,C) Small regions of the TROSY-HSQC-E.COSY spectra on (B) the isotropic and (C) the aligned sample, illustrating the measurement of 1DNC′ and 2DC′H couplings in the sample containing 100 mM NaCl. RDCs are listed in Table S2.
With a Q-factor of 21%, the RDCs of residues E6-K63 fit quite well to an idealized α-helical structure (Figure 5A), but deviations exceed the errors in the RDC measurements by at least 2-fold, meaning that some deviations from an ideal α-helix are present.
Figure 5.

Results of SVD fits of experimental RDCs to an idealized α-helical structure with backbone torsion angles of φ = −62.5°, ψ = −42.5°, ω = 180°. Only the RDCs for residues E6–R63 were used to carry out the fit, but the correlation is shown for all observed couplings. 1DNC′ and 2DC′H were upscaled by multiplication with the inverse of the respective dipolar interaction constants (2609 and 6962 Hz)75 relative to 1DNH (21 585 Hz), ignoring the effect of the sign of the 15N gyromagnetic ratio on the RDC, thereby ensuring that normalized RDCs of the same value correspond to the same orientational restraint. Thus, the uniformly negative values of 1DNH in the plot correspond to |1JNH + 1DNH| < 92 Hz. RDCs were measured in the presence of 13 mg/mL Pf1, 100 mM NaCl, except for the light red 1DNH values (no NaCl). (A) SVD fit of the RDCs (scaled for the interaction constants). (B) SVD fit of the RDCs after correction for the variation in 15N R2 value, as discussed in the text, to (B) the idealized α-helical structure and (C) the XPLOR-NIH structure, refined with the R2-corrected RDCs. (D) Two orthogonal views of the refined structure, with the backbone displayed as a ribbon diagram, and the corresponding alignment frames depicted next to them (top, no NaCl; bottom, with 100 mM NaCl); side chains are shown in full atom representation, but are restrained solely by the empirical force field terms (tDB and eefxpot) in the XPLOR-NIH48 structure calculation. Glu and Asp are in red; Lys and Arg in blue; and gray for all other residues. Salt bridges and H-bonds between the side chains are drawn as thick lines.
It is well recognized that RDCs are impacted by internal motions,43,44 a fact that has been exploited extensively to quantify the amplitude and direction of internal motions, integrated over time scales ranging from pico- to microseconds.45 For moderate amplitude isotropic internal motion, the experimentally detected RDCs, to first order, scale with the size of the generalized local order parameter S. In the absence of slower, micro- or millisecond internal motions, as applies for MT (vide infra), S is equivalent to the square root of the Lipari–Szabo46 generalized order parameter, S2, commonly extracted from 15N relaxation analysis.
Although for globular proteins, the amplitude of internal motions across residues involved in secondary structure is relatively uniform, and correction for the amplitude of motions in the calculation of an accurate, time-averaged structure is not needed, for the MT domain the situation is somewhat more complex. As discussed below, 15N R2 rates monotonically decrease when approaching the ends of the helical domain, indicative of increased amplitudes of motion. To first order, 15N R2 equals S2 × J(0), where J(0) is the spectral density at zero frequency. The possibility that this decrease could be caused by a gradual bending of the helix relative to an approximately axially symmetric rotational diffusion tensor is excluded by the consideration that 15N–1H vectors are pointing away from the helical axis by about 14°. Therefore, a bending of the helix axis would cause a modulation of the 15N–1H angle, as a function of residue number, relative to the diffusion tensor, and thereby introduce a periodic oscillation of J(0), which is contrary to observation (vide infra).
We therefore make a first-order correction by scaling all RDCs observed for residue i by the square root of R2(center)/R2(i), where R2(center) equals the average 15N R2 rate for the center 15 residues (residues E28–L42). Importantly, this correction of the RDCs for the effect of internal dynamics results in improved fits of these scaled RDCs to an idealized α-helix (Figure 5B), as well as improved cross validation statistics for a structure derived de novo from RDCs, in particular for residues near the ends of the SAH domain (Table S3).
Together with the information derived from hydrogen exchange measurements (vide infra) that the amides of A7–I65 are engaged in α-helical H-bonds, allowing the use of an empirical potential-of-mean-force (PMF),47 these scaled RDCs then serve as the primary restraints in a calculation of the structure using the XPLOR-NIH program.48 As expected, the resulting structure is highly regular, lacks any significant kinks, and only shows a very minor degree of bending along its ca. 90 Å long axis (Figure 5D). With a Qfree of 12.9%, agreement between the observed and best-fitted RDCs to this “static” structure (Figure 5C) is remarkably good (Table S3). It is worth pointing out that this Qfree factor is a true cross validation measure: Four sets of structures were calculated, leaving out all RDCs for residues m + n × 4, with m = 5, 6, 7, or 8, and n = 0, .., 14. Qfree values were then calculated on the basis of the differences between observed RDCs and those not used in each of the four sets of structures, while using the alignment tensor parameters obtained for a structure where all RDCs were included. Slightly lower (i.e., better) Qfree values can be obtained by randomly, cyclically omitting a smaller fraction of the RDCs.49 However, with four RDCs per peptide group of fixed, planar covalent geometry, the issue of whether the obtained Q value then represents a true cross validation statistic can be debated, and we therefore opted against this latter approach and chose to use the more challenging statistic.
As mentioned above and discussed in more detail below, our finding that, on average, the helical axis is nearly straight does not mean that it does not undergo substantial time-dependent deviations from this average. Below, we first discuss the amplitude of local internal backbone dynamics, followed by a discussion of the impact of such motions on the persistence length of the helix.
Relaxation-Derived Backbone Dynamics of MT
The amplitude and time scale of internal backbone motions are first evaluated by standard analysis of 15N R1, R2, and 15N{1H} NOE relaxation rates measured at 800 and 600 MHz 1H frequency (18.8 and 14.1 T, respectively) while accounting for anisotropic rotational diffusion.50,51 Near the midpoint of the MT domain, its R1 rates at 18.8 T are low and approach 0.5 s–1, while, at a value of ca. 40 s–1, the R2 rates are exceptionally high for a construct of only 69 residues. A plot of the R1ρ rates measured at 18.8 T against the 14.1 T values yields a straight line with a slope of 1.19 and no significant outliers (Figure S4). This slope is very close to the ratio expected for a process dominated by J(0) spectral density, a field-independent dipolar interaction constant of 21.6 kHz, and a 15N chemical shift anisotropy of 170 ppm. This result therefore excludes the presence of significant exchange contributions, Rex, to the observed transverse relaxation rates. We note that a spherically shaped protein with a volume equal to that of the MT domain (ca. 10 nm3) with an additional 0.3 nm layer to account for surface hydrogens and the hydration layer52,53 has a calculated overall correlation time of about 6 ns at 20 °C, and R2/R1 ratios of 4.4 and 6.9 at 600 and 800 MHz, respectively. The R2/R1 ratios of MT are more than 10 times larger, foreshadowing that its overall diffusion is highly anisotropic.50,51
Unfortunately, the very narrow orientational distribution of N–H vectors within a single, nearly straight helix is insufficient to determine the anisotropy of a rotational diffusion tensor,54 and we therefore first aim to measure the 13Cα relaxation rates and 13Cα–{1Hα} NOE values in a fully protonated, 13C/15N-labeled MT sample. The 13Cα–1Hα vectors make an angle of ca. 65° with the helix axis, and therefore 13Cα relaxation is dominated by rotation of MT around its long axis, that is, by the D∥ component of the diffusion tensor. This contrasts with 15N R2 relaxation, which is dominated by D⊥.
Site-specific measurements of 13Cα relaxation rates, which, at least in principle, could be carried out by transfer of 13Cα magnetization via 13C′ to 15N, followed by amide 1H detection, are challenging for the MT domain due to the fast transverse relaxation of 13C′, yielding low sensitivity. Instead, we resorted to direct 13C observation, where the 13Cα resonances of the helical Glu, Lys, and Arg residues are completely overlapped (Figure S5A). The intense, downfield shoulder of this unresolved cluster of resonances has the largest secondary 13Cα chemical shifts and therefore is representative of the most ordered residues in the MT helix. Indeed, its R1 (1.4 s–1) and R2 (38 s–1) values (Figure S5) are consistent with rapid reorientation of the 13Cα–1Hα vector. Considering that R2 rates in proteins are dominated by J(0) spectral density and that the prefactor from the one-bond dipolar interaction combined with the effect of chemical shift anisotropy is about 3.5-fold larger for 13Cα than for 15N, for isotropic diffusion one would expect R2(13Cα) ≈ 3.5 × R2(15N) ≈ 120 s–1 instead of the observed, more than 3-fold lower value, pointing to extreme rotational diffusion anisotropy.
To quantify the rotational diffusion anisotropy, we first carried out a modelfree46 analysis of the center section of the MT domain, whose RDCs were least impacted by internal dynamics and whose structure is precisely known from the above RDC analysis.
Relaxation data analysis was carried out using the Modelfree4 software package,34 which permits restriction of diffusion tensor anisotropy values, ρ = D∥/D⊥, or fixation of the mean correlation time, τm = 1/(2D∥ + 4D⊥). A systematic search for the applicable rotational diffusion tensor was carried out using the relaxation rates of the most ordered, center part of the MT domain (residues E28–L42). Perhaps surprisingly, this search reveals that there is a substantial range of ρ and τm combinations that can fit the 15N and 13Cα relaxation rates to within experimental error (Figure 6A), with a shallow minimum centered near ρ = 10.5, τm = 9 ns, but the entire blue region of the plot satisfies the relaxation data well within experimental error. These ρ and τm values are in agreement with results of hydrodynamic calculations for a straight α-helix of 60 residues (90 Å) in length and a radius of 6 Å, where the radius has been derived assuming a protein density of 1.4 g/cm3. Adding the standard 3 Å surface layer to account for the sum of the “bare-atom” correction and the hydration surface layer,52 this yields a hydrated cylinder of 96 Å in length and 18 Å in diameter (Supporting Information text). Hydrodynamic modeling calculations by Garcia de la Torre and Bloomfield53,55 then yield a τm value of 10.3 ns, and a diffusion anisotropy ρ = 7.6, fully consistent with those obtained by the Modelfree4 fit34 to our experimental data.
Figure 6.

Analysis of MT backbone dynamics from 15N relaxation data using the Modelfree4 program.34 (A) Grid search over the mean rotational correlation time τm and the diffusion anisotropy ρ = D∥/D⊥ for the minimum normalized χ2 = {Σn=28,...,42[(R1,n800,obs – R1,n800,fit)]2/ε12 + (R1,n600,obs – R1,n600,fit)2/ε12 + (R2,n800,obs – R2,n800,fit)2/ε22 + (R2,n600,obs – R2,n600,fit)2/ε22 + (NOEn600,obs – NOEn600,fit)2/ε32 + (R1,C600,obs – R1,C600,fit)2/ε42 + (R2,C600,obs – R2,C600,fit)2/ε52 + (NOEC600,obs – NOEC600,fit)2/ε62}/N function when fitting the relaxation rates of residues n = 28–42 to the simple modelfree formalism with axially symmetric overall diffusion, using the coordinates of the RDC-refined MT domain. R1,n, R2,n, and NOEn refer to the longitudinal and transverse 15N relaxation rates of residue n, and its 15N{1H} NOE, whereas R1,C, R2,C, and NOEC are the corresponding average rates measured for the overlapping group of E/R/K/Q residues in Figure S5 and include the entire helix. N corresponds to the total number of fitted experimental constraints, and the colors correspond to log(χ2). Uncertainties in the experimental R1 rates (ε1) and R2 rates (ε2) were estimated to be 3% of their measured values; the error in the NOE was ε1 = 0.03 based on the signal-to-noise in the acquired spectra, and 13C errors were estimated at ε4 = 0.03 s–1, ε5 = 1 s–1, and ε6 = 0.01. The blue region of the plot marks the range of τm and ρ where the data can be fit to within their experimental uncertainty (log(χ2) ≤ 0). (B–D) Agreement between experimental (B) R1, (C) R2, and (D) 15N{1H} NOE data (black symbols, 600 MHz; red symbols, 800 MHz) and corresponding values predicted by Modelfree (solid blue lines) when using τm = 10.3 ns; ρ = 7.6 (position X in panel A), and the fitted residue-specific order parameters S2 (E) and internal correlation times τe (F) obtained by Modelfree4.
With the global diffusion tensor established above, the full set of relaxation rates derived for the entire MT construct was used to evaluate the amplitude and time scales of motions within the frame of this diffusion tensor. We found that the “simple modelfree” fitting,46 that is, ascribing a single time scale to the internal motions, can adequately fit the experimental data (Figure 6B–D). Near the middle of the MT domain, the fitting results yielded S2 values that exceed 0.9 (Figure 6E), and therefore are comparable to what is found in well-structured globular proteins. When moving closer to the N- and C-termini of the helix, a gradual decrease in S2 is observed, consistent with somewhat smaller RDCs, discussed above. The effective correlation times for the internal motions derived by Modelfree4, ca. 1 ns (Figure 6F), are considerably longer than the typical values of 50–100 ps seen in globular proteins. We interpret such motions as undulations in the straightness of the helical rod, with the amplitude relative to the inertia frame naturally increasing (i.e., decreasing S2) when approaching the ends of the helix. Such motions clearly are expected to span a range of time scales, but as stipulated in the modelfree approach,46 a distribution of these times cannot be extracted uniquely from the available experimental data and therefore is substituted by a single effective value. The amplitudes of the fluctuations of the N–H vector orientations, reflected in S2, in this analysis can be interpreted as resulting from local fluctuations in the orientation of the helix axis relative to its average, nearly straight structure. If interpreting this motion as diffusion in a cone of half angle θ0, S2 ≈ 0.6 values near the ends of the helix correspond to S ≈ 0.775, or θ0 ≈ 33°.
Rotational Diffusion from 1H–1H NOE
The rotational diffusion of MT is also encoded in the 1HN–1HN NOESY spectrum of fully perdeuterated, amide-protonated protein. In particular, the ratios of the sequential cross-peak to diagonal peak intensity, Ii±1/Id, prove useful for this purpose. Growth of NOE cross peaks decreases with mixing time, making the buildup of NOE intensity nonlinear in the region where high intensity cross peaks are obtained. On the other hand, diagonal intensity decreases with mixing time. As a consequence, the ratio of diagonal to cross peak intensity remains close to linear over a much wider range of mixing times than the cross-peak buildup itself (Supporting Information text; Figure S6A). Importantly, our 4D NOESY spectrum of this sparse 1H spin system provides well-resolved access to both the diagonal and the cross peaks and provides a simple alternative to recent work aimed at making the relation between NOE and interproton distance more quantitative.56
The buildup of NOE cross peak intensities between protons i and j is proportional to the 1H–1H cross-relaxation rate, σij. This rate, σij, is a function of (a) the overall rotational diffusion tensor of the helix, (b) the internuclear Hi–Hj distance, and (c) the angle of the Hi–Hj internuclear vector relative to the long axis of the helix. In addition, an order parameter SHH2 that accounts for internal motion of the Hi–Hj internuclear vector scales σij. The NOESY spectrum was recorded using a long mixing time (0.25 s) to ensure adequate signal/noise of the cross-peak intensities. Its cross-peak intensities then can be readily compared to those calculated for an idealized α-helix (Supporting Information text). Spin-diffusion effects were accounted for by including cross-relaxation involving seven sequential spins in the simulations of the cross-peak intensities. For a mixing time of 250 ms, the calculation using the above derived diffusion tensor yields a value of Ii±1/Id = 0.33, in fair agreement with experimentally observed ratios of 0.26 ± 0.03 for residues E6–K63 (Figure S6). The result that the calculated value is somewhat larger than that measured is attributed to internal motions, that is, SHH2 < 1, similar to what is found for the N–H order parameter. The experimentally observed decrease in Ii±1/Id ratios as residue positions recede from the center of the helix (Figure S6B) closely parallels the behavior of 15N R2 and S2 (Figure 6C,E). Although for MT, the decrease in sequential 1HN–1HN NOE when approaching the terminal regions is foreshadowed by the 15N relaxation analysis, ignoring that the increased amplitude of backbone dynamics results in only very small distance errors: a 20% decrease in 1HN–1HN NOE leads to an overestimate of rHH by as little as 0.1 Å. The low degree of sensitivity of interproton distance to internal dynamics can be seen as a strength but also poses challenges when aiming to derive quantitative dynamic information from a joint structural and dynamical analysis of NMR data,57 an issue that also has resulted in much debate regarding the quantitative analysis of RDCs in terms of dynamics.45,58
Backbone Amide Hydrogen Exchange
Exchange of a protein backbone amide hydrogen with solvent (HX) requires that it is not involved in a H-bond. For a protein, where H-bonds transiently break due to dynamic fluctuations, the ratio of the rate at which an amide exchanges with solvent and that rate in a disordered short peptide of the same linear sequence (intrinsic HX rate) is commonly interpreted as quantitative information about the fraction of time the H-bond is broken.59 The inverse of this ratio is often referred to as the protection factor, P. We have measured the hydrogen exchange rates at two temperatures, at a pH value of 7.8 where most of the exchange rates fall in the 0.5–20 s–1 range, which allows for their convenient and accurate measurement using the WEX-III TROSY hydrogen exchange experiment (Figure 7A).36 Measured P values fall in the range of 15–150 for residues A7–I65, and somewhat lower values closer to the ends of the SAH domain (Figure 7B). Consistent with the 15N relaxation data, the RDCs, and the 3JHNHα couplings, protection factors less than two for residues E4–E6 and Q66–E68 indicate that the amide hydrogens of these residues are less than 50% of the time engaged in α-helical H-bonds. The amide of A7 (P ≈ 15) is expected to make an α-helical H-bond to the carbonyl oxygen of Q3, and the HX measurements therefore indicate that the helix initiates at Q3, and terminates at I65 (P ≈ 3), with increased internal dynamics near the termini of this SAH region.
Figure 7.

Backbone amide hydrogen exchange of the MT domain in 20 mM sodium phosphate, 2 mM EDTA, pH 7.8. (A) HX rates as a function of residue number at 20 °C (black) and 30 °C (red). (B) HX rates converted to protection factors, P, by dividing them by the corresponding intrinsic exchange rate number at 20 °C (black) and 30 °C (red). (C) Correlation graph between the hydrogen exchange rates at 20 and 30 °C. The slope of the correlation, when excluding the outlying, labeled terminal residues, is 4.5. For amides that are not H-bonded, the expected slope is 2.5.
A caveat regarding the precise interpretation of P values is that they are referenced to random coil values, which only account for the residue type of the amide considered and that of its preceding neighbor while ignoring the effect of more distant residues. Considering the substantial effects of nearby charged groups on the local OH– concentration, which dominates the HX rates at the near-neutral pH used in our study, uncertainty in the actual intrinsic HX rates may impact the true P values by non-negligible amounts. A second, and potentially even larger problem with using intrinsic, random coil HX rates as the reference for the not H-bonded state could result from the fact that the newly solvent-exposed amide at a transient break in an α-helix then is situated at the N-terminus of a newly formed α-helical fragment. The large electric dipole moment of this fragment elevates the electrostatic potential at the position of its solvent-exposed N-terminal amide, thereby increasing the OH– concentration and the associated rate of base-catalyzed HX. Thus, it is possible that the solvent exchange rate of transiently exposed amides is considerably higher than the intrinsic HX rates in short, unstructured peptides. Our experimentally measured rates provide some support for this hypothesis as the residue-by-residue variation along the sequence is far smaller than the variation in the protection factor, P (Figure 7).
The temperature dependence of the HX rates has been widely used to probe the nature of the unfolding process in globular proteins.60 For MT, a plot of HX rates measured at 20 °C versus those at 30 °C (Figure 7C) shows a remarkably linear correlation for all but the terminal residues, with a slope of 4.5, considerably larger than the factor of 2.5 that applies for the intrinsic HX rate.59 Only the residues near the ends of the SAH domain of MT, specifically E5–A7 and D61–I65, show a ratio intermediate between the random coil value of 2.5 and the factor of ca. 4.5 observed for the other SAH residues.
For a global unfolding process, an increase in temperature or denaturant concentration is expected to result in the same fractional change of the measured HX rates,60 consistent with what we observe for MT. At first sight, this result therefore suggests that the unfolding of the MT domain is highly cooperative. Frequently, P is interpreted as an apparent difference in free energy, ΔGi, between the H-bonded and open, HX-prone state of H-bond i: ΔGi = RT ln(P). The apparent activation energy for OH– catalyzed HX, as applies at the near neutral pH used in our study, corresponds to 71 kJ/mol,59 and is responsible for the ratio of 2.5 in intrinsic HX rate, that is, those not involved in intramolecular H-bonds. The 4.5/2.5 = 1.8-fold larger ratio yields a total activation energy of 113 kJ/mol, which represents the sum of the activation energies for breaking the H-bonds plus intrinsic HX, or an activation energy of ca. 42 kJ/mol for generating the exchangeable, non-H-bonded state. This activation energy for unfolding is comparable to what is seen for several small proteins, and together with the observation that the temperature dependence of the H-bond opening is highly uniform indeed could point to a high degree of cooperativity in the folding of the SAH domain.
However, the observation that the HX rates scale with temperature in a uniform manner across nearly the entire SAH region of the MT domain does not mean that opposite ends of the SAH region are directly coupled in the transient unfolding process that enables HX. Considering that the sequence is relatively uniform in its composition, one might expect relatively homogeneous behavior of the temperature dependence of backbone amide exchange. On the other hand, the absence of significant variations on a smaller scale, where sequence composition differences are much more pronounced (Figure 1A), suggests that, at a minimum on this smaller length scale, there is a substantial degree of cooperativity in the unfolding of such regions.
Persistence Length from Paramagnetically Induced RDCs
A key question in the functioning of the myosin-VI MT focuses on a quantitative understanding of whether this domain has sufficient stiffness to function as a lever arm extension. For this purpose, it is important to have an unambiguous measurement of its persistence length, LP. By treating an SAH domain as a worm-like chain, comparisons between observed and predicted small-angle X-ray scattering (SAXS) patterns have been used to provide experimental bounds on LP. However, such measurements are also impacted by the structural model used for the SAH domain, which in some cases included significant kinks.9 Interpretation of SAXS data in terms of a LP value becomes more unambiguous once the contour length of the helix (ca. 1.5 × N Å, where N is the number of residues in the helix) is larger than LP, a condition that does not apply for myosin-VI MT. SAXS measurements on the much longer Kelch SAH domain (196 residues) yielded a definitive LP = 150 Å for this domain, a value consistent with the conclusion of a relatively rigid MT domain in myosin-VI, drawn from optical trapping experiments.21 However, we note that there are considerable deviations from the canonical ER/K sequence pattern near the midpoint of the Kelch SAH domain, which could reduce its stiffness relative to myosin-VI MT. We therefore set out to provide a more direct measurement of the LP of MT by measurement of its RDCs under paramagnetically induced alignment.
As first demonstrated by Bertini and co-workers for calmodulin,27 very weak magnetic alignment of one part of a molecule, introduced by a tightly bound paramagnetic lanthanide ion with a substantial magnetic susceptibility anisotropy, will transfer to other parts of a molecule if rigidly linked, but in an attenuated manner if the linker is flexible. This approach represents a uniquely quantitative, nonperturbing method for measuring both the average orientation and the degree to which a remote domain is ordered relative to the domain that is directly aligned by the paramagnetic ion.
In our study, we used the DOTA-M8 tag introduced by Haussinger and co-workers,26 which very tightly chelates lanthanide ions and can be conveniently attached to any surface-exposed cysteine. For MT, which lacks native cysteines, we chose residue I13 for mutation to cysteine, thereby minimally impacting the salt-bridges that stabilize the SAH domain, while causing the strongest alignment to be close to one end of the helix. Importantly, the 1H and 15N chemical shifts for residues more than two turns of helix away from the I13C mutation site are not affected by the sequence change (Figure S7). Even the chemical shift perturbations for residues directly contacting the mutation site (i ± 1, i – 3, i + 4) are modest in size, indicating that the mutation leaves the helical structure intact. When tagging with the paramagnetic Tm lanthanide ion, strong paramagnetic relaxation broadening of protons within ca. 15 Å of the lanthanide ion makes them unobservable in TROSY-HSQC spectra. However, residues starting from R24 and beyond are sufficiently intense that 1H–15N RDCs can be reliably measured (Figure 8A).
Figure 8.

Analysis of 1DNH RDCs, collected at 900 MHz for I13C MT, aligned by the DOTA-M8-Tm tag,26 attached to Cys-13. (A) RDCs collected at 20 (blue) and 35 °C (red). Amides of residues Q3–R23 could not be observed due to paramagnetic broadening. The superimposed sinusoids correspond to the dipolar wave pattern42 expected for an idealized α-helix, multiplied by a decaying exponential function with a decay constant of 49.75 (blue) or 36.63 (red) residues. (B) Local alignment strength (Da) as a function of residue number, N. Alignment tensor values, extrapolated to Cys-13, are listed in Table S8. Exponential fits to the decreasing Da values (solid lines) yield persistence lengths of 149 and 110 residues at 20 and 35 °C, respectively. Da values that are not used for the exponential fits are plotted as open circles; fitted exponential curves are 23.06 × exp[(−(i – 13)/49.75] Hz and 17.54 × exp[(−(i – 13)/36.63] Hz, where i is the residue number, and fitted rmsd errors are 0.8 and 0.9 Hz at 20 and 35 °C, respectively.
For calculating the relation between persistence length and the degree of alignment, as reflected in the magnitude of the local alignment tensor, we follow Spudich and co-workers and consider the SAH domain to be a worm-like chain.21 In this model, the angle βn of the helical axis at the position of residue n randomly deviates from its orientation at n = 0, and follows the equation:
| 1 |
where LP is the persistence length in units of helical rise per residue (∼1.5 Å). RDCs between nuclei i and j in a rigid molecule are described by61
| 2 |
where rij is the distance between i and j, Da is the strength of the alignment, R is its rhombicity, and θ and φ are the polar angles of the i–j vector in a frame where the alignment tensor is diagonalized. As shown in the Supporting Information, dynamic disorder such as found in a worm-like chain model causes scaling of the RDCs at position n with ⟨P2(cos(βn))⟩, where P2(x) is the second-order Legendre polynomial:
| 3 |
For diffusive motion around a symmetry axis, such as applies to the worm-like chain, only the Da term in eq 2 is impacted and scales with ⟨P2(cos(βn))⟩. The decrease in apparent Da,n as a function of residue position, n, in the MT domain (Figure 8B) is then derived from the paramagnetic 1DNH(n) of residue n, by the scale factor needed to match it to the value predicted by an alignment tensor whose Da and R values are obtained from a singular value decomposition (SVD) fit61 to the paramagnetic 1DNH RDCs measured for residues R24–E45 of the MT structure. As described above, this MT structure was determined from RDCs measured in Pf1 alignment medium. The result of the SVD fit of the paramagnetic RDCs then represents a first-order approximation for the average paramagnetic alignment of R24–E45, neglecting the effect of differential motional averaging of the RDCs across the segment. The paramagnetic RDCs deviate substantially from those measured in Pf1, as exemplified by the large dipolar wave amplitude (Figure 8A), but fit fairly well to the structure derived from RDCs measured in Pf1 (Figure 9A), even while ignoring the increased orientational spread when moving away from the paramagnetic tagging site.
The decrease in alignment strength when moving away from the paramagnetic tagging site corresponds to ⟨P2(cos(βn))⟩, and a fit of these data to a monoexponential function then yields the persistence length, LP = 150 ± 7 residues, or 224 ± 10 Å, at 20 °C, and LP = 110 ± 6 residues, or 165 ± 9 Å, at 35 °C (Figure 8B). When upscaling the experimental paramagnetic RDCs by the inverse of this exponentially decaying function, their SVD fit to the MT structure is remarkably good, all the way to residue R64 (Figure S8B). When viewing the time averaged structure, R64 therefore may be considered the last residue of the SAH domain, even while measurements of HX rates and 15N relaxation indicate an increased degree of transient H-bond opening and rapid internal motion when approaching this end of the helix.
Concluding Remarks
Prior work has provided compelling evidence for the pivotal role of ionic interactions between the side chains of Glu residues with those of Arg and Lys, which group in patterns of roughly four like-charged residues in SAH domains.1,62 A very recent NMR study of the SAH domain of murine myosin-VIIA highlights the dynamic character of such ion pair interactions, adding a substantial favorable entropic component to the remarkable stability of SAH domains, and explaining the difficulty in obtaining high-resolution X-ray structural information, in particular for their side chains.11 Our study extends and complements that work by providing the high-resolution backbone structure of an SAH domain, unconstrained by lattice packing forces or long-range intramolecular interactions, and globally defined by RDCs. The latter is critical as the absence of long-range NOEs and the strictly local information contained in chemical shifts result in the accumulation of uncertainty regarding the global structure of an SAH domain. Our results differ somewhat from the previous analysis of SAXS data of the myosin-VI MT domain, which suggested the presence of two oblique but distinct kinks in its SAH domain.22 However, it has also been noted that the presence of such kinks is difficult to distinguish from random deviations in a straight helix by SAXS data, and that SAXS data can only become an unambiguous reporter for the persistence length when the helix length becomes comparable to or larger than LP, a situation where dynamic bending significantly impacts the end-to-end distance of such helices.21 By collecting three different types of backbone RDCs, we were able to unambiguously evaluate the structural features of MT. Remarkably, after correcting the RDCs for the increased amplitude of backbone dynamics by amounts derived from 15N relaxation, the data fit remarkably well to an idealized, perfectly straight α-helix. The Q-factor, which provides a quantitative measure for the quality of the fit, then equals 15.6%, that compares favorably to what is typically seen when fitting RDCs to high-resolution X-ray structures. For example, fits of the same three types of backbone couplings to the 1.8 Å X-ray structure of ubiquitin yielded Q ≈ 18%, which dropped to 12% when fitting the RDCs to a set of 15 independently determined ubiquitin X-ray structures, each solved at a resolution ≤1.8 Å.58 Refinement of the MT domain by using the experimental RDCs, corrected for 15N dynamics, reduces the cross-validated free Q factor to 12.9% (Table S3). This observation confirms that, although deviations from a straight, idealized α-helix are detectable in the MT SAH domain, the magnitude of these deviations is remarkably small (Figure 5D).
In our study, we adopted the traditional, sequential mode of studying the structure and dynamics of MT. In principle, carrying out the two types of analyses simultaneously could be advantageous.57,63−65 However, it then becomes difficult to separate uncertainty in structure from uncertainty in dynamics, which in some cases has led to widely divergent conclusions, even for a simple model system.45,58 For MT, the exceptional high quality of the RDC fit to the coordinates of an idealized helix validated the accuracy of its local structure, then enabling the study of its motional characteristics in a subsequent step.
As implied by the virtual absence of chemical shift changes between pH 6.3 and 7.8 (Figure S3C), the structure is essentially independent of pH over this range. Base-catalyzed HX at pH 8.9 is found to scale relative to pH 7.8 approximately linearly with [OH–] (Table S6), and chemical shifts remain minimally impacted, suggesting that the structure and stability of MT extends well into this basic range. The RDCs measured for the paramagnetically aligned MT domain at pH 6.3 and 7.0 are indistinguishable within experimental uncertainty (Figure S9), indicating that the persistence length is also not measurably impacted by pH at near physiological values.
Previously, the gradual nature of the melting of an SAH domain upon increasing temperature, as observed by CD spectroscopy, has been interpreted as evidence for noncooperative unfolding of SAH domains,9 consistent with the spring-like behavior seen in single-molecule pulling experiments.6 While the highly uniform temperature dependence of our hydrogen exchange data at first sight seems to be at odds with these prior interpretations, we note that for the SAH domain of myosin-VI, the hydrogen exchange data can only be interpreted as indicative of local cooperativity: The average sequence composition varies very little along the MT sequence, and the absence of a difference in temperature dependence of the HX-rates of, for example, the N-terminal quarter of the SAH domain relative to the C-terminal quarter does not mean that these well-separated regions unfold cooperatively. However, the virtual absence of local variation in the temperature dependence of the HX rates, even at locations where the ER/K pattern is disrupted by alternate residue types, implies that, locally, the backbone H-bonding is highly cooperative, even more so than is seen in regular non-SAH α-helices.66,67 This result appears consistent with a minimum-length requirement of ca. 16 residues for the formation of SAH helices seen in the early synthetic peptide work of Kallenbach and co-workers.7 In this respect, it is interesting to note that the local parameters for secondary structure, including 3JHNHα, Δδ13Cα, and the HX rates, show evidence of decreased helicity starting at residue R58, whereas the RDC-refined structure indicates that, on average, the helix continues for nearly two full turns beyond this point. This result suggests that the absence of helical residues beyond E64 impacts the H-bond stability several turns earlier in the helix.
Use of the paramagnetic tagging to magnetically align one end of the MT domain while observing the decrease in alignment when moving away from the tagging site provides a uniquely sensitive method for measuring the persistence length of the SAH domain in a very benign manner. The magnetic alignment forces, exerted by the paramagnetic tag, are 3 orders of magnitude weaker than kT and therefore can be considered nonperturbing. The high precision at which the strength of local alignment can be measured from RDCs provides a unique and highly sensitive probe for detection of the local ordering as a function of distance from the tagging site. Our measurements for MT yielded a persistence length, LP = 224 ± 10 Å, that is ca. 50% longer than that reported for the 196-residue Kelch SAH domain.21 However, considering that this latter domain contains substantial deviations from the canonical ER/K motif, this moderate difference in persistence length is perhaps not surprising.
As noted by Spudich and others,1,3,15,21,68 SAH domains are ideally suited to function as rods for designing proteins with optimized interdomain spacing. An alternate application could be their use as flexible springs, linking two sites of a molecule or molecular complex and thereby creating a physical force.69,70 If the two SAH termini were connected by intrinsically unfolded peptide sequences to two sites on a target protein, the entropic component of partially ordering these linkers also would serve as a mechanical force.71 The size of SAH helices is sufficiently small that adding such elements to a protein or protein complex will not be prohibitive for recording high-quality NMR spectra, thereby enabling the study of mechanical strain induced in a system at atomic resolution by isotropic solution NMR spectroscopy. Such experiments can provide an atomic resolution complement to single molecule pulling experiments and are currently being explored in our laboratory.
Acknowledgments
We thank J. L. Baber, for technical support, John Lloyd and the NIDDK Core Facility as well as Duck-Yeon Lee and the NHLBI Biochemistry Core Facility for mass spectrometry, Dr. Daniel Haussinger for his generous gift of the DOTA-M8-Spy lanthanide tags, and G. Marius Clore, Attila Szabo, Charles Schwieters, and Robert Best for valuable discussions. This work was supported by the Intramural Research Program of the National Institute of Diabetes and Digestive and Kidney Diseases.
Supporting Information Available
The Supporting Information is available free of charge on the ACS Publications website at DOI: 10.1021/jacs.9b03116.
Relaxation analysis, structure calculations, and additional data (PDF)
The authors declare no competing financial interest.
Supplementary Material
References
- Swanson C. J.; Sivaramakrishnan S. Harnessing the Unique Structural Properties of Isolated alpha-Helices. J. Biol. Chem. 2014, 289 (37), 25460–25467. 10.1074/jbc.R114.583906. [DOI] [PMC free article] [PubMed] [Google Scholar]
- Knight P. J.; Thirumurugan K.; Xu Y. H.; Wang F.; Kalverda A. P.; Stafford W. F.; Sellers J. R.; Peckham M. The predicted coiled-coil domain of myosin 10 forms a novel elongated domain that lengthens the head. J. Biol. Chem. 2005, 280 (41), 34702–34708. 10.1074/jbc.M504887200. [DOI] [PubMed] [Google Scholar]
- Peckham M.; Knight P. J. When a predicted coiled coil is really a single alpha-helix, in myosins and other proteins. Soft Matter 2009, 5, 2493–2503. 10.1039/b822339d. [DOI] [Google Scholar]
- Suveges D.; Gaspari Z.; Toth G.; Nyitray L. Charged single alpha-helix: A versatile protein structural motif. Proteins: Struct., Funct., Genet. 2009, 74 (4), 905–916. 10.1002/prot.22183. [DOI] [PubMed] [Google Scholar]
- Zagrovic B.; Jayachandran G.; Millett I. S.; Doniach S.; Pande V. S. How large is an alpha-helix? Studies of the radii of gyration of helical peptides by small-angle X-ray scattering and molecular dynamics. J. Mol. Biol. 2005, 353 (2), 232–241. 10.1016/j.jmb.2005.08.053. [DOI] [PubMed] [Google Scholar]
- Wolny M.; Batchelor M.; Knight P. J.; Paci E.; Dougan L.; Peckham M. Stable Single alpha-Helices Are Constant Force Springs in Proteins. J. Biol. Chem. 2014, 289 (40), 27825–27835. 10.1074/jbc.M114.585679. [DOI] [PMC free article] [PubMed] [Google Scholar]
- Lyu P. C. C.; Gans P. J.; Kallenbach N. R. Energetic contribution of solvent-exposed ion-pairs to alpha-helix structure. J. Mol. Biol. 1992, 223 (1), 343–350. 10.1016/0022-2836(92)90735-3. [DOI] [PubMed] [Google Scholar]
- Wang C. L. A.; Chalovich J. M.; Graceffa P.; Lu R. C.; Mabuchi K.; Stafford W. F. A long helix from the central region of smooth-muscle caldesmon. J. Biol. Chem. 1991, 266, 13958–13963. [PMC free article] [PubMed] [Google Scholar]
- Spink B. J.; Sivaramakrishnan S.; Lipfert J.; Doniach S.; Spudich J. A. Long single alpha-helical tail domains bridge the gap between structure and function of myosin VI. Nat. Struct. Mol. Biol. 2008, 15 (6), 591–597. 10.1038/nsmb.1429. [DOI] [PMC free article] [PubMed] [Google Scholar]
- Li J. C.; Chen Y. Y.; Deng Y. S.; Unarta I. C.; Lu Q.; Huang X. H.; Zhang M. J. Ca (2+)-Induced Rigidity Change of the Myosin VIIa IQ Motif-Single alpha Helix Lever Arm Extension. Structure 2017, 25 (4), 579–591. 10.1016/j.str.2017.02.002. [DOI] [PubMed] [Google Scholar]
- Batchelor M.; Wolny M.; Baker E. G.; Paci E.; Kalverda A. P.; Peckham M. Dynamic ion pair behavior stabilizes single alpha helices in proteins. J. Biol. Chem. 2019, 294 (9), 3219–3234. 10.1074/jbc.RA118.006752. [DOI] [PMC free article] [PubMed] [Google Scholar]
- Sun Y. J.; Goldman Y. E. Lever-Arm Mechanics of Processive Myosins. Biophys. J. 2011, 101 (1), 1–11. 10.1016/j.bpj.2011.05.026. [DOI] [PMC free article] [PubMed] [Google Scholar]
- Ulrich A. K. C.; Seeger M.; Schutze T.; Bartlick N.; Wahl M. C. Scaffolding in the Spliceosome via Single alpha Helices. Structure 2016, 24 (11), 1972–1983. 10.1016/j.str.2016.09.007. [DOI] [PubMed] [Google Scholar]
- Baboolal T. G.; Sakamoto T.; Forgacs E.; White H. D.; Jackson S. M.; Takagi Y.; Farrow R. E.; Molloy J. E.; Knight P. J.; Sellers J. R.; Peckham M. The SAH domain extends the functional length of the myosin lever. Proc. Natl. Acad. Sci. U. S. A. 2009, 106 (52), 22193–22198. 10.1073/pnas.0909851106. [DOI] [PMC free article] [PubMed] [Google Scholar]
- Sivaramakrishnan S.; Spudich J. A. Systematic control of protein interaction using a modular ER/K alpha-helix linker. Proc. Natl. Acad. Sci. U. S. A. 2011, 108 (51), 20467–20472. 10.1073/pnas.1116066108. [DOI] [PMC free article] [PubMed] [Google Scholar]
- Ritt M.; Guan J. L.; Sivaramakrishnan S. Visualizing and Manipulating Focal Adhesion Kinase Regulation in Live Cells. J. Biol. Chem. 2013, 288 (13), 8875–8886. 10.1074/jbc.M112.421164. [DOI] [PMC free article] [PubMed] [Google Scholar]
- Swanson C. J.; Ritt M.; Wang W.; Lang M. J.; Narayan A.; Tesmer J. J.; Westfall M.; Sivaramakrishnan S. Conserved Modular Domains Team up to Latch-open Active Protein Kinase C alpha. J. Biol. Chem. 2014, 289 (25), 17812–17829. 10.1074/jbc.M113.534750. [DOI] [PMC free article] [PubMed] [Google Scholar]
- Zhou X. X.; Chung H. K.; Lam A. J.; Lin M. Z. Optical Control of Protein Activity by Fluorescent Protein Domains. Science 2012, 338 (6108), 810–814. 10.1126/science.1226854. [DOI] [PMC free article] [PubMed] [Google Scholar]
- Kretsinger R. H.; Rudnick S. E.; Weissman L. J. Crystal structure of calmodulin. J. Inorg. Biochem. 1986, 28 (2–3), 289–302. 10.1016/0162-0134(86)80093-9. [DOI] [PubMed] [Google Scholar]
- Barbato G.; Ikura M.; Kay L. E.; Pastor R. W.; Bax A. Backbone dynamics of calmodulin studied by 15N relaxation using inverse detected two-dimensional NMR spectroscopy: the central helix is flexible. Biochemistry 1992, 31 (23), 5269–5278. 10.1021/bi00138a005. [DOI] [PubMed] [Google Scholar]
- Sivaramakrishnan S.; Sung J.; Ali M.; Doniach S.; Flyvbjerg H.; Spudich J. A. Combining Single-Molecule Optical Trapping and Small-Angle X-Ray Scattering Measurements to Compute the Persistence Length of a Protein ER/K alpha-Helix. Biophys. J. 2009, 97 (11), 2993–2999. 10.1016/j.bpj.2009.09.009. [DOI] [PMC free article] [PubMed] [Google Scholar]
- Sivaramakrishnan S.; Spink B. J.; Sim A. Y. L.; Doniach S.; Spudich J. A. Dynamic charge interactions create surprising rigidity in the ER/K alpha-helical protein motif. Proc. Natl. Acad. Sci. U. S. A. 2008, 105 (36), 13356–13361. 10.1073/pnas.0806256105. [DOI] [PMC free article] [PubMed] [Google Scholar]
- Pervushin K.; Riek R.; Wider G.; Wuthrich K. Attenuated T2 relaxation by mutual cancellation of dipole- dipole coupling and chemical shift anisotropy indicates an avenue to NMR structures of very large biological macromolecules in solution. Proc. Natl. Acad. Sci. U. S. A. 1997, 94 (23), 12366–12371. 10.1073/pnas.94.23.12366. [DOI] [PMC free article] [PubMed] [Google Scholar]
- Salzmann M.; Wider G.; Pervushin K.; Senn H.; Wuthrich K. TROSY-type triple-resonance experiments for sequential NMR assignments of large proteins. J. Am. Chem. Soc. 1999, 121 (4), 844–848. 10.1021/ja9834226. [DOI] [Google Scholar]
- Englander S. W.; Downer N. W.; Teitelbaum H. Hydrogen-exchange. Annu. Rev. Biochem. 1972, 41, 903–924. 10.1146/annurev.bi.41.070172.004351. [DOI] [PubMed] [Google Scholar]
- Haussinger D.; Huang J. R.; Grzesiek S. DOTA-M8: An Extremely Rigid, High-Affinity Lanthanide Chelating Tag for PCS NMR Spectroscopy. J. Am. Chem. Soc. 2009, 131 (41), 14761–14767. 10.1021/ja903233w. [DOI] [PubMed] [Google Scholar]
- Bertini I.; Del Bianco C.; Gelis I.; Katsaros N.; Luchinat C.; Parigi G.; Peana M.; Provenzani A.; Zoroddu M. A. Experimentally exploring the conformational space sampled by domain reorientation in calmodulin. Proc. Natl. Acad. Sci. U. S. A. 2004, 101 (18), 6841–6846. 10.1073/pnas.0308641101. [DOI] [PMC free article] [PubMed] [Google Scholar]
- Bohm G.; Muhr R.; Jaenicke R. Quantitative analysis of protein far UV circular dichroism spectra by neural networks. Protein Eng., Des. Sel. 1992, 5 (3), 191–195. 10.1093/protein/5.3.191. [DOI] [PubMed] [Google Scholar]
- Mobli M.; Hoch J. C. Nonuniform sampling and non-Fourier signal processing methods in multidimensional NMR. Prog. Nucl. Magn. Reson. Spectrosc. 2014, 83, 21–41. 10.1016/j.pnmrs.2014.09.002. [DOI] [PMC free article] [PubMed] [Google Scholar]
- Ying J.; Delaglio F.; Torchia D. A.; Bax A. Sparse multidimensional iterative lineshape-enhanced (SMILE) reconstruction of both non-uniformly sampled and conventional NMR data. J. Biomol. NMR 2017, 68, 101–118. 10.1007/s10858-016-0072-7. [DOI] [PMC free article] [PubMed] [Google Scholar]
- Delaglio F.; Grzesiek S.; Vuister G. W.; Zhu G.; Pfeifer J.; Bax A. NMRpipe - a multidimensional spectral processing system based on Unix pipes. J. Biomol. NMR 1995, 6 (3), 277–293. 10.1007/BF00197809. [DOI] [PubMed] [Google Scholar]
- Lakomek N. A.; Ying J. F.; Bax A. Measurement of 15N relaxation rates in perdeuterated proteins by TROSY-based methods. J. Biomol. NMR 2012, 53, 209–221. 10.1007/s10858-012-9626-5. [DOI] [PMC free article] [PubMed] [Google Scholar]
- Cavanagh J.; Fairbrother W. J.; Palmer A. G.; Skelton N. J.. Protein NMR Spectroscopy: Principles and Practice; Academic Press: San Diego, CA, 1996; p 587. [Google Scholar]
- Mandel A. M.; Akke M.; Palmer A. G. Backbone Dynamics of Escherichia coli Ribonuclease HI: correlations with Structure nad Function in an Active enzyme. J. Mol. Biol. 1995, 246, 144–163. 10.1006/jmbi.1994.0073. [DOI] [PubMed] [Google Scholar]
- Roche J.; Ying J. F.; Shen Y.; Torchia D. A.; Bax A. ARTSY-J: Convenient and precise measurement of (3)J(HNH alpha) couplings in medium-size proteins from TROSY-HSQC spectra. J. Magn. Reson. 2016, 268, 73–81. 10.1016/j.jmr.2016.05.001. [DOI] [PMC free article] [PubMed] [Google Scholar]
- Fitzkee N. C.; Torchia D. A.; Bax A. Measuring rapid hydrogen exchange in the homodimeric 36 kDa HIV-1 integrase catalytic core domain. Protein Sci. 2011, 20 (3), 500–512. 10.1002/pro.582. [DOI] [PMC free article] [PubMed] [Google Scholar]
- Hansen M. R.; Mueller L.; Pardi A. Tunable alignment of macromolecules by filamentous phage yields dipolar coupling interactions. Nat. Struct. Biol. 1998, 5 (12), 1065–1074. 10.1038/4176. [DOI] [PubMed] [Google Scholar]
- Fitzkee N. C.; Bax A. Facile measurement of H-1-N-15 residual dipolar couplings in larger perdeuterated proteins. J. Biomol. NMR 2010, 48 (2), 65–70. 10.1007/s10858-010-9441-9. [DOI] [PMC free article] [PubMed] [Google Scholar]
- Wang Y. X.; Marquardt J. L.; Wingfield P.; Stahl S. J.; Lee-Huang S.; Torchia D.; Bax A. Simultaneous measurement of H-1-N-15, H-1-C-13’’, and N-15-C-13’’ dipolar couplings in a perdeuterated 30 kDa protein dissolved in a dilute liquid crystalline phase. J. Am. Chem. Soc. 1998, 120 (29), 7385–7386. 10.1021/ja980862o. [DOI] [Google Scholar]
- Rock R. S.; Ramamurthy B.; Dunn A. R.; Beccafico S.; Rami B. R.; Morris C.; Spink B. J.; Franzini-Armstrong C.; Spudich J. A.; Sweeney H. L. A flexible domain is essential for the large step size and processivity of myosin VI. Mol. Cell 2005, 17 (4), 603–609. 10.1016/j.molcel.2005.01.015. [DOI] [PubMed] [Google Scholar]
- Okten Z.; Churchman L. S.; Rock R. S.; Spudich J. A. Myosin VI walks hand-over-hand along actin. Nat. Struct. Mol. Biol. 2004, 11 (9), 884–887. 10.1038/nsmb815. [DOI] [PubMed] [Google Scholar]
- Mesleh M. F.; Opella S. J. Dipolar Waves as NMR maps of helices in proteins. J. Magn. Reson. 2003, 163 (2), 288–299. 10.1016/S1090-7807(03)00119-8. [DOI] [PubMed] [Google Scholar]
- Meiler J.; Prompers J. J.; Peti W.; Griesinger C.; Bruschweiler R. Model-free approach to the dynamic interpretation of residual dipolar couplings in globular proteins. J. Am. Chem. Soc. 2001, 123 (25), 6098–6107. 10.1021/ja010002z. [DOI] [PubMed] [Google Scholar]
- Tolman J. R.; Al-Hashimi H. M.; Kay L. E.; Prestegard J. H. Structural and Dynamic Analysis of Residual Dipolar Coupling Data for Proteins. J. Am. Chem. Soc. 2001, 123, 1416–1424. 10.1021/ja002500y. [DOI] [PubMed] [Google Scholar]
- Lange O. F.; Lakomek N. A.; Fares C.; Schroder G. F.; Walter K. F. A.; Becker S.; Meiler J.; Grubmuller H.; Griesinger C.; de Groot B. L. Recognition dynamics up to microseconds revealed from an RDC-derived ubiquitin ensemble in solution. Science 2008, 320 (5882), 1471–1475. 10.1126/science.1157092. [DOI] [PubMed] [Google Scholar]
- Lipari G.; Szabo A. Model-free approach to the interpretation of nuclear magnetic resonance relaxation in macromolecules. 1. Theory and range of validity. J. Am. Chem. Soc. 1982, 104, 4546–4559. 10.1021/ja00381a009. [DOI] [Google Scholar]
- Grishaev A.; Bax A. An empirical backbone-backbone hydrogen-bonding potential in proteins and its applications to NMR structure refinement and validation. J. Am. Chem. Soc. 2004, 126 (23), 7281–7292. 10.1021/ja0319994. [DOI] [PubMed] [Google Scholar]
- Schwieters C. D.; Kuszewski J. J.; Clore G. M. Using Xplor-NIH for NMR molecular structure determination. Prog. Nucl. Magn. Reson. Spectrosc. 2006, 48 (1), 47–62. 10.1016/j.pnmrs.2005.10.001. [DOI] [PubMed] [Google Scholar]
- Clore G. M.; Garrett D. S. R-factor, free R, and complete cross-validation for dipolar coupling refinement of NMR structures. J. Am. Chem. Soc. 1999, 121 (39), 9008–9012. 10.1021/ja991789k. [DOI] [Google Scholar]
- Schurr J. M.; Babcock H. P.; Fujimoto B. S. A Test of the Model-Free Formulas - Effects of Anisotropic Rotational Diffusion and Dimerization. J. Magn. Reson., Ser. B 1994, 105 (3), 211–224. 10.1006/jmrb.1994.1127. [DOI] [PubMed] [Google Scholar]
- Tjandra N.; Feller S. E.; Pastor R. W.; Bax A. Rotational diffusion anisotropy of human ubiquitin from N-15 NMR relaxation. J. Am. Chem. Soc. 1995, 117 (50), 12562–12566. 10.1021/ja00155a020. [DOI] [Google Scholar]
- Halle B.; Davidovic M. Biomolecular hydration: From water dynamics to hydrodynamics. Proc. Natl. Acad. Sci. U. S. A. 2003, 100 (21), 12135–12140. 10.1073/pnas.2033320100. [DOI] [PMC free article] [PubMed] [Google Scholar]
- Garcia de la Torre P.; Bloomfield V. A. Hydrodynamic properties of complex, rigid biological macromolecules. Theory and applications. Q. Rev. Biophys. 1981, 14, 81–139. 10.1017/S0033583500002080. [DOI] [PubMed] [Google Scholar]
- Fushman D.; Ghose R.; Cowburn D. The effect of finite sampling on the determination of orientational properties: A theoretical treatment with application to interatomic vectors in proteins. J. Am. Chem. Soc. 2000, 122 (43), 10640–10649. 10.1021/ja001128j. [DOI] [Google Scholar]
- Tirado M. M.; Garciadelatorre J. Rotational-Dynamics of Rigid, Symmetric Top Macromolecules - Application to Circular-Cylinders. J. Chem. Phys. 1980, 73 (4), 1986–1993. 10.1063/1.440288. [DOI] [Google Scholar]
- Vogeli B. The nuclear Overhauser effect from a quantitative perspective. Prog. Nucl. Magn. Reson. Spectrosc. 2014, 78, 1–46. 10.1016/j.pnmrs.2013.11.001. [DOI] [PubMed] [Google Scholar]
- Vogeli B.; Kazemi S.; Guntert P.; Riek R. Spatial elucidation of motion in proteins by ensemble-based structure calculation using exact NOEs. Nat. Struct. Mol. Biol. 2012, 19 (10), 1053–1058. 10.1038/nsmb.2355. [DOI] [PubMed] [Google Scholar]
- Maltsev A. S.; Grishaev A.; Roche J.; Zasloff M.; Bax A. Improved Cross Validation of a Static Ubiquitin Structure Derived from High Precision Residual Dipolar Couplings Measured in a Drug-Based Liquid Crystalline Phase. J. Am. Chem. Soc. 2014, 136 (10), 3752–3755. 10.1021/ja4132642. [DOI] [PMC free article] [PubMed] [Google Scholar]
- Bai Y.; Milne J. S.; Englander S. W. Primary structure effects on peptide group exchange. Proteins: Struct., Funct., Genet. 1993, 17, 75–86. 10.1002/prot.340170110. [DOI] [PMC free article] [PubMed] [Google Scholar]
- Bai Y. W.; Englander S. W. Future directions in folding: The multi-state nature of protein structure. Proteins: Struct., Funct., Genet. 1996, 24 (2), 145–151. . [DOI] [PubMed] [Google Scholar]
- Prestegard J. H.; Bougault C. M.; Kishore A. I. Residual dipolar couplings in structure determination of biomolecules. Chem. Rev. 2004, 104 (8), 3519–3540. 10.1021/cr030419i. [DOI] [PubMed] [Google Scholar]
- Wolny M.; Batchelor M.; Bartlett G. J.; Baker E. G.; Kurzawa M.; Knight P. J.; Dougan L.; Woolfson D. N.; Paci E.; Peckham M. Characterization of long and stable de novo single alpha-helix domains provides novel insight into their stability. Sci. Rep. 2017, 7, 1. 10.1038/srep44341. [DOI] [PMC free article] [PubMed] [Google Scholar]
- Lindorff-Larsen K.; Best R. B.; DePristo M. A.; Dobson C. M.; Vendruscolo M. Simultaneous determination of protein structure and dynamics. Nature 2005, 433 (7022), 128–132. 10.1038/nature03199. [DOI] [PubMed] [Google Scholar]
- Clore G. M.; Schwieters C. D. Concordance of residual dipolar couplings, backbone order parameters and crystallographic B-factors for a small alpha/beta protein: A unified picture of high probability, fast atomic motions in proteins. J. Mol. Biol. 2006, 355 (5), 879–886. 10.1016/j.jmb.2005.11.042. [DOI] [PubMed] [Google Scholar]
- Bouvignies G.; Markwick P. R. L.; Blackledge M. Simultaneous definition of high resolution protein structure and backbone conformational dynamics using NMR residual dipolar couplings. ChemPhysChem 2007, 8 (13), 1901–1909. 10.1002/cphc.200700353. [DOI] [PubMed] [Google Scholar]
- Wieczorek R.; Dannenberg J. J. H-bonding cooperativity and energetics of alpha-helix formation of five 17-amino acid peptides. J. Am. Chem. Soc. 2003, 125 (27), 8124–8129. 10.1021/ja035302q. [DOI] [PubMed] [Google Scholar]
- Li J.; Wang Y.; Chen J.; Liu Z.; Bax A.; Yao L. Observation of alpha-Helical Hydrogen-Bond Cooperativity in an Intact Protein. J. Am. Chem. Soc. 2016, 138 (6), 1824–1827. 10.1021/jacs.5b13140. [DOI] [PMC free article] [PubMed] [Google Scholar]
- Arai R.; Ueda H.; Kitayama A.; Kamiya N.; Nagamune T. Design of the linkers which effectively separate domains of a bifunctional fusion protein. Protein Eng., Des. Sel. 2001, 14 (8), 529–532. 10.1093/protein/14.8.529. [DOI] [PubMed] [Google Scholar]
- Zocchi G. Controlling proteins through molecular springs. Annu. Rev. Biophys. 2009, 38, 75–88. 10.1146/annurev.biophys.050708.133637. [DOI] [PubMed] [Google Scholar]
- Choi B.; Zocchi G.; Wu Y.; Chan S.; Perry L. J. Allosteric control through mechanical tension. Phys. Rev. Lett. 2005, 95 (7), 1. 10.1103/PhysRevLett.95.078102. [DOI] [PubMed] [Google Scholar]
- Keul N. D.; Oruganty K.; Bergman E. T. S.; Beattie N. R.; McDonald W. E.; Kadirvelraj R.; Gross M. L.; Phillips R. S.; Harvey S. C.; Wood Z. A. The entropic force generated by intrinsically disordered segments tunes protein function. Nature 2018, 563 (7732), 584–588. 10.1038/s41586-018-0699-5. [DOI] [PMC free article] [PubMed] [Google Scholar]
- Kay L. E.; Keifer P.; Saarinen T. Pure Absorption Gradient Enhanced Heteronuclear Single Quantum Correlation Spectroscopy with Improved Sensitivity. J. Am. Chem. Soc. 1992, 114, 10663–10665. 10.1021/ja00052a088. [DOI] [Google Scholar]
- Kjaergaard M.; Poulsen F. M. Sequence correction of random coil chemical shifts: correlation between neighbor correction factors and changes in the Ramachandran distribution. J. Biomol. NMR 2011, 50 (2), 157–165. 10.1007/s10858-011-9508-2. [DOI] [PubMed] [Google Scholar]
- Maltsev A. S.; Ying J. F.; Bax A. Deuterium isotope shifts for backbone 1H, 15N and 13C nuclei in intrinsically disordered protein alpha-synuclein. J. Biomol. NMR 2012, 54, 181–191. 10.1007/s10858-012-9666-x. [DOI] [PMC free article] [PubMed] [Google Scholar]
- Ottiger M.; Bax A. Determination of relative N-H-N N-C’’, C-alpha-C’’, and C(alpha)-H-alpha effective bond lengths in a protein by NMR in a dilute liquid crystalline phase. J. Am. Chem. Soc. 1998, 120 (47), 12334–12341. 10.1021/ja9826791. [DOI] [Google Scholar]
Associated Data
This section collects any data citations, data availability statements, or supplementary materials included in this article.