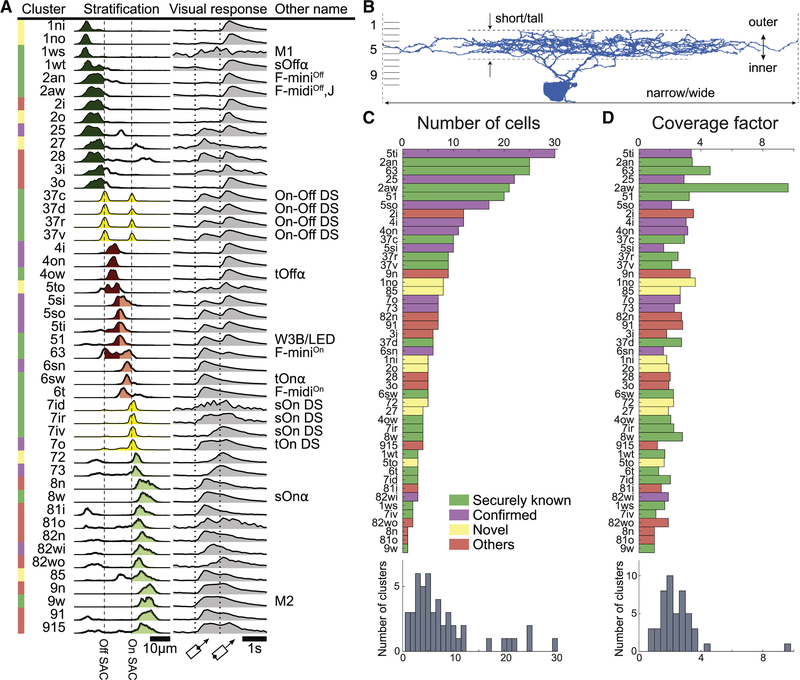
Figure 4: Classification of Ganglion Cells.
(A) Summary of clusters with anatomical name, stratification profile, and temporal response function defined in Fig. 1E. Alternative names in black are “securely known” types (see main text for definition). (B) Each cluster name begins with a number in the range 1–9 indicating which tenth of the IPL depth contains the most stratification profile area. More numbers are appended for multistratified clusters. Letters (s, t, n, w, o, i, a) are added to distinguish between clusters with similar stratification, where “a” denotes asymmetric arbor. (C) Number of cells in each cluster. (D) Coverage factors. See also Figures S2, S3, S4, S5, and S6.

