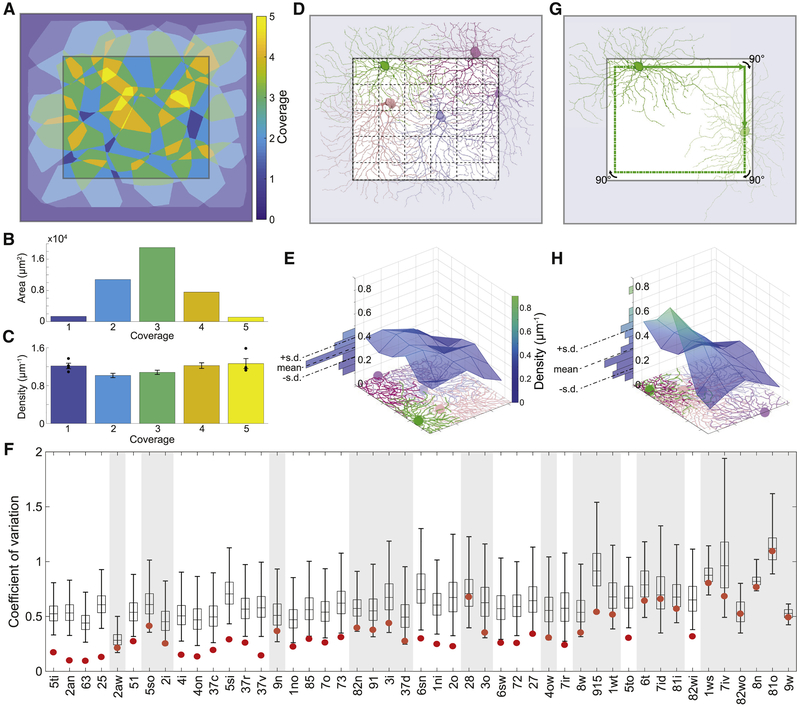
Figure 5: According to Our Density Conservation Principle, the Arbors of a GC Type Should Have an Aggregate Density that is Approximately Uniform.
(A) Arbor convex hulls of an example cluster (25) overlap substantially. Colors indicate how many hulls cover each retinal location inside the crop region. (B) Retinal area versus coverage inside the crop region. Each bar represents the area devoted to the corresponding color/coverage in the crop region. (C) The aggregate arbor density of the cluster varies relatively little with coverage. Each bar represents the density within the area devoted to the corresponding color/coverage in the crop region (standard error, n = 4, 19, 33, 20, 4). (D) The crop region is divided into grid boxes, and the aggregate arbor density is computed for each box, as illustrated for an example cluster (6sw). (E) The aggregate arbor density is close to uniform across the crop region, as quantified by the coefficient of variation (standard deviation divided by mean). (F) The density conservation test is satisfied by a cluster (non-shaded) when the coefficient of variation is significantly smaller for the real configuration (red dot) than for 99% of all randomized configurations (99/1 percentiles, black bar; quartiles and median, box; n = 10,000). (G) To test statistical significance, the arbors of a cluster are randomized by relocating the soma somewhere on its “orbit” (green line) and rotating the arbor to have the same orientation relative to the nearest side of the retinal patch. (H) The aggregate arbor density typically varies more after randomization. Example cluster is 25 in A-C and 6sw in D, E, G, H.

