Abstract
Purpose
Noninvasive quantitative assessment of coagulated tissue during high‐intensity focused ultrasound (HIFU) ablation is one of the essential steps for tumor treatment, especially in such cases as the Pancreatic Ductal Adenocarcinoma (PDA) that has low probability of diagnosis at the early stages and high probability of forming solid carcinomas resistant to chemotherapy treatment at the late stages.
Methods
Harmonic motion elastography (HME) is a technique for the localized estimation of tumor stiffness. This harmonic motion imaging (HMI)‐based technique is designed to map the tissue Young's modulus or stiffness noninvasively. A focused ultrasound (FUS) transducer generates an oscillating, acoustic radiation force in its focal region. The two‐dimensional (2D) shear wave speed, and consequently the Young's modulus maps, is generated by tracking the radio frequency (RF) signals acquired at high frame rates. By prolonging the sonication for more than 50 s using the same methodology, the 2D Young's modulus maps are reconstructed while HIFU is applied and ablation is formed on PDA murine tumors.
Results
The feasibility of this technique in measuring the regional Young's modulus was first assessed in tissue‐mimicking phantoms. The contrast‐to‐noise ratio (CNR) was found to be higher than 11.7 dB for each 2D reconstructed Young's modulus map. The mean error in this validation study was found to be equal to less than 19%. Then HME was applied on two transgenic mice with pancreatic ductal adenocarcinoma tumors. The Young's modulus median value of this tumor at the start of the HIFU application was equal to 2.1 kPa while after 45 s of sonication it was found to be approximately three times stiffer (6.7 kPa).
Conclusions
The HME was described herein and showed its capability of measuring tissue stiffness noninvasively by measuring the shear wave speed propagation inside the tissue and reconstructing a 2D Young's modulus map. Application of the methodology in vivo and during HIFU were thus reported here for the first time.
1. Introduction
Ultrasound‐based elastography methods for mechanical evaluation of soft tissues can be categorized into two main groups based on their excitation methods: static and dynamic techniques. These methods have been applied on different tissues to assess their mechanical properties.1 In addition, Magnetic Resonance Elastography (MRE) methods has also been reported on various organs like the brain, liver, heart, and muscle to evaluate their mechanical properties including, in clinical studies in patients.2, 3, 4, 5
Shear wave ultrasound elastography is a type of dynamic elastography, in which the mechanical properties of the tissues can be estimated by using radiation force to introduce shear waves and measuring the shear and Young's moduli by tracking the generated shear waves.6 Based on some general assumptions that soft tissues are incompressible, isotropic and linearly elastic (i.e., ignoring shear wave dispersion), the Young's modulus, E, is related to shear wave propagation speed, , as follows:
| (1) |
where ρ is the density assumed to be 1000 kg/m3 for all soft tissues.6
Different methods have been developed based on this type of excitation such as Shear Wave Elasticity Imaging (SWEI),7, 8 Acoustic Radiation Force Imaging (ARFI),9, 10 Supersonic Shear Imaging (SSI),11 Shear wave Dispersion Ultrasound Vibrometry (SDUV),12 and Comb‐push Ultrasound Shear Elastography (CUSE),13 in which the radiation force and its resulting shear wave is used to evaluate the viscoelastic tissue properties.
Harmonic Motion Imaging (HMI) is an ultrasound‐based elastography technique that uses a focused ultrasound (FUS) transducer to generate an oscillatory radiation force at its focal point. The radiation force can be described by
| (2) |
where F is the radiation force generated (N), is the tissue absorption coefficient (m−1), I is the average acoustic intensity (W m−2), and c is the sound speed (m s−1).
Vappou et al.14 proposed a quantitative method to measure the storage and loss modulus based on shear wave phase velocity estimation. Also, in more recent work by our group,15 the Young's modulus was estimated based on the radiation force and its resulting local axial strain. Moreover, in recent study by Wang et al.16 strain elastography was used to assess the internal tumor pressure.
The aim of this study is to introduce a quantitative HMI‐based method called Harmonic Motion Elastography (HME) to map the Young's modulus using the speed of the shear wave generated by the HMI radiation force. This shear wave‐based method is capable of reconstructing a 2D Young's modulus map based on harmonic motion created by the FUS transducer during either imaging or ablation procedure. It should be noted that although applying HMI and measuring local displacement can assist in the relative local tissue stiffness, a quantitative modulus estimation technique like HME could render it more robust regarding surrounding boundary conditions.
In this paper, we first introduce the HME method and describe the method steps in more detail. Then, a phantom study was conducted for HME method validation. Finally, the HME method is applied to image the Young's modulus changes using an in vivo transgenic mouse model with a PDA tumor and its local Young's modulus alteration during ablation is presented.
2. Materials and methods
2.A. Harmonic motion elastography technique
The setup consists of an imaging transducer located confocally in the middle of the 93‐element, FUS transducer (fc = 4.5 MHz, and D = 70 mm, Sonic Concepts Inc., Bothell WA, USA). The imaging transducer was either a 64‐element phased array imaging probe (fc = 2.5 MHz, P4‐2, ATL/Philips, Bothell, WA, USA) or a 104‐element diagnostic transducer (fc = 7.8 MHz, P12‐5, ATL/Philips, Bothell, WA, USA). The former one was used in phantoms while the latter one in mice. The FUS transducer is driven by an AM sinusoidal signal. A dual‐channel arbitrary waveform generator (AT33522A, Agilent Technologies Inc., Santa Clara, CA, USA) generates this AM signal through a 50‐dB power amplifier (325LA, E&I, Rochester, NY, USA).
The total acoustic power output of the FUS transducer was in the range of 6.4–8.6 W based on radiation force balance measurements.17 The oscillatory motion generated by the FUS transducer is estimated by the channel data acquired by the imaging transducer (Vantage, Verasonics, and Bothell, WA, USA). To reconstruct each RF data frame the acquired channel data matrix is multiplied by the reconstruction sparse matrix and its product matrix is multiplied by another sparse matrix for scan conversion.18
The whole process is implemented in Graphical Processing Unit (GPU).18
During this process, the data are upsampled at either 80 MHz for a 64‐element phased array or 125 MHz for a 104‐element transducer.18 The axial displacements at the focal point are estimated by applying 1D normalized cross correlation on the reconstructed RF data.19 To generate the 2D Young's modulus map, the same HMI displacement data of each point are used. Although it is possible to observe the shear wave propagation of the HMI displacement cine‐loop, a complex field of shear waves is generated due to constructive and destructive interference between forward and reflected shear waves. To extract the shear wave from such a complex field, a directional filter is used to separate the leftward from the rightward shear waves. Because this spatio‐temporal filter is capable of disassembling the generated complex wave field into its components, traveling in various directions.20 The filter was designed in frequency space with the ability of choosing the portion of the wave with certain direction.21 In addition, this filtering method helps in minimizing the standing wave. These advantages contribute considerably in reconstruction of shear modulus of the medium.
The final Young's modulus 2D map is the result of applying this filter on HMI displacement data and using the time‐of‐flight algorithm to measure, the time delay of the shear wave propagation by cross‐correlating the filtered particle displacement profiles along the lateral direction. Then, two points separated by eight and six ultrasound wavelengths, in the phantom and mouse study, respectively, at the same depth, are used to calculate the time that it takes the shear wave to travel between these two points. Then, based on the estimated time delay between these points at known distance, the shear wave speed is measured.13, 22 The measured shear wave is assigned for the center pixel of the grid.22 The 2D shear wave map is generated for each HMI measurement and the final 2D Young's modulus is reconstructed based on that.
2.B. Tissue‐mimicking phantom study
A customized CIRS phantom (Model 049 A) with a cylindrical lesion of 5 mm diameter was used. The Young's modulus for the background and inclusion part in the phantom with the stiffer inclusion was 5 ± 1, and 40 ± 8 kPa, respectively. In the second phantom with a softer inclusion, the Young's modulus of the inclusion was 10 ± 2 kPa and its background Young's modulus is the same as the stiffer phantom, 5 ± 1 kPa.
In this phantom study, the radiation force was applied for 0.6 s using an amplitude‐modulated waveform with acoustic intensity of 1050 W/cm2 and frequency of 25 Hz, resulting in excitation frequency of f = 50 Hz.17, 23 The imaging probe recorded plane waves at 1000 frames/s throughout the force application. We repeated the experiment five times by relocating the CIRS phantoms and changing the probe positions. The relative error based on
| (3) |
where is the Young's modulus of the CIRS phantom and is the Young's modulus measured by HME method.
In addition, the contrast‐to‐noise ratio (CNR) was estimated based on24
| (4) |
where and are the mean Young's modulus of the inclusion and background, respectively; the and are the standard deviation of the Young's modulus of the inclusion and background.
2.C. In vivo ablation experiment on transgenic mice with PDA tumor
The Institutional Animal Care and Use Committee (IACUC) of Columbia University approved all animal studies presented herein. The developed pancreatic tumor in these mice models (K‐rasLSL.G12D/+; p53R172H/+; PdxCre (KPC)) has been proved to be pathophysiologically similar to human pancreatic tumor.25 Before starting the ablation, these KPC mice were abdominally depilated and laid supine on a heat pad under isoflurane anesthesia and covered with ultrasound gel. First, an 18.5‐MHz diagnostic probe (L22‐14v, Verasonics, Bothell, WA, USA) was mounted on a 3D positioner and used to locate the pancreas and its surrounding organs due to its high‐resolution B‐mode image. In order to align the HMI images with high‐resolution B‐mode images, they were spatially registered with the high‐resolution B‐mode image by replacing this L22‐14v transducer with the 104‐element phased array (fc = 7.8 MHz, P12‐5, ATL/Philips, Bothell, WA, USA) without any change in the animal setting. This transducer was used for acquiring the frames while using HME. The FUS transducer was active for more than 60 s during the treatment at the same acoustic power (Fig. 1).
Figure 1.
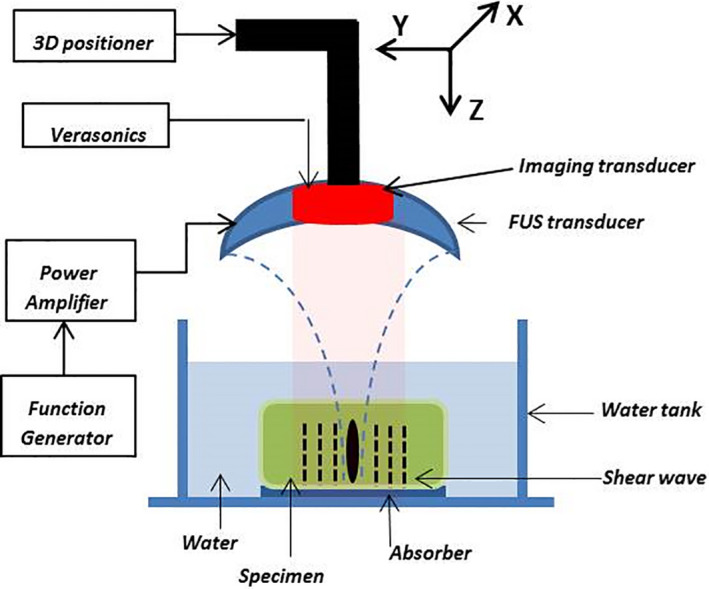
Harmonic motion elastography (HME) setup. [Color figure can be viewed at wileyonlinelibrary.com]
3. Results
3.A. Phantom study
In order to validate the HME methods, two modified CIRS phantoms (Model 049 A) with cylindrical lesion of 5 mm diameter were used. Figure 2 demonstrates the 2D Young's modulus reconstructed maps of these two phantoms using the HME method. The results are shown in Table 1. According to Table 1, the overall, largest, error for the inclusion and background part is under 19% [Eq. (3)].
Figure 2.
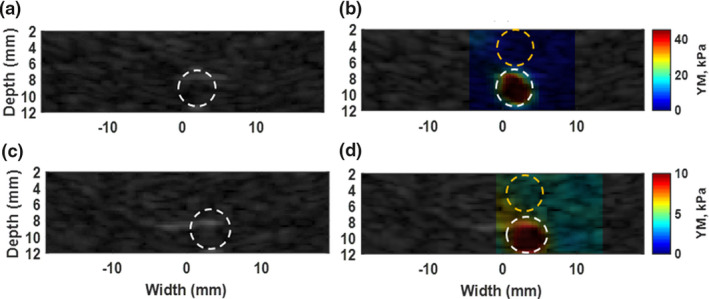
(a) B‐mode image of phantom with stiff inclusion. (b) Overlaid image of reconstructed 2D Young's modulus map on original B‐mode in phantom with a stiff inclusion. The estimated E, for background part specified with dashed yellow circle is 4.8 ± 0.9 kPa. the dashed white circle shows the inclusion part and E = 41.5 ± 9.8 kPa. (c) B‐mode image of phantom with soft inclusion. (d) Overlaid image of reconstructed 2D Young's modulus map on original B‐mode in phantom with a stiff inclusion. The estimated E, for background part specified with dashed yellow circle is 4.3 ± 0.3 kPa. The dashed white circle shows the lesion part and E = 10.1 ± 1 kPa. [Color figure can be viewed at wileyonlinelibrary.com]
Table 1.
Young's modulus, values, and contrast‐to‐noise ratio (CNR) in CIRS phantom with stiffer inclusion
| Trail | Inclusion (Ei) | Background (Eb) | Error, inclusion (%) | Error, background (%) | CNR (dB) |
|---|---|---|---|---|---|
| 1 | 41.5 ± 9.3 | 4.8 ± 0.9 | 4 | 4 | 14.9 |
| 2 | 44.0 ± 10.8 | 4.7 ± 0.8 | 10 | 6 | 14.2 |
| 3 | 32.5 ± 6.5 | 4.7 ± 0.9 | 19 | 6 | 15.5 |
| 4 | 36.8 ± 10.6 | 4.7 ± 0.7 | 8 | 6 | 12.6 |
| 5 | 36.6 ± 11.9 | 4.3 ± 0.3 | 8 | 14 | 11.7 |
| AV | 38.3 ± 9.8 | 4.6 ± 0.7 | 10 | 8 | 13.7 |
AV, average.
In addition, the CNR was higher than 11.7 dB [Eq. (4)]. In the second CIRS phantom, the relative error for both the inclusion and background was less than 10% [Eq. (4)].
3.B. In vivo tumor studies
Figure 3(a) shows the high‐resolution B‐mode image of the pancreatic tumor, which is specified with white dashed oval and its surrounding organs. In this figure, the spleen and kidney are labeled with S and K, respectively. The ablation was performed on this tumor. At the end of the ablation, the resulting 2D absolute peak‐to‐peak displacement map and its corresponding 2D Young's modulus map are shown in part (b) and (c) of this figure, respectively.
Figure 3.

(a) High‐resolution B‐mode image of PDA tumor and surrounding organs using L22‐14V probe. The tumor is specified with a dashed white oval shape. The spleen is labeled as S and kidney as K. (b) 2D absolute peak‐to‐peak displacement map of the pancreatic tumor at the end of HIFU ablation (t = 57 s) with the median value of 6.2 μm. (c) 2D Young's modulus map at the end of HIFU ablation (t = 57 s) with median value of 6.2 kPa for tumor part and 4.4 kPa for surrounded part. [Color figure can be viewed at wileyonlinelibrary.com]
It should be noted the 2D maps shown in Fig. 3 were reconstructed at the end of the high‐intensity focused ultrasound (HIFU) application (after 57 s) in the first mouse study. However, in order to monitor the stiffness changes occurring while performing the HIFU ablation method the resulting 2D Young's modulus map were reconstructed every 9 s during HIFU ablation. The reconstructed 2D Young's modulus overlaid on the B‐mode images is illustrated in Fig. 4.
Figure 4.
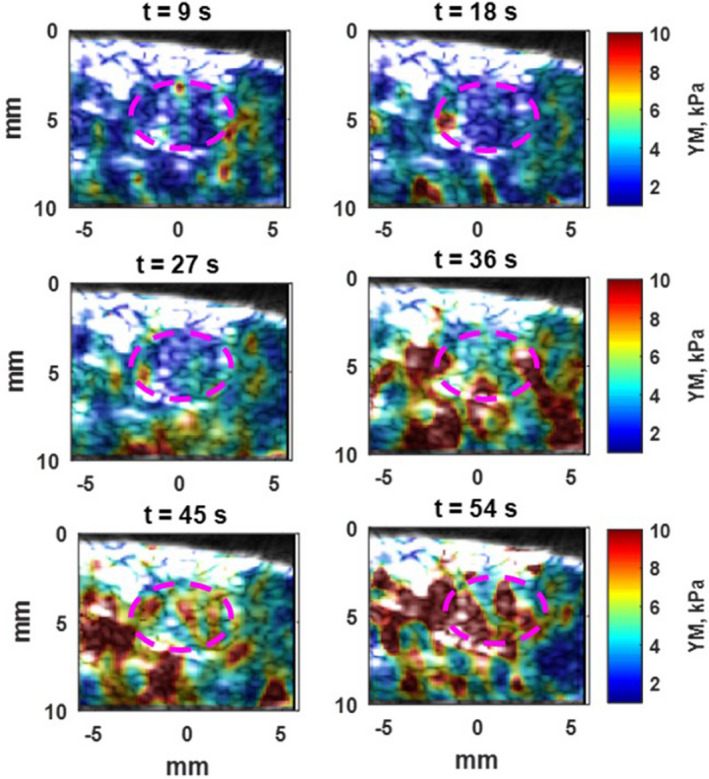
Overlay of 2D Young's modulus map of pancreatic tumor on low‐resolution B‐mode images as it has been in Fig. 3(a) with Purple dashed oval. After 9 s of HIFU ablation, the median Young's modulus is 1.9 kPa and after 54 s, increases to 6.7 kPa. [Color figure can be viewed at wileyonlinelibrary.com]
Moreover, in Figs. 5 and 6, the temporal profile of the whole tumor specified with a red dashed oval contour is demonstrated based on the both absolute peak‐to‐peak displacement and Young's modulus estimation in the first and second in vivo mouse study, respectively.
Figure 5.
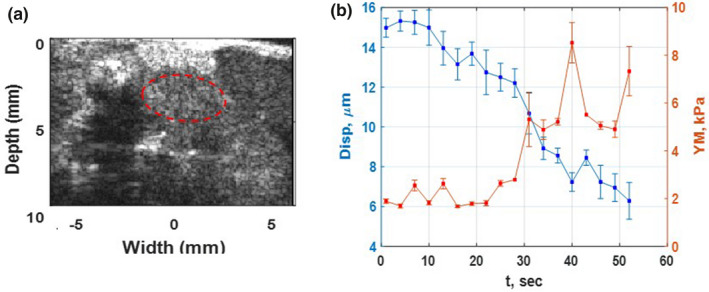
(a) High‐resolution B mode image of PDA Tumor and surrounding organs of the first in vivo mouse study using L 22‐14 V probe. The tumor is specified with a dashed red oval shape. (b) The absolute peak‐to‐peak displacement and Young's modulus temporal profiles of tumor, red dashed oval, in part (a) of this figure during HIFU application for 54 s. [Color figure can be viewed at wileyonlinelibrary.com]
Figure 6.
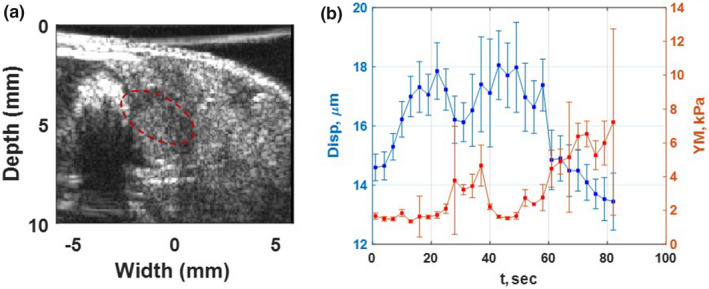
(a) High‐resolution B‐mode image of PDA tumor and surrounded organs of the second in vivo mouse study using L22‐14V probe. The tumor is specified with a dashed red oval shape. (b) The absolute peak‐to‐peak displacement and Young's modulus temporal profiles of tumor, red dashed oval, in part (a) of this figure during HIFU application for 84 s. [Color figure can be viewed at wileyonlinelibrary.com]
In both figures, the absolute peak‐to‐peak displacement and Young's modulus changes are in good agreement. The softer part shows higher displacement and lower Young's modulus while the stiffer areas have lower displacement and higher Young's modulus.
4. Discussion
Ultrasound‐based shear wave elastography methods in which the shear wave speed measurement is used for mechanical evaluation of soft tissues are becoming increasingly widespread due to their ease‐of‐use and ability to provide a quantitative 2D map of mechanical properties.26, 27 Shear waves propagate faster in stiffer homogenous tissues comparing to softer ones.26, 27 This difference in speed can be used to distinguish between normal and abnormal parts in tissue.
Generally, one of the common problems among all shear wave‐based elastography methods is the shear wave attenuation, which generates some artifacts in measuring shear wave speed.13 Using harmonic radiation force at a low frequency, 25 Hz, to generate shear wave can address the attenuation problem.28
The harmonic displacement generated during HMI and also HME application contributes significantly to elevate the signal‐to‐noise ratio (SNR) especially in vivo and deep‐seated organs while attenuation problem poses a formidable challenge for other ultrasonic shear wave methods.8, 9, 10, 11, 12, 13, 27 Using the same FUS transducer to apply a harmonic and continuous radiation force will result in a continuous harmonic displacement. This continuity and harmonic nature of applied radiation force contributes significantly to the increase of the signal‐to‐noise ratio (SNR) especially in vivo and deep‐seated organs while attenuation problems pose a formidable challenge for other ultrasonic shear wave methods.8, 9, 10, 11, 12, 13, 27
Furthermore, the use of a FUS transducer instead of an imaging one for radiation force application has a substantial impact to overcome those limitations28 including when it comes to lateral propagation, the estimation errors increase by propagating away from the perturbation region due to the lack of sufficient displacement.28 In addition, in HME, there is inherent registration between perturbation and the detection images and less concern about damaging the imaging probe because of high power application.
Due to the geometry of the FUS transducer, the resulting focal point is more focused. This characteristic helps to generate waves in all directions symmetrically. Moreover, the cylindrical symmetry of the shear wave front can partially assist in lowering the attenuation effect and increasing the accuracy of the shear modulus and Young's modulus estimation of the medium.29, 30 Also, it should be noted that the measured 2D Young's modulus map in the HME method is completely independent of the magnitude of applied radiation force or consequently the resulted absolute peak‐to‐peak displacement measurement. In this study, we showed that the HME technique could estimate the Young's modulus of the tissue undergoing ablation by measuring the speed of resulting shear wave. In other words, instead of having a transient push, which is very common among the aforementioned ultrasonic shear wave methods because of using the imaging transducer for that purpose, in the HME method, a continuous force is applied separately by a FUS transducer while the RF signal is recorded by the imaging transducer. This combination helps to overcome those limitations.
High‐intensity focused ultrasound be used to generate ablation but also as a source to generate the shear wave and subsequently 2D Young's modulus map.
The displacement and Young's modulus monitoring of in vivo tumor ablation confirms that a progressive softening‐then‐stiffening was indicated by displacement increase‐then‐decrease and Young's modulus decrease‐then‐increase occurred (Figs. 5 and 6). This trend happens not only in the tumor region, almost similar changes occur in background part too as shown in Fig. 4 too.
The results also show a softened region around the lesion boundary (Fig. 3).23, 31, 32 In addition, it should be noted that the speed of sound does not have any effects in displacement measurement in HMI and HME method.33, 34 However, some artifacts are apparent in Figs. 3 and 4 but it is interesting that using two different imaging methods: absolute peak‐to‐peak displacement [Fig. 3(b)] and HME, [Fig. 3(c)] depict similar results.
Furthermore, it is worth mentioning here that in Fig. 3(b), the peak‐to‐peak displacement value was not measured for background part because there was no raster scanning involved and the push was applied only in a single location at the center of the tumor. This is complementary information provided by HME as it is shown in Fig. 3(c); only one push is enough to measure the stiffness of the medium while in the conventional HMI method, raster scanning is necessary for stiffness evaluation of the medium.
Despite all the advantages that have been mentioned so far, in this study, we did not use any thermal assessment of the tissue during HIFU, because the goal was first to illustrate the feasibility of the HME method in reconstructing the 2D map of Young's modulus during the HIFU ablation.
Figure 4 demonstrates the reconstructed 2D maps every 9 s at the onset of HIFU ablation process. Thus, ongoing work mostly focuses on the thermal ablation monitoring using the Young's modulus information during HIFU procedure.
The 2D Young's modulus map resulting from the HME method was validated in phantoms. However, there are some factors involved in generating artifacts, which were apparent in Figs. 3 and 4. Cavitation is a potential candidate. Because the generated bubbles could elevate the local pressure and result in a higher local stiffness.in addition, as Fig. 3 shows the peak‐to‐peak displacement 2D map of tumor in which standing wave has no influence on its result shows the same trend as what has been illustrated in 2D Young's modulus map. Stiffer areas have higher Young's modulus and lower displacement while the softer one has lower Young's modulus and higher displacement. It could be concluded that standing waves might have reduced effects on artifact generation in HME 2D maps.
5. Conclusion
An ultrasonic shear wave‐based technique using HMI was hereby presented. It was demonstrated that this radiation force technique was capable of reconstructing the 2D Young's modulus of the tissue, during and after ablation in vivo.
Shear wave imaging for stiffness estimation is widespread.1 However, the HME method is distinct from other shear wave methodologies in the fact that it uses oscillatory force that can separate motion from breathing and body movement30 as well as engage viscosity estimation.15
Future studies will focus on measuring the Young's modulus in real time and using the Young's modulus for thermal and temperature assessment in in vivo patient studies.
Conflict of interest
The authors have no conflicts to disclose.
Acknowledgments
This work was supported in part by NIH (R01CA228275). The authors acknowledge Stephen A Sastra, and C F Palermo, at the Herbert Irving Comprehensive Cancer Center, Columbia University, for their assistance in the mouse study.
References
- 1. Li GY, Cao Y. Mechanics of ultrasound elastography. Proc R Soc A. 2017;473:20160841. [DOI] [PMC free article] [PubMed] [Google Scholar]
- 2. Muthupillai R, Lomas DJ, Rossman PJ, Greenleaf JF, Manduca A, Ehman RL. Magnetic resonance elastography by direct visualization of propagating acoustic strain waves. Science. 1995;269:1854–1857. [DOI] [PubMed] [Google Scholar]
- 3. Serai SD, Obuchowski NA, Venkatesh SK, et al. Repeatability of MR elastography of liver: a meta‐analysis. Radiology. 2017;285:92–100. [DOI] [PMC free article] [PubMed] [Google Scholar]
- 4. Arani A, Arunachalam SP, Chang ICY, et al. Cardiac MR elastography for quantitative assessment of elevated myocardial stiffness in cardiac amyloidosis. J Magn Reson Imaging. 2017;46:1361–1367. [DOI] [PMC free article] [PubMed] [Google Scholar]
- 5. Chakouch MK, Pouletaut P, Charleux F, Bensamoun SF. Viscoelastic shear properties of in vivo thigh muscles measured by MR elastography. J Magn Reson Imaging. 2016;43:1423–1433. [DOI] [PubMed] [Google Scholar]
- 6. Skovorda A, Klishko AN, Gusakian DA, et al. Quantitative analysis of mechanical characteristics of pathologically altered soft biological tissues. Biofizika. 1995;40:1335–1340. [PubMed] [Google Scholar]
- 7. Sarvazyan P, Rudenko OV, Swanson SD, Fowlkes JB, Emelianov SY. Shear wave elasticity imaging: a new ultrasonic technology of medical diagnostics. Ultrasound Med Biol. 1998;24:1419–1435. [DOI] [PubMed] [Google Scholar]
- 8. Yoon H, Aglyamov SR, Emelianov SY. Dual‐phase transmit focusing for multi‐angle compound shear‐wave elasticity imaging. IEEE Trans Ultrason Ferroelectr Freq Control. 2017;64:1439–1449. [DOI] [PMC free article] [PubMed] [Google Scholar]
- 9. Nightingale K, McAleavey S, Trahey G. Shear‐wave generation using acoustic radiation force: in vivo and ex vivo results. Ultrasound Med Biol. 2003;29:1715–1723. [DOI] [PubMed] [Google Scholar]
- 10. Goertz RS, Schuderer J, Strobel D, Pfeifer L, Neurath MF, Wildner D. Acoustic radiation force impulse shear wave elastography (ARFI) of acute and chronic pancreatitis and pancreatic tumor. Eur J Radiol. 2016;85:2211–2216. [DOI] [PubMed] [Google Scholar]
- 11. Bercoff J, Tanter M, Fink M. Supersonic shear imaging: a new technique for soft tissue elasticity mapping. IEEE Trans Ultrason Ferroelectr Freq Control. 2004;51:396–409. [DOI] [PubMed] [Google Scholar]
- 12. Chen S, Urban MW, Pislaru C, et al. Shearwave dispersion ultrasound vibrometry (SDUV) for measuring tissue elasticity and viscosity. IEEE Trans Ultrason Ferroelectr Freq Control. 2009;56:55–62. [DOI] [PMC free article] [PubMed] [Google Scholar]
- 13. Song P, Zhao H, Manduca A, et al. Comb‐push ultrasound shear elastography (CUSE): a novel method for two‐dimensional shear elasticity imaging of soft tissues. IEEE Trans Med Imaging. 2012;31:1821–1832. [DOI] [PMC free article] [PubMed] [Google Scholar]
- 14. Vappou J, Maleke C, Konofagou EE. Quantitative viscoelastic parameters measured by harmonic motion imaging. Phys Med Biol. 2009;54:3579. [DOI] [PubMed] [Google Scholar]
- 15. Vappou J, Hou GY, Marquet F, Shahmirzadi D, Grondin J, Konofagou EE. Non‐contact, ultrasound‐based indentation method for measuring elastic properties of biological tissues using harmonic motion imaging (HMI). Phys Med Biol. 2015;60:2853. [DOI] [PMC free article] [PubMed] [Google Scholar]
- 16. Wang H, Nieskoski MD, Marra K, et al. Elastographic assessment of xenograft pancreatic tumors. Ultrasound Med Biol. 2017;43:2891–2903. [DOI] [PMC free article] [PubMed] [Google Scholar]
- 17. Payen T, Palermo CF, Sastra SA, et al. Elasticity mapping of murine abdominal organs in vivo using harmonic motion imaging (HMI). Phys Med Biol. 2016;61:5741. [DOI] [PMC free article] [PubMed] [Google Scholar]
- 18. Hou GY, Provost J, Grondin J, et al. Sparse matrix beamforming and image reconstruction for 2‐D HIFU monitoring using harmonic motion imaging for focused ultrasound (HMIFU) with in vitro validation. IEEE Trans Med Imaging. 2014;33:2107–2117. [DOI] [PMC free article] [PubMed] [Google Scholar]
- 19. Luo J, Konofagou EE. A fast normalized cross‐correlation calculation method for motion estimation. IEEE Trans Ultrason Ferroelectr Freq Control. 2010;57:1347–1357. [DOI] [PMC free article] [PubMed] [Google Scholar]
- 20. Manduca A, Lake DS, Kruse SA, Ehman RL. Spatio‐temporal directional filtering for improved inversion of MR elastography images. Med Image Anal. 2003;7:465–473. [DOI] [PubMed] [Google Scholar]
- 21. Deffieux T, Gennisson J‐L, Bercoff J, Tanter M. On the effects of reflected waves in transient shear wave elastography. IEEE Trans Ultrason Ferroelectr Freq Control. 2011;58:2032–2035. [DOI] [PubMed] [Google Scholar]
- 22. Song P, Manduca A, Zhao H, Urban MW, Greenleaf JF, Chen S. Fast shear compounding using robust 2‐D shear wave speed calculation and multi‐directional filtering. Ultrasound Med Biol. 2014;40:1343–1355. [DOI] [PMC free article] [PubMed] [Google Scholar]
- 23. Han Y, Wang S, Payen T, Konofagou E. Fast lesion mapping during HIFU treatment using harmonic motion imaging guided focused ultrasound (HMIgFUS) in vitro and in vivo. Phys Med Biol. 2017;62:3111. [DOI] [PMC free article] [PubMed] [Google Scholar]
- 24. Varghese T, Ophir J, Konofagou E, Kallel F, Righetti R. Tradeoffs in elastographic imaging. Ultrason Imaging. 2001;23:216–248. [DOI] [PubMed] [Google Scholar]
- 25. Olive KP, Jacobetz MA, Davidson CJ, et al. Inhibition of Hedgehog signaling enhances delivery of chemotherapy in a mouse model of pancreatic cancer. Science. 2009;324:1457–1461. [DOI] [PMC free article] [PubMed] [Google Scholar]
- 26. Gao L, Parker KJ, Lerner RM, Levinson SF. Imaging of the elastic properties of tissue—a review. Ultrasound Med Biol. 1996;22:959–977. [DOI] [PubMed] [Google Scholar]
- 27. Sarvazyan A, Hall TJ, Urban MW, Fatemi M, Aglyamov SR, Garra BS. An overview of elastography – an emerging branch of medical imaging. Curr Med Imaging Rev. 2011;7:255–282. [DOI] [PMC free article] [PubMed] [Google Scholar]
- 28. Iwasaki R, Takagi R, Nagaoka R, et al. Monitoring of high‐intensity focused ultrasound treatment by shear wave elastography induced by two‐dimensional‐array therapeutic transducer. Jpn J Appl Phys. 2016;55:07KF05. [Google Scholar]
- 29. Nabavizadeh A, Song P, Chen S, Greenleaf JF, Urban MW. Multi‐source and multi‐directional shear wave generation with intersecting steered ultrasound push beams. IEEE Trans Ultrason Ferroelectr Freq Control. 2015;62:647–662. [DOI] [PMC free article] [PubMed] [Google Scholar]
- 30. Nabavizadeh A, Greenleaf JF, Fatemi M, Urban MW. Optimized shear wave generation using hybrid beamforming methods. Ultrasound Med Biol. 2014;40:188–199. [DOI] [PMC free article] [PubMed] [Google Scholar]
- 31. Chen H, Hou GY, Han Y, et al. Harmonic motion imaging for abdominal tumor detection and high‐intensity focused ultrasound ablation monitoring: an in vivo feasibility study in a transgenic mouse model of pancreatic cancer. IEEE Trans Ultrason Ferroelectr Freq Control. 2015;62:1662–1673. [DOI] [PMC free article] [PubMed] [Google Scholar]
- 32. Hou GY, Marquet F, Wang S, Apostolakis I‐Z, Konofagou EE. High‐intensity focused ultrasound monitoring using harmonic motion imaging for focused ultrasound (HMIFU) under boiling or slow denaturation conditions. IEEE Trans Ultrason Ferroelectr Freq Control. 2015;62:1308–1319. [DOI] [PMC free article] [PubMed] [Google Scholar]
- 33. Shahmirzadi D, Hou GY, Chen J, Konofagou EE. Exvivo characterization of canine liver tissue viscoelasticity after highintensity focused ultrasound ablation. Ultrasound Med Biol. 2014;40:341–350. [DOI] [PMC free article] [PubMed] [Google Scholar]
- 34. Maleke C, Konofagou EE. Harmonic motion imaging for focused ultrasound (HMIFU): a fully integrated technique for sonication and monitoring of thermal ablation in tissues. Phys Med Biol. 2008;53:1773–1793. [DOI] [PubMed] [Google Scholar]


