

Abstract
Chemical modifications of histones can mediate diverse DNA-templated processes including gene transcription1–3. Here, we provide evidence for a new class of histone posttranslational modification (PTM), serotonylation of glutamine, which occurs at position 5 (Q5ser) on histone H3 in serotonin (5-hydroxytryptamine, 5-HT) producing organisms. We demonstrate that tissue Transglutaminase 2 (TGM2) can serotonylate histone H3 tri-methylated lysine 4 (H3K4me3) marked nucleosomes resulting in the presence of combinatorial H3K4me3Q5ser in vivo. H3K4me3Q5ser displays a ubiquitous pattern of tissue expression in mammals, with enrichment observed in brain and gut, two organ systems responsible for the bulk of 5-HT production. Genome-wide analyses of human serotonergic neurons, developing mouse brain and cultured serotonergic cells indicate that the mark is enriched in euchromatin, is sensitive to cellular differentiation and correlates with permissive gene expression, phenomena that are linked to the mark’s potentiation of TFIID4–6 interactions with H3K4me3. Cells ectopically expressing an H3 mutant that cannot be serotonylated display significantly altered expression of H3K4me3Q5ser target loci leading to deficits in differentiation. Taken together, these data identify a direct role for 5-HT, independent from its contributions to neurotransmission and cellular signaling, in the mediation of permissive gene expression.
Serotonergic signaling is critical to an array of biological processes ranging from neurotransmission to gastrointestinal motility and hormone release. Although vesicular packaging of 5-HT is essential for many of its functions, a handful of studies have demonstrated the presence of extravesicular monoamines in the nucleus and soma of monoamine producing cells7,8. While the presence of extravesicular 5-HT has been suggested to be important during periods of activity-dependent somatic release7, it has remained unclear whether it might play additional roles within the nucleus.
5-HT has been shown to form covalent bonds with cytosolic proteins via transamidation by TGM2, a modification that has been suggested to alter signaling properties of monoaminylated substrates9–11. We therefore sought to investigate whether nuclear proteins may similarly be modified. Given that TGM2 may interact with, or even cross-link, histone proteins in vitro12–14, we began by investigating whether histones might serve as endogenous substrates for serotonylation. We employed a bioorthogonal metabolic labeling approach15 based on propargylated serotonin (5-PT) that can be delivered to living cells (Extended Data Fig. 1a-b), followed by protein labeling and immunoprecipitation (IP) of serotonylated substrates (Fig. 1a, left). Western blotting revealed H3, but not H4, H2A or H2B, as a putative endogenous substrate for serotonylation (Fig. 1a, right and Extended Data Fig. 1c-d).
Figure 1. Identification of endogenous serotonylated H3 glutamine 5.
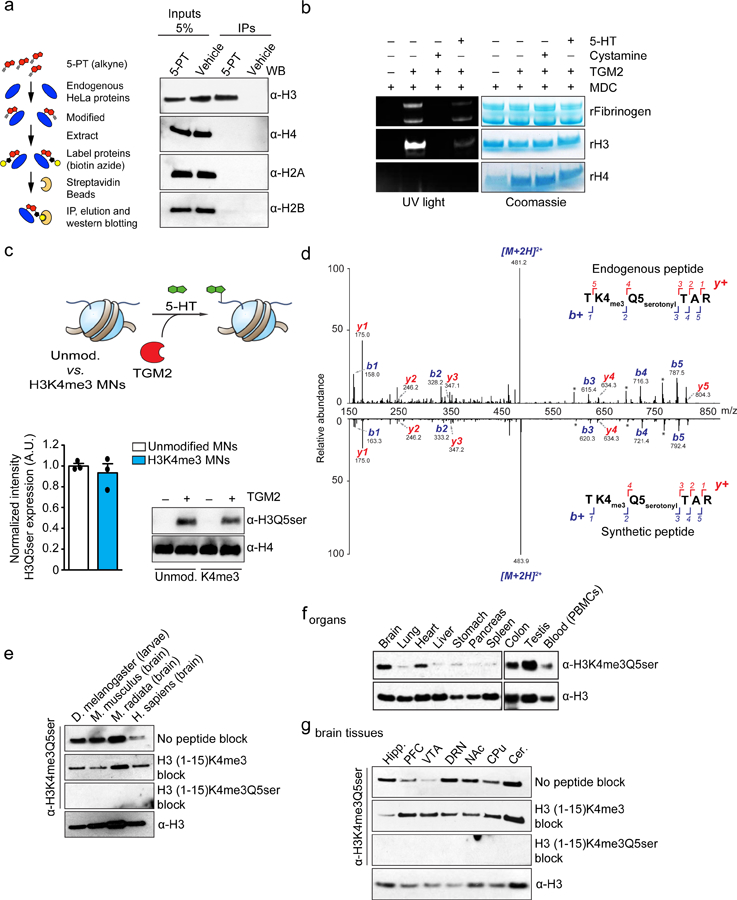
a, Bioorthogonal labeling of 5-PT modified histone proteins from HeLa nuclear extracts. H3 results confirmed in ≥ 3 independent experiments. b, TGM2 monoaminylation (MDC) assays with histone vs. non-histone substrates –/+ TGM2 inhibition with cystamine (4 mM) or donor competition with excess 5-HT (500 μM). H3 results confirmed in ≥ 3 independent experiments. c, TGM2 serotonylation assays on unmodified vs. H3K4me3 nucleosomes (n=3/MN type, two-tailed Student’s t-test; t4=0.7309, p=0.50). H4 is provided as a loading control. d, Mirror plot representation (aligned by m/z, and magnified 2X on either side of the precursor ion) of MS/MS spectra for endogenous vs. heavy synthetic (i.e., D5 labeled on the N-terminus leading to mass shifts for b+ fragment ions exclusively) H3K4me3Q5ser peptides in undifferentiated RN46A-B14 cells. Results confirmed in ≥ 3 independent experiments (RN46A-B14 cells pre- vs. post-differentiation and in mouse brain). e, Multi-species comparison of H3K4me3Q5ser expression (n=1). H3 is provided as a loading control. Representative analysis of f, peripheral organ/blood (PBMC) and g, brain (hippocampus, prefrontal cortex, ventral tegmental area, dorsal raphe nucleus, nucleus accumbens, caudate putamen, cerebellum) cell extracts from mouse for the presence of K4me3Q5ser (n=3–4/tissue or brain region; see Supplementary Data Table 1 for quantifications). H3 is provided as a loading control. Data are presented as averages ± SEM.
To assess whether TGM2, a ubiquitously expressed and functionally diverse protein16 (Extended Data Fig. 2a), is critical for H3 serotonylation in human cells, we performed bioorthogonal labeling-based IPs in the presence or absence of cystamine dihydrochloride, an inhibitor of transglutaminase activity. Treatment with cystamine eliminated nearly all H3 serotonyl signal (Extended Data Fig. 2b). While TGM2 is likely necessary for H3 serotonylation, numerous transglutaminases exist that may impact deposition of the mark. Thus, we examined whether TGM2 is sufficient to catalyze H3 serotonylation. We employed an alternative human tissue culture system, HEK293T cells, which, unlike HeLa cells, do not express TGM2 (Extended Data Fig. 2c). Employing a genetic rescue-like approach, we confirmed that exogenous expression of active nuclear TGM2 in these cells is sufficient to promote deposition of the mark (Extended Data Fig. 2d).
To assess if H3 is a direct substrate for serotonylation, we performed recombinant TGM2 enzymatic assays in vitro on histone and non-histone substrates (e.g., Fibrinogen, a protein previously demonstrated to be serotonylated17). Monoaminylation assays were performed using the fluorescent monoamine analogue, monodansylcadaverine (MDC), in the presence or absence of cystamine or excess 5-HT. While both Fibrinogen and H3 display TGM2-dependent transamidation of MDC–signals that are attenuated by cystamine application and donor competition with 5-HT–no signal was observed for H4 (Fig. 1b). Subsequent radioactivity-based serotonylation assays were performed revealing consistent outcomes (Extended Data Fig. 2e).
To identify the site(s) of serotonylation on H3, we next performed targeted liquid chromatography-mass spectrometry (LC-MS/MS) following in vitro TGM2 assays with 5-HT. Peptide MS/MS analyses (Extended Data Fig. 2f) revealed glutamine 5 as a reactive amino acid substrate for the mark. Consistent with this assignment, mutation of glutamine 5 to an alanine (H3Q5A) leads to loss of transamidation activity by TGM2 (Extended Data Fig. 2g).
Given the close proximity of Q5ser to lysine 4, a residue that when tri-methylated provides a critical signature for transcriptional initiation, we examined the potential impact of K4me3 on TGM2-mediated monoaminylation in vitro. Unmodified or H3K4me3 nucleosomes (Extended Data Fig. 3a-e) were subjected to TGM2/5-HT assays. Employing immunodetection with antibodies raised against the marks (see below), we found that TGM2 equally monoaminylates unmodified and H3K4me3 substrates (Fig. 1c and Extended Data Fig. 3f). Likewise, the presence of Q5ser has no effect on the ability of MLL1, an H3K4 methyltransferase, to modify nucleosomes in vitro (Extended Data Fig. 3g).
To better understand functional roles for H3 serotonylation in vivo, we raised and validated both single (H3Q5ser) and dual (H3K4me3Q5ser) modification-specific antibodies (Extended Data Fig. 4a-h). LC-MS/MS analyses on IP’d material using these antibodies in a serotonergic cell line (RN46A-B14 cells) and in adult mouse brain (dorsal raphe nucleus, DRN) unambiguously confirmed the existence of these marks in mammalian cells/tissues (Fig. 1d and Extended Data Fig. 5a-b). While both PTMs were present in culture, only the combinatorial modification was identified in vivo in brain (as well as across a wide range of 5-HT producing organisms from Drosophila to humans–Fig. 1e). Accordingly, we elected to focus on H3K4me3Q5ser and began by investigating its distribution across mammalian tissues. We identified a ubiquitous pattern of expression, whereby the mark is enriched within organs that produce 5-HT, such as brain and colon, and displays more limited signal in some non-serotonergic organs. Robust signals were also observed in heart, circulating blood (i.e., peripheral blood mononuclear cells, PBMCs) and testes (Fig. 1f). Contrary to initial expectations within brain, H3K4me3Q5ser signal is not segregated to regions where 5-HT is produced (e.g., DRN), but rather is broadly distributed across structures (Fig. 1g); see Supplementary Data Table 1 for quantifications. Even within DRN, the mark was qualitatively found to not be specific to serotonergic neurons, instead displaying additional signal in non-serotonergic neurons and in non-neuronal cells (Extended Data Fig. 6a-c). Such expression is ablated in animals that do not produce serotonin (Extended Data Fig. 6d-f).
To extend our findings to a model of human serotonergic neuronal differentiation, we examined the expression of H3K4me3Q5ser in human pluripotent stem cell (hPSC)-derived 5-HT neurons pre- and post-differentiation18 (see Fig. 2a-c for cellular validations). We found that differentiation leads to a significant increase in H3K4me3Q5ser levels, with concomitant changes observed in H3K4me3 (Fig. 2d and Extended Data Fig. 4h). To assess genome-wide impacts of serotonergic differentiation, we performed ChIP-seq using our dual PTM antibody. In hPSCs, peak-calling revealed negligible enrichment for the mark, however, the total number of peaks for H3K4me3Q5ser increased significantly with differentiation; genomic distribution patterns for the mark in 5-HT neurons revealed a strong bias toward promoters (Fig. 2e and Supplementary Data Tables 2-3). To investigate precise genomic loci displaying differential regulation of H3K4me3Q5ser during differentiation, diffReps19 was performed, identifying 12,086 protein-coding genes with altered enrichment. The vast majority of these changes were found to be increased events occurring within gene promoters (Fig. 2f and Supplementary Data Table 4), as exemplified by the neuronal gene locus for ELAVL3 vs. NANOG, a transcription factor associated with self-renewal in undifferentiated stem cells (Fig. 2g). Further assessments (Enrichr: Kegg 2016 Pathway Analysis)20,21 of genes displaying altered H3K4me3Q5ser enrichment indicated significant associations with pathways involved in neuronal differentiation and development (Supplementary Data Table 5). To understand potential roles for H3K4me3Q5ser in the regulation of gene expression, we employed RNA-seq in 5-HT neurons vs. hPSCs and performed Fisher’s exact tests comparing genes containing differential H3K4me3Q5ser sites to those that are differentially expressed. In doing so, we identified correlations between the mark’s enrichment and altered expression, particularly in comparison to those genes displaying increased abundance (Fig. 2h and Supplementary Data Table 6). Kegg analysis of these overlapping protein-coding genes identified significantly enriched pathways associated with ‘axon guidance’ and ‘serotonergic synapse,’ among others (Supplementary Data Table 5).
Figure 2. H3K4me3Q5ser is responsive to human serotonergic neuronal differentiation.
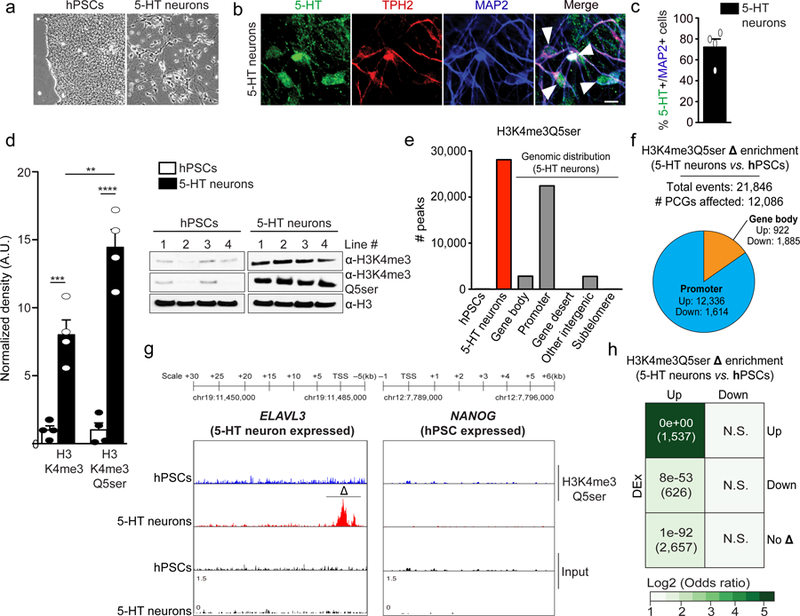
a, Brightfield and b, immunofluorescence images (line #1 provided as representative) validating differentiation of 5-HT+/TPH2+ neurons from hPSCs with c, ~72% efficiency (5-HT+/MAP2+) across all four lines examined. Scale bar equals 20 μm. d, Quantitative WB analysis of H3K4me3 and H3K4me3Q5ser expression in 5-HT neurons vs. hPSCs (two-tailed Student’s t-tests, n=4/group; K4me3 - t6=6.134, ***p=0.0009, K4me3Q5ser - t6=9.513, ****p<0.0001, K4me3Q5ser vs. K4me3 neurons - t6=3.755, **p=0.0095). H3 was used a loading control. e, MACSv2.1.1-based peak calling for H3K4me3Q5ser ChIP-seq data pre- and post-differentiation (FDR<0.05, FC>1.2 cutoffs applied after adjusting for multiple comparisons–n=4 lines/pre- vs. post-differentiation; normalized to respective inputs). f, diffReps analysis of H3K4me3Q5ser differential enrichment pre- vs. post-differentiation (FDR<0.05, FC>1.2 cutoffs applied after adjusting for multiple comparisons–n=4 lines/pre- vs. post-differentiation). Pie chart indicates distribution of genic differential enrichment events for the mark comparing promoter vs. gene body regions. g, Representative genome browser tracks of ELAVL3 vs. NANOG loci for H3K4me3Q5ser (vs. DNA input) in hPSCs vs. 5-HT neurons (n=4 lines/pre- vs. post-differentiation). Δ indicates a statistically significant site of differential enrichment for H3K4me3Q5ser. h, Odds ratio analysis of overlapping genes displaying differential H3K4me3Q5ser enrichment (FDR<0.05, FC>2.5, n=4 lines/pre- vs. post-differentiation) vs. differential gene expression (DEx, n=3 lines/pre- vs. post-differentiation – lines 1–3, FDR<0.05 cutoff applied after adjusting for multiple comparisons). Insert numbers indicate respective p values for associations, followed by the number of protein-coding genes overlapping per significant category. Data are presented as averages ± SEM.
Consistent results were observed in mouse brain during embryonic development from E9.5 to E17.5, a time period in which serotonergic neurons become fully differentiated and establish far reaching innervations22 (Extended Data Fig. 7a-f and Supplementary Data Tables 7-14). Similar to results in human 5-HT neurons, neuronal genes that are activated during development exhibited significantly increased enrichment for both H3K4me3 and H3K4me3Q5ser, while other genes that remained equally expressed at both time points displayed similar genomic enrichment for the two marks at both developmental stages. These data suggest that the combination of K4me3 and Q5ser on H3 may reinforce patterns of permissive, or inducible, gene expression in vivo. However, given that both marks are induced during differentiation/development in these systems, it remained difficult to tease apart their specific contributions.
Therefore, to more causally assess the role of Q5ser in these processes, we employed a RN46A-B14 cell culture model23, in which these manipulatable, proliferative 5-HT producing cells can be differentiated in vitro to increase 5-HT production, induce cell-cycle arrest and promote a BDNF-dependent neurite outgrowth phenotype (Fig. 3a). Consistent with data from human 5-HT neurons and developing mouse brain, we found that RN46A-B14 cellular differentiation leads to a significant increase in H3K4me3Q5ser levels (Fig. 3b). However, unlike the other two models, we did not observe changes in H3K4me3 expression (n=3; t4 = 1.188, p = 0.30), a phenomenon that we reasoned might aid in further dissecting H3K4me3Q5ser’s specific contributions to gene expression. To validate the usefulness of this system for causal assessments of H3K4me3Q5ser, we assessed genome-wide impacts of differentiation by performing ChIP-seq using our dual PTM antibody vs. an antibody against H3K4me3; note that the H3K4me3 antibody detects the methyl mark equally in both the presence and absence of Q5ser (Extended Data Fig. 8a). Prior to differentiation, peak-calling revealed roughly equal genome-wide enrichment for the two marks, however, the total number of peaks called for H3K4me3Q5ser increased with differentiation, while enrichment for H3K4me3 remained unchanged; genomic distribution patterns for the two PTMs were nearly identical (Fig. 3c, Extended Data Fig. 8b and Supplementary Data Tables 15-18). To investigate genomic loci displaying differential regulation of H3K4me3Q5ser during differentiation, diffReps was performed, identifying 6,386 protein-coding genes with altered enrichment; ~60% of all K4me3 enriched genes pre-differentiation displayed such alterations in H3K4me3Q5ser signal. The majority of these changes were found to be increased events occurring within gene promoters (Fig. 3d and Supplementary Data Tables 19-20), as exemplified by the Vimentin (Vim) locus (Fig. 3e). Around 65% of so-called ‘bivalent genes’ in RN46A-B14 cells (broadly defined as those displaying significant peaks for both H3K4me3 and H3K27me3 pre-differentiation; ~14% of all K4me3 marked protein-coding genes within these cells), were found to overlap with genes displaying differentially enriched H3K4me3Q5ser indicating that alterations in this mark may act to circumvent bivalent gene repression during differentiation (Supplementary Data Tables 21-23). Subsequent assessments of gene pathways displaying altered H3K4me3Q5ser enrichment in RN46A-B14 cells yielded similar results to those observed in differentiated human serotonergic neurons and in mouse brain, pathways that displayed minimal overlap with those identified in H3K4me3 differential analyses (Supplementary Data Tables 24-25). Finally, we again performed RNA-seq in these cells and performed Fisher’s exact tests comparing genes with differential H3K4me3Q5ser sites to those that are differentially expressed. We identified distinct (vs. H3K4me3; Extended Data Fig. 8c) and positive correlations between the mark’s enrichment and differential gene expression (Fig. 3f and Supplementary Data Table 26) indicating that H3K4me3Q5ser is likely a permissive modification.
Figure 3. H3K4me3Q5ser, independently from H3K4me3, correlates with permissive gene expression during cellular differentiation.
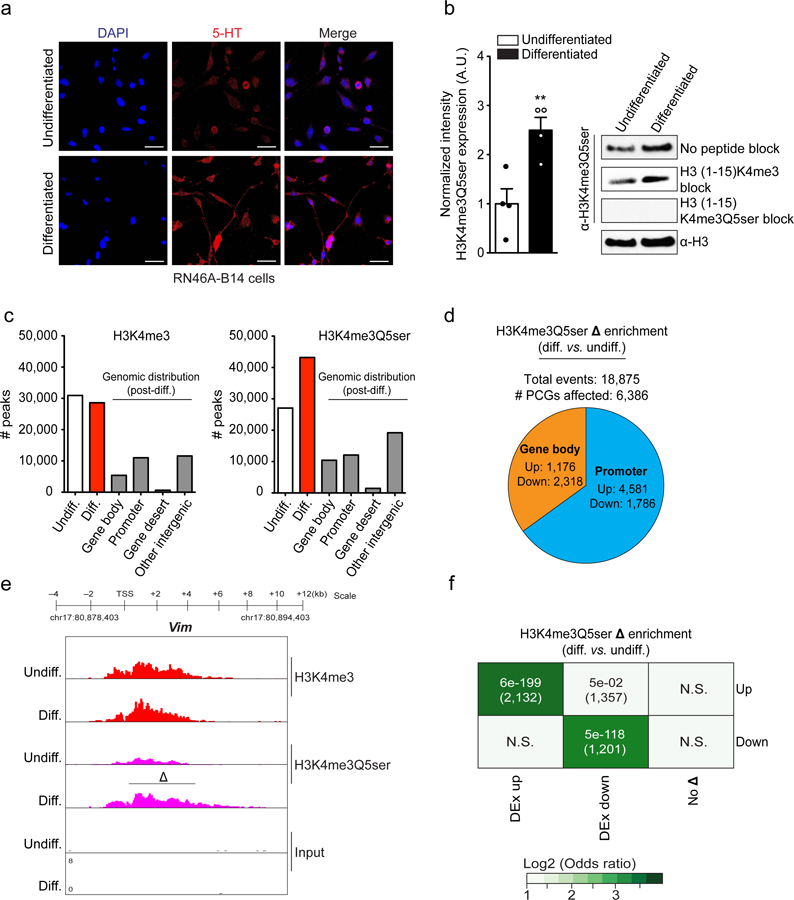
a, Immunofluorescence images of 5-HT in RN46A-B14 cells overlayed with a nuclear co-stain (DAPI) pre- and post-differentiation. Scale bars equal 20 μm. Results confirmed in ≥ 3 independent experiments b, Quantitative WB analysis of H3K4me3Q5ser expression in RN46A-B14 cells pre- vs. post-differentiation (two-tailed Student’s t-test, n=4/group; t6=3.736, **p=0.0097). H3 was used a loading control.. c, MACSv2.1.1-based peak calling for H3K4me3 vs. H3K4me3Q5ser ChIP-seq data pre- and post-differentiation in RN46A-B14 cells (FDR<0.05, FC>1.2 cutoffs applied after adjusting for multiple comparisons–n=3 independent biological samples/pre- vs. post-differentiation; normalized to respective inputs). d, Analysis of H3K4me3Q5ser differential enrichment comparing RN46A-B14 cells pre- vs. post-differentiation (FDR<0.05, FC>1.2 cutoffs applied after adjusting for multiple comparisons–n=3 independent biological samples/pre- vs. post-differentiation). Pie chart indicates distribution of genic differential enrichment events for the mark comparing promoter vs. gene body regions. e, Genome browser tracks of the Vim locus for H3K4me3 and H3K4me3Q5ser (vs. DNA input) in RN46A-B14 cells pre- and post differentiation. Δ indicates a statistically significant site of differential enrichment for H3K4me3Q5ser as determined by diffReps (n=3 independent biological samples/pre- vs. post-differentiation). f, Odds ratio analysis of overlapping genes displaying differential H3K4me3Q5ser enrichment vs. differential gene expression (DEx, n=3 independent biological samples/pre- vs. post-differentiation, FDR<0.05 cutoff applied after adjusting for multiple comparisons). Insert numbers indicate respective p values for associations, followed by the number of protein-coding genes overlapping per significant category. Data are presented as averages ± SEM.
To directly validate the mark’s putative role in active gene expression, we generated lentiviruses expressing either wildtype H3.3 or H3.3Q5A (H3.3 was used to ensure chromatin incorporation as cells become post-mitotic24)–a mutation that prevents serotonylation (Extended Data Fig. 2g) but does not affect H3’s ability to be tri-methylated at lysine 4 (Extended Data Fig. 8d)–and transduced RN46A-B14 cells during differentiation. Gene expression patterns of H3K4me3Q5ser target vs. non-target loci were assessed via RNA-seq (Supplementary Data Table 27). Our data demonstrate that competing against endogenous H3K4me3Q5ser expression alters levels of H3K4me3Q5ser target genes, with little to no impact on non-target loci (Extended Data Fig. 8e). Furthermore, many of the target genes regulated by H3.3Q5A displayed opposite patterns of regulation in comparison to that observed during normal differentiation (Extended Data Fig. 8f) suggesting that attenuating the mark’s expression may cause these cells to remain in a more undifferentiated-like state. In line with this idea, Kegg Analysis identified axon guidance as the sole enriched pathway affected by H3.3Q5A expression (Supplementary Data Table 28). We next applied a specific inhibitor of TGM2 (LDN 27219) to RN46A-B14 cells during differentiation, followed by qPCR assessments of candidate genes predicted to be regulated by the mark. Of the candidate loci examined, all were found to be downregulated in their expression during differentiation (Extended Data Fig. 8g), consistent with H3K4me3Q5ser’s putative role as a permissive modification. Finally, predicted associations between the mark’s induction and progression of cellular development were validated through assessments of RN46A-B14 neurite outgrowth during differentiation, in which expression of H3.3Q5A was found to significantly reduce neurite length (Extended Data Fig. 8h-i), consistent with the cells remaining in a less differentiated state.
To evaluate potential mechanisms contributing to H3K4me3Q5ser’s permissive role in gene expression, we next investigated the impact of Q5ser on nuclear protein binding interactions with the N-terminal H3 tail, both in the presence and absence of K4me3. We employed synthetically modified and biotinylated H3 peptides that were used in nuclear extract IPs, followed by LC-MS/MS to identify putative binding proteins. Numerous interactions with H3K4me3 vs. H3 unmodified were identified including many well-established H3K4me3 “readers” (Supplementary Data Table 29). Focusing on H3K4me3 binders, we assessed whether the presence of Q5ser in combination with K4me3 might influence these binding events. In doing so, we found that 77 (~21%) of these proteins displayed either potentiated or attenuated binding in the presence of Q5ser (Fig. 4a and Supplementary Data Tables 29-30). Among those potentiated were 15 members of the general transcription factor complex, TFIID (TATA-box-binding protein/TBP and its associated factors/TAFs). Such enhanced interactions between TFIID and H3K4me3Q5ser were subsequently validated via western blotting post-nuclear extract IPs (Fig. 4b and Extended Data Fig. 9a), and via peptide IPs against the purified TFIID complex (Extended Data Fig. 9b).
Figure 4. H3K4me3Q5ser potentiates TFIID interactions with H3K4me3.
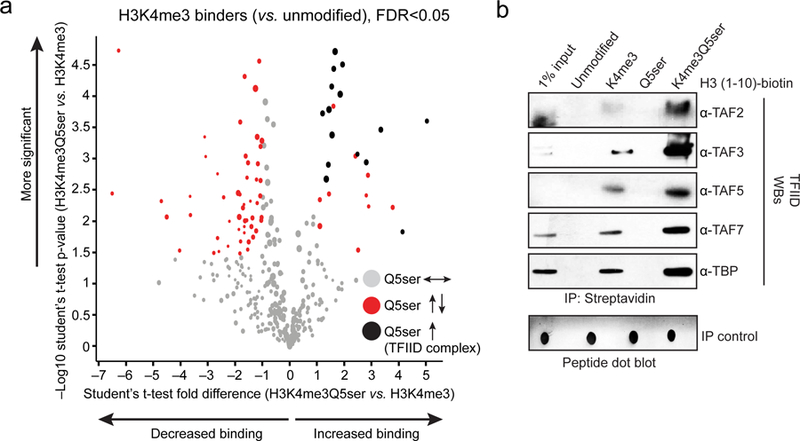
Modified H3 (1–10) peptide IPs from HeLa nuclear extracts identifying potentiated interactions between TFIID complex proteins and the H3K4me3 tail in the presence of Q5ser via a, LC-MS/MS–iBAQ label-free quantitation, n=4 independent biological replicates/peptide; results of t-tests (adjusted for multiple comparisons) are illustrated using a Volcano plot. Sizes of the filled circles are used as an indication of the approximate amount of a given protein. FDR<0.05, FC>2 cutoffs applied (gray circles = K4me3 binders unaffected by Q5ser; red circles = K4me3 binders potentiated or attenuated by Q5ser; black circles = TFIID complex proteins altered in their interactions by Q5ser). b, Representative western blot images of modified H3 (1–10) peptide IPs from HeLa nuclear extracts (quantifications provided in Extended Data Fig. 9a).
Finally, to epigenomically explore relationships between differential H3K4me3Q5ser enrichment and TFIID recruitment to chromatin, ChIP-seq for Taf3–a proxy for the complex–was performed in RN46A-B14 cells pre- and post-differentiation. Taf3/TFIID chromatin associations were elevated in response to differentiation, with the bulk of its increased enrichment observed around transcriptional start sites (TSSs) (Extended Data Fig. 9c and Supplementary Data Tables 31-32), as exemplified by the Prrg4 locus (Extended Data Fig. 9d). Further assessments of Taf3/TFIID peak overlap post-differentiation with differential H3K4me3 or H3K4me3Q5ser (vs. those genes containing differential sites for both or neither of the marks) revealed that ~48% of all Taf3/TFIID bound genes following transition to a post-mitotic state correlate with altered H3K4me3Q5ser enrichment (Extended Data Fig. 9e). While alterations in both marks were found to correlate with Taf3/TFIID genes, only ~28% of differentially enriched genes for H3K4me3 were found to overlap with Taf3/TFIID post-differentiation. In comparison to H3K4me3, greater overlaps were also observed between protein-coding genes displaying altered enrichment for both H3K4me3Q5ser and Taf3/TFIID post-differentiation (Extended Data Fig. 9f and Supplementary Data Table 33).
Serotonylation of H3Q5 represents the first endogenous monoaminyl modification of histones to be described (Extended Data Fig. 9g), as well as the first non-methyl PTM of glutamine residues (e.g., H2AQ105me25) identified in histone proteins. Much remains to be delineated with respect to histone serotonylation’s potential functions in vivo. For example what is the mark’s stoichiometry relative to H3K4me3, are there specific non-H3K4me3 “readers” or demonoaminylases that control its activities, is the mark responsive to environmental perturbations or pathophysiological states associated with alterations in 5-HT production and/or signaling, etc.? Q5ser does appear, however, to be a modification that acts to alter specific protein interactions with H3K4me3 and is likely involved in reinforcing permissive patterns of gene expression within selected tissues and/or cell-types. The precise mechanisms through which the mark is targeted to genomic loci, however, remain unknown. Furthermore, while H3K4me3Q5ser associations with TFIID may facilitate locus specific gene expression during differentiation, such interactions likely only explain a fragment of the mark’s role in genic regulation. Finally, it stands to reason that alternative histone monoaminylation states may exist in vivo and might act distinctly or cooperatively with H3 serotonylation to regulate gene expression in eukaryotic cells. Thus, these findings may reveal a vast array of mechanisms for future explorations related to this new class of histone PTMs.
Methods
Chemicals
Commonly used reagents were purchased from Sigma Aldrich (Milwaukee, WI) and Fisher Scientific (Pittsburgh, PA). Amino acid derivatives and coupling agents for Fmoc solid-phase peptide synthesis (SPPS) were purchased from Novabiochem (Läufelfingen, Switzerland) and from Matrix Innovation (Quebec, Canada). Serotonin (5-HT) hydrochloride (cat#H-9523), monodansylcadaverine (cat#30432) and cystamine dihydrochloride (cat#C121509) were purchased from Sigma Aldrich. LDN 27219 was purchased from R&D Systems (cat#4602). Hydroxytryptamine Creatinine Sulfate–5-[1,2-3H(N)] was purchased from Perkin Elmer (cat#NET498001MC). Biotin cadaverine was purchased from Invitrogen. 5-PT was prepared in house as a hydrochloride salt according to reported synthetic procedures15.
Analytical
Analytical reversed-phase high-performance liquid chromatography (RP-HPLC) was performed using an Agilent 1100 series instrument with a Vydac C18 column (5 μm, 1 mL/min). Semi-preparative RP-HPLC was performed on an Agilent 1200 series system with a Vydac C18 column (semi-preparative column 12 μm, 10 mm × 250 mm, 4mL/min). Preparative scale RP-HPLC purifications were performed on a Waters prep LC equipped with a Waters 2535 Binary Gradient module, Waters 2489 UV detector, and a Vydac C18 column (10 μm, 22 × 250 mm, 18 mL/min). All RP-HPLC employed 0.1% trifluoroacetic acid (TFA) in water (HPLC solvent A), and 90% acetonitrile and 0.1% TFA in water (HPLC solvent B) as mobile phases. Mass-Spec analysis was performed using ESI–MS analysis on a MicrOTOFQ II ESI-Qq-TOF mass spectrometer (Bruker Daltonics, Billerica, MA).
Animals
Mice (C57BL/6J) were purchased from The Jackson Laboratory. Tissues from Tph 1/2-knockout mice (vs. littermate controls) were provided by Drs. Natalia Alenina and Michael Bader at the Max-Delbrück-Center for Molecular Medicine (MDC), Berlin Germany. Animals were group housed on a 12-hour light/dark cycle (lights on from 7:00 A.M. to 7:00 P.M.) at constant temperature (23ºC) with ad libitum access to food and water. All animal protocols were approved by the IACUC at both the Icahn School of Medicine at Mount Sinai (ISMMS) and the MDC. Pregnant female mice were euthanized with carbon dioxide and mouse embryonic brains (whole) were harvested at E9.5 and E17.5 for subsequent sequencing and western blotting experiments. PBMC isolation: adult mice were sacrificed by rapid decapitation. Trunk blood (~500 μl) was collected in 1.5 ml heparin-lithium lined Eppendorf tubes (cat#022379208). Trunk blood was subsequently mixed with 2 ml of room temperature (RT) RPMI media in 15 ml conical tubes and layered over 2 ml of RT Ficoll reagent (Ficoll-paque™ PLUS reagent, GE Healthcare cat#17–1440-02 Lot#10260010). The total mixture was centrifuged at 2200 RPM for 15 min at RT with a slow brake setting. PBMCs were visible as a cloudy layer. This layer was removed slowly with a 1 ml pipette and added to a new sterile 15 ml conical tube. BEP wash buffer in DPBS (5% BSA, 2 mM EDTA) was subsequently added to the PBMC layer and centrifuged at RT for 10 min to wash and pellet the cells.
Tissue culture
Cell culture materials
Dulbecco’s Modified Eagle Medium (DMEM) (Sigma; cat#D8437), 0.05% trypsin (Thermo Fisher, cat# 25300120), 10% fetal bovine serum (Omega; cat#FB11), 100 μg ml−1 streptomycin and 100 U ml−1 penicillin (Thermo Fisher; cat#15140122), RPMI-1640 Medium (Sigma cat#R8758), Geneticin (Thermo Fisher; cat#11811031), Matrigel (VWR; cat#47743–716), B-27 Supplement, (Thermo Fisher; cat#17504–044), 0.1% Insulin, (Sigma; cat#I6634), 0.1% apo-transferrin, (Sigma; cat#T1428), 0.1% Putrescine (Sigma; cat#P5780). B16 Base Media (pH 7.35): [740 ml DMEM (GIBCO; cat#31053–036), 260 ml F-12 nutrients (GIBCO; cat#21700–075), 14 mM sodium bicarbonate, 11 mM HEPES (Sigma; Cat#H6147) and 1% BSA (Sigma; Cat#A3311) in 1 L of MilliQ water].
HEK293T and HeLa cell culture
HEK293T and HeLa cell lines were obtained from the American Type Culture Collection (ATCC) and grown in DMEM supplemented with 10% FBS and 100 μg ml−1 streptomycin/100 U ml−1 penicillin. Cells were maintained at 37°C in a 5% CO2, 95% humidified incubator.
Human PSC and serotonergic neuronal culture
Fibroblasts from healthy individuals were cultured for reprogramming into induced pluripotent stem cells (PSCs). Reprogramming from primary human fibroblasts was achieved using Sendai virus within CytoTune-iPS Sendai Reprogramming Kits according to manufacturer’s instructions (Invitrogen, A13780–02, A16517, A16518). PSCs were confirmed to be karyotypically normal and were cultured on Matrigel-coated plastic plates (BD Biosciences) using a modified recipe of mTeSR1 medium (Stemcell Technologies). Briefly, hPSCs were maintained as colonies and passaged (line: #1 = p13, #2 = p12, #3 = p14 and #4 = p19) by mechanical and enzymatic dissociation (Dispase). Cells were cultured for 1 week with daily media changes prior to harvesting. Serotonergic neurons were generated using a modified version of a previously described method18. Briefly, floating embyroid bodies (EBs) were generated by mechanical and enzymatic (collagenase) dissociation of hPSC colonies. EBs were cultured for one week with DMEM/F12-Glutamax:Neurobasal (1:1) including: N2, B27 supplements, 1x non essential amino acids, SB431542 (2 μM), DMH-1 (2 μM) and CHIR99021 (1.4µM) (Serotonergic medium). EBs were plated onto to poly-ornithine/laminin (Sigma)-coated plastic plates in Serotonergic medium with the addition of Sonic hedgehog protein (Shh, 500 ng/ml) for another week. Rosette-forming EBs and derived neural precursor cells (NPCs) were selected and cultured as monolayers (~400,000 NPCs per slide) in Serotonergic medium containing Shh (500 ng/ml) and FGF-4 (10 ng/ml), and were then maintained at high densities. Serotonergic neurons were derived by culturing for an additional 3 weeks at lower densities in serotonergic differentiation medium comprised of a base of Neurobasal medium containing GDNF (10 ng/ml), BDNF (10 ng/ml) (Peprotech), dibutyrl-cyclicAMP (1 mM, Sigma), ascorbic acid (200 nM, Sigma), laminin (1 μg/ml), DAPT (2.5 µM) and TGF-beta3 (1 ng/ml). Medium was changed every other day for 3 weeks before cells were harvested for further processing. All procedures for human stem cell work were monitored and approved by the Institutional Review Board of the Salk Institute.
RN46A-B14 cell differentiation
For RN46A-B14 cell differentiation, a modified version of published protocols was used23,26. Briefly, RN46A-B14 cells (provided by Dr. Olivier Berton, ISMMS) were cultured and maintained in DMEM with 10% FBS, 1% Pen/Strep and 250 μg/ml Geneticin at 33°C with 5% CO2 on 10 cm cell culture dishes. The day before differentiation, cell culture dishes were coated with 6 ml of a matrigel/DMEM mixture for 1 hr at RT. After matrigel polymerization, 0.7–0.8 × 10⁶ cells were seeded onto each plate with 10 ml regular growth media. Plates were then incubated at 33°C overnight allowing the cells to adhere to the plate. On the day of differentiation, regular growth media was removed from plates and 10 ml of differentiation media (1% Pen/Strep, 1% B-27 supplement, 0.1% Insulin, 0.1% apotransferrin, 0.1% putrescine, in B16 Base media) was added to each plate. Cells were then incubated at 39°C with 5% CO2, 95% humidity for three days. On the fourth day, differentiation media was changed conditionally at a 1:1 ratio. Differentiated RN46A-B14 cells were collected on the sixth day with 0.05% trypsin by centrifugation, washed several times and then reconstituted in DPBS on ice.
Cell line sources and authentication
HEK293T and HeLa cell lines were obtained from the American Type Culture Collection (ATCC). RN46A-B14 cells were provided by Dr. Olivier Berton, ISMMS. hPSCs and hPSC-derived 5-HT neurons were provided by Dr. Fred Gage, Salk Institute. Sf9 cells were provided by Dr. Tom Muir, Princeton University. HEK293T and HeLa cells were authenticated drawing upon our vast experience working with these cells lines (based on cell morphology, growth conditions, etc.). RN46A-B14 cells were validated for 1) 5-HT production, and 2) differentiation potential (e.g., cell division arrest, neurite formation, alterations in gene expression, etc.), as described throughout the manuscript. hPSCs and derived 5-HT neurons were validated as discussed in the manuscript (Fig. 2). Sf9 cells were validated through their usefulness in the purification of TGM2 protein. All cell lines tested negative for mycoplasma contamination.
Treatments
5-PT: Cells (HEK293T or HeLa S2) were incubated with 5-PT (500 μM) at a confluency of ~75%. Cells were treated for 3 hr, followed by collection with 0.05% trypsin and pelleting in DPBS. Cystamine: where indicated, cells received cystamine dihydrocholoride at a concentration of 4 mM for 3 hr in conjunction with 5-PT treatments.
LDN 27219: Cells (RN46A-B14) were incubated with the reversible TGM2 inhibitor LDN 27219 (10 μM) on day 1 of differentiation. On the fourth day, differentiation media was changed conditionally at a 1:1 ratio with no more inhibitor added. Differentiated RN46A-B14 cells were collected on the sixth day with 0.05% trypsin by centrifugation, washed several times and then reconstituted in DPBS on ice.
Transfections
HEK293T cells were cultured in six-well plates, and transient transfections were performed at a FuGENE® HD Transfection Reagent (Promega; cat#E2311) to DNA ratio of 3:1. For transfections, 1 μg of plasmid DNA was transfected per well; 48 hours post-transfection, cells were detached with 0.05% trypsin and collected.
Peptide synthesis and generation of recombinant proteins
Preparation of serotonylated peptides for antibody generation
Peptide immunogens corresponding to H3 (1–10, Q5ser or K4me3Q5ser) were prepared using standard Fmoc-strategy solid phase chemistry on a 2-Cl Trityl resin incorporating a C-terminal Cys residue for conjugation to maleimide-activated KLH. Orthogonally protected Fmoc-Glu(OAll)-OH was incorporated at position 5 for on-resin serotonylation, and Fmoc-Lys(me3)-OH was coupled at position 4 to generate the dual modified immunogen. Following assembly of the peptide backbones, resin-bound peptides were allyl deprotected by treatment with Pd(0)(PPh3)4 (0.2 equiv.), N,N-dimethylbarbituric acid (10 equiv.) in DCM for 30 min (two treatments). Resins were extensively washed with DCM and DMF to remove residual Pd, and the Glu sidechain carboxylate was serotonylated by two treatments with PyAOP (1.1 equiv.) and DIEA (4.0 equiv.) in DMF, followed by direct addition of serotonin hydrochloride (2.0 equiv.) and agitation for 30 min. The crude serotonylated peptides were cleaved from the resin with concomitant global deprotection via treatment with 5% ethanedithiol (EDT), 2.5% iPr3SiH, 2.5% H2O in TFA for 2 hr at RT. Peptides were purified by preparative C-18 RP-HPLC, and final products were characterized by analytical C-18 RP-HPLC and ESI-MS. The purified peptides were then provided to EMD Millipore for generation of rabbit polyclonal antibodies, as described below.
Preparation of biotinylated H3 (1–10) peptides
Modified peptides corresponding to H3 (1–10) were prepared using standard Fmoc-strategy solid phase chemistry on a 2-Cl Trityl resin incorporating a C-terminal Lys(biotin) residue. Peptides were serotonylated, purified and characterized according to the above conditions.
Preparation of H3 (1–15) peptides
Peptides corresponding to H3 (1–15) were synthesized on a Rink Amide ChemMatrix resin using standard Fmoc-strategy solid phase chemistry. The methylation state of H3K4 was varied through incorporation of suitably protected lysine residues to access me1 [Fmoc-Lys(Me,Boc)-OH], me2 [Fmoc-Lys(Alloc)-OH)] or Me3 [Fmoc-Lys(me3)-OH]. Conversion of the Lys(Alloc) to Lys(me2) was achieved through dual Alloc/Allyl deprotection as outlined above, followed by reductive amination with 37% formaldehyde and NaBH3CN in PBS/MeOH prior to serotonylation. Peptides were serotonylated, purified and characterized according to the above conditions.
Recombinant proteins
Human histones H3.2 and H4 were cloned into pRUTH5 to yield an N-terminal His6-TEV tag. Histones were then expressed in BL21 Star(DE3) cells (Thermo Fisher, cat#C6010–03) into inclusion bodies for 3 hr at 37°C. Inclusion bodies were re-solubilized in 6 M guanidine-HCl, 1 M NaCl and 50 mM Tris-HCl (pH 8) prior to purification on a Ni-NTA affinity column. To generate recombinant H3Q5A, mutations were introduced into the pRUTH5-H3.2 construct using standard SDM. Additional histones were purchased from Active Motif (H3.1, cat#31294 and EPL generated H3K4me3, cat#31278). For some experiments, recombinant human TGM2 was purchased from R&D Systems (cat#4376-TG-050), and guinea pig Tgm2 was purchased from Zedira (cat#T006); KMT2A (MLL1) complex from Active Motif (cat#31423); and Fibrinogen from human plasma from Sigma (cat#F4883).
Production of TGM2 in Sf9 Cells
Tissue Transglutaminase 2 (Uniprot ID: P21980) was expressed using a baculovirus expression vector system. The coding sequence for TGM2 was obtained from a mammalian expression vector mCer-TG2-YFP [Addgene Plasmid #85471; this plasmid contained two non-native missense mutations (T141A and V224G), which were mutated to the endogenous residues]. This gene was subcloned into a pACEBac1 vector using standard restriction enzyme methods with a N-terminal FLAG affinity tag introduced for purification of the enzyme yielding pACEBac1-flag-TGM2. All sequences were confirmed by Sanger sequencing (GENEWIZ, South Plainsboro, NJ). For generation of the bacmid, pACEBac1-flag-TGM2 was transformed into DH10bac E. Coli competent cells according to the manufacturer’s instructions (ThermoFisher Scientific). Virus was generated as described previously2. TGM2 was expressed by adding a 1:500 dilution of the P3 virus to a 2 × 10⁶ cells per mL culture of Sf9 cells. After incubating for 48 h at 27 oC in the dark, cells were harvested by centrifugation, washed with PBS and pelleted. Using 40 µL per mL of culture, the pellet was resuspended in TEGN (25 mM Tris, 1 mM EDTA, 10% Glycerol, 0.02% IGEPAL CA 630, pH 7.5) plus 500 mM NaCl, 1 mM DTT, 0.1 mM PMSF. The cells were lysed by 20 strokes of a tight Dounce homogenizer, followed by sonication. The lysate was cleared by centrifugation (17,000g x 30 min), NaCl concentration diluted to 350 mM with TEGN and again cleared by centrifugation. The supernatant was incubated with Flag agarose beads (Genscript G1 a-DYKDDDDK, 0.5 µL beads/mL culture) for 3 hr at 4 oC. Following incubation, the beads were washed three times with TGN (25 mM Tris, 10% Glycerol, 0.02% IGEPAL CA 630, pH 7.5) plus 350 mM NaCl, and a final wash with TGN plus 120 mM NaCl. The protein was then eluted from the beads through incubation at 4 oC with FLAG peptide (0.25 mg/mL in TGN plus 120 mM NaCl, 1 mM DTT, 3 × 10 min x 1 CV). The eluted protein was then concentrated using a Vivaspin 500 centrifugal concentrator (MWCO 30,000) and dialyzed against TGN plus 120 mM NaCl, 1 mM DTT (2 × 4 hours). The dialyzed, purified TGM2 was aliquoted and stored at −80 oC.
Generation of H3K4me3 and H3Q5ser nucleosomes
Peptide synthesis
Synthetic peptide thioesters used in semisynthesis were manually synthesized on SEA-PS resin (Iris). The coupling of the first glycine residue was performed utilizing 5 eq. of Fmoc-Gly-OH, 4.9 eq. of HATU, and 10 eq DIEA (2 × 1 hour). Following coupling, a capping step utilizing 10% DIEA and 10% Ac2O in DMF (5 mL) was performed (1 × 10 min). The peptide was then extended using iterative cycles of Fmoc deprotection [3 mL of 20% piperidine in DMF (1 × 1 min, 2 × 8 min] and amino acid coupling (4.9 eq. of HOBt/HBTU and 10 eq. DIEA for 20–45 min) with thorough washing with DMF between each step. Double couplings were used when necessary to ensure complete acylation of the growing peptide. Serotonylated glutamine residues were introduced by incorporation of a Fmoc-L-glutamic acid γ-allyl ester (Chem-Impex International) followed by deprotection and coupling of a serotonin as described above (Preparation of serotonylated peptides for antibody generation). Following peptide assembly, the crude peptide was cleaved and deprotected using 92.5% TFA, 2.5% EDT, 2.5% iPr3SiH and 2.5% H2O. The crude peptide was then precipitated with diethyl ether and allowed to air dry. The peptides were then converted to C-terminal thioesters according to established protocols27. Briefly, (for a 0.05 mmol scale synthesis) the crude peptide [bearing the C-terminal bis(sulfanylethyl)amino linker] was incubated in a solution of mercaptopropionic acid (MPA, 0.5 mL) and TCEP (16 equiv. relative to peptide) in 2x PBS (10 mL) pH 4.0 at 37oC overnight. The reaction mixture was diluted with water (10 mL) and 10 % aqueous TFA (5 mL), extracted with Et2O to remove MPA, lyophilized overnight and then purified by preparative RP-HPLC utilizing a gradient of 0–30% B over 60 minutes.
Preparation of recombinant histones
Recombinant human Histones H2A, H2B and H4 were expressed in E. coli and purified according to established28 protocols with slight modifications. BL21 (DE3) cells were transformed with plasmids for histone expression and grown in Luria-Bertani (LB) medium at 37 °C until an OD600 of 0.6. Protein expression was then induced by addition of 1 mM isopropyl-β-D-thiogalactopyranoside (IPTG). The histones were expressed at 37 °C for 3–4 h before cells were pelleted by centrifugation (4000 × g, 15 min, 4 °C). The pellets were resuspended in 10 ml lysis buffer per liter cell culture (20 mM Tris, 200 mM NaCl, 1 mM EDTA, 1 mM BME, 0.1% Triton X-100 pH 7.5). Cells were lysed by sonication (30 sec on/30 sec off, 5 cycles, 45% amplitude) and centrifuged (16,000 × g, 25 min, 4 °C). The inclusion body pellet was washed twice with cold lysis buffer containing no Triton X-100, and extracted with resuspension buffer (7 M Urea, 10 mM tris, 1 mM EDTA, 100 mM NaCl, 1 mM DTT) for 2 h at 4°C. The inclusion body extract was then cleared by centrifugation (16,000 × g, 25 min, 4 °C) and filtered. Histones were then isolated through ion exchange chromatography using a HiTrap SP FF column (GE Healthcare Life Sciences) using a gradient of 0.1 to 1 M NaCl in resuspension buffer over 60 minutes. Fractions were analyzed by SDS-PAGE, and histone-containing fractions were pooled and purified by preparative RP-HPLC utilizing a gradient of 20–73% B over 60 minutes.
Preparation of truncated histones
BL21 (DE3) cells were transformed with plasmids coding for N-terminally 6xHis-SUMO tagged histone H3(14–135, K14C). Expression was performed as described above, and cell pellets were resuspended in 20 mL of denaturing lysis buffer (6 M Gdn.HCl, 50 mM Na2HPO4, 300 mM NaCl, 1% Triton X-100, 5 mM imidazole, 1 mM TCEP, pH 8.0), lysed by sonication and cleared by centrifugation (16,000 × g, 25 min, 4°C). The 6xHis-tagged protein was affinity purified from the lysate by Ni-NTA affinity chromatography. The protein was eluted in elution buffer (6 M Urea, 50 mM Na2HPO4, 250 mM imidazole, 1 mM TCEP pH 7.5) and dialyzed stepwise at 4°C into refolding buffer (50 mM Na2HPO4, 300 mM NaCl, 5 mM DTT, pH 7.5) containing 2 M urea for 4 h, 2 M urea for 18 h and 0 M urea for 4 h. Ulp1 protease was added prior to the final dialysis step to cleave off the 6xHis-SUMO tag. After cleavage, solid Gdn.HCl was added to solubilize the truncated histone that had partially precipitated during proteolysis, and the solubilized mixture was purified directly by preparative RP-HPLC utilizing a gradient of 20–73% B over 60 minutes.
Preparation of modified semisynthetic histones
Full length histones were generated by semisynthesis from two pieces, as described previously29. Briefly, H3 peptide ◻-thioesters (residues 1–13) were incubated with truncated histone H3 (residues 14–135, K14C) in 6 M Gdn.HCl, 0.1 M Na2HPO4, 20 mM TCEP, 0.1 M mercaptophenyl acetic acid at pH 7.5–8.0. Upon completion of the ligation reaction (as judged by HPLC and ESI-MS analysis) the ligation product (H3Q5ser, K14C) was purified by preparative RP-HPLC utilizing a gradient of 20–73% B over 60 minutes. The purified semisynthetic protein was then treated with a solution of 2-bromoethylammonium bromide (50 mM) in 6 M Gdn.HCl, 1 M HEPES, 10 mM methionine, 20 mM DTT, pH 7.8 at 27 °C to convert the non-native cysteine residue into a lysine mimic at position 14 (K14Kc)30. Upon full conversion to the alkylated product, the protein was purified by semi-preparative RP-HPLC utilizing a gradient of 20–73% B over 40 minutes, and its identity and purity validated by HPLC and ESI-MS analyses.
Histone octamer refolding
Histone octamers were formed using established protocols31. Histones were first dissolved in unfolding buffer (6 M guanidinium chloride, 20 mM Tris-HCl, 1 mM DTT, pH 7.9) and their concentration determined by UV-vid absorption at 280 nm. The four histones were combined (1:1:1.1:1.1 molar ratio of H3, H4, H2A and H2B) in unfolding buffer to a final protein concentration of 1 mg/mL. The mixture was repeatedly dialyzed against a refolding buffer (2 M NaCl, 10 mM Tris-HCl, 1 mM EDTA, 1 mM DTT, pH 7.9) at 4 °C for 4, 18, and 4 h. Histones octamers were then purified from aggregates and dimers by size-exclusion chromatography using a Superdex S200 10/300 increase column (GE Healthcare Life Sciences). The fractions were analyzed by SDS-PAGE and pure fractions were pooled, diluted to a final concentration of 50% glycerol and stored at −20 oC.
DNA preparations
An expression plasmid containing multiple copies of the 147 bp Widom 601 DNA sequence32 flanked by EcoRV sites was transformed into DH5α Escherichia coli cells. Following expression and isolation of the plasmid and digestion with EcoRV, monomeric 601 DNA was purified by precipitation with PEG 600033.
Nucleosome reconstitution
MNs were formed using established methods34. Briefly, histone octamers and 601 DNA were mixed in 2 M TEK (20 mM Tris-HCl, 2 M KCl, 0.1 mM EDTA, 1 mM DTT pH 7.5 at 4 °C) and placed in a Slide-A-Lyzer MINI dialysis device (3.5 kDa molecular weight (MW) cutoff, Thermo Fisher Scientific). The solution was dialyzed into 200 ml 1.4 M TEK (10 mM Tris-HCl, 1.4 M KCl, 1 mM DTT, 0.1 mM EDTA, pH 7.5 at 4 °C) at 4°C for 1 h. By use of a peristaltic pump, 330 mL nucleosome was added at a rate of 1 mL/min overnight to 10 mM TEK (10 mM Tris-HCl, 10 mM KCl, 1 mM DTT, 0.1 mM EDTA, pH 7.5 at 4°C). Two subsequent dialysis steps (2 × 3 h) were performed in 200 mL of 10 mM TEK before transferring samples to 1.5 mL microcentrifugation tubes, centrifuging (17,000g, 4 °C, 10 min) and isolating the supernatant. Nucleosome concentrations were quantified by UV absorbance at 260 nm, and nucleosome quality verified by native gel electrophoresis (5% acrylamide, 0.5 × TBE, 120 V, 60 min SYBR Gold nucleic acid stain from Life Technologies).
Enzymatic assays
TGM2-MDC/serotonylation assays (peptides and monomeric histones)
For assessments of TGM2-mediated transamidation of MDC/5-HT to peptides/proteins, 10 μg of Fibrinogen, BSA or recombinant histones/peptides were incubated with 5 mM MDC/5-HT (5 μM 35-HT was used in radioactive assays) and 0.25 ug rTGM2 in a final volume of 25 μL of enzymatic buffer (25 mM Tris-Cl, pH 8 and 5 mM CaCl2, plus protease inhibitors). Reactions were then incubated at RT for 3 hours in the dark. Samples were next heated to 98 °C for 8 min in denaturing sample buffer prior to gel electrophoresis. MDC labeled protein bands could be visualized by fluorescence under UV light, followed by coomassie staining to control for equal protein loading. Radioactive 5-HT transfer was monitored by scintillation counting (post-filter capture).
TGM2-serotonylation/biotin cadaverine assays (mononucleosomes)
Monoaminylation assays were performed by incubating 8 pmol of WT or H3K4me3 MNs with TGM2 (40 nM) in 20 µL enzymatic buffer (25 mM Tris, 10 mM CaCl2, 10 mM DTT, 10 mM KCl, 5 mM serotonin or biotin cadaverine, pH 7.8) for 1 hr at 30oC. Following incubation for 1 hr, the reaction was quenched with a 4X SDS-Loading buffer and analyzed by western blotting utilizing α -H3Q5Ser (1:500 in 3% Milk) or Strep-800 (1:10,000 in 3% TBST), and α-H4 (1:1000 in TBST) to control for loading.
MLL1 complex methyltransferase assays (monomeric histones)
To assess MLL1-mediated methylation activity, 5 ug of protein (H3 vs. H3Q5A) was incubated with 1 μg recombinant MLL1 complex in reaction buffer (50 mM TrisCl pH 8.6, 0.02% Triton X-100, 2 mM MgCl2, 1 mM TCEP, 50 μM SAM for 3 hr at RT. Methylation status was assessed via immunoblotting with an α-H3K4me3 specific antibody.
MLL1 complex methyltransferase assays (mononucleosomes)
Equal concentrations of unmodified vs. Q5ser mononucleosomes were incubated in reaction buffer containing 50 mM TrisCl pH 8.6, 0.02% Triton X-100, 2 mM MgCl2, 1 mM TCEP and 0.2 μM tritiated SAM3 (PerkinElmer NET 155050UC, LOT 2094503) for 3 hours at room temperature. Following incubations, reactions were pipetted onto filter paper squares (1 cm x 1 cm) and allowed to fully dry. Filter papers were subsequently washed 3 times in ice-cold sodium carbonate buffer (0.1 M; pH 8.5) in a large beaker on a magnetic stir plate. Filter papers were again allowed to air dry at room temperature before placing into a scintillation vial containing 5 ml of scintillation fluid. Incorporation of tritiated SAM was measured by liquid scintillation counting (CPM) of tritium (3-H).
LC-MS/MS validation of serotonylated H3 (1–15)
Samples were analyzed by LC-MS/MS (Dionex 3000 coupled to Q-Exactive, Thermo Fisher). Peptides were separated by C-18 chromatography (inner diameter of 75 µm/3µm particles, Nikkyo Technologies, Japan) using a gradient increasing from 1% B to 40% B in 25 minutes (A: 0.1% formic acid, B: acetonitrile in 0.1% formic acid). The mass spectrometer was operated in PRM mode35 (Resolution 35,000, AGC target, 5e5, max. inject time of 60ms and an isolation window of m/z of 2.0). MS was acquired from m/z 300–1650 while m/z = 100 was set as lowest mass for MS/MS. Charge states 2+ to 5+ of the modified and non-modified peptides were targeted. An energy of 25 NCE was used for the quadruply charged peptide: ARTKQTARKSTGGKA-NH2, with and without modification. Extended Data Fig. 2f represents a high resolution, high accuracy tandem mass spectra (sample +5-HT/+TGM2) of the quadruply charged peptide ARTKQTARKSTGGKA-NH2 modified by 5-HT at Gln 5 (m/z 430.4997 [0.12 ppm]). The full amino acid sequence was accounted for. Selected fragment ions used to validate the serotonylated glutamine are annotated (doubly charged y10/y11 and doubly charged b4/b5). We observed a diagnostic fragment ion at m/z 160.07554 corresponding to loss of serotonin minus ammonia (C10H10NO). The findings were further validated by repeating the experiment using deuterated (D4) serotonin. As expected, both precursor and fragments containing D4 serotonin shifted by 4.025 Da (data not shown).
Cellular fractionation
Nuclear, cytosolic and chromatin preparations
Cells were collected and homogenized in 200 μl of ice cold buffer A (10 mM HEPES, pH 7.9, 10 mM KCL, 1.5 mM MgCl2, 0.34 M sucrose, 10% Glycerol, 0.5 mM PMSF) using a 1 ml glass douncer and tight pestle. Homogenized lysates were transferred to 1.5 ml Eppendorf tubes and Triton-X 100 detergent was added to a final concentration of 0.1%. Samples were next incubated on ice for 30 min with intermittent flicking of the tubes every 5 min. After centrifugation at 1300g for 5 min at 4°C, the supernatants were removed and separated into tubes labeled “S1.” The remaining pellets from this first spin were deemed nuclei. The S1 fraction was further clarified by centrifuging at 20,000g for 5 min to remove particulate material (the supernatant = cytosol). The pellet from the first spin was then re-suspended in 200 μl of buffer A (without Triton-X 100) and centrifuged for 5 min to wash. To further fractionate and separate nuclei into chromatin vs. soluble nuclear material, the nuclear pellet was resuspended in 100 μl of buffer B (3 mM EDTA, 0.2 mM EGTA) and incubated on ice for 30 min with flicking every 5 min. Following incubation, the samples were centrifuged, and the supernatants removed as soluble nuclear fraction vs. the pellets, which represent chromatin. Whole cell lysates from tissues were prepared in RIPA buffer. Protein concentrations were determined using the DC™ protein assay (BioRad, cat# 5000111).
Soluble nuclear extract preparation from HeLa cells
Nuclear extracts were prepared from HeLa cells according to Dignam and Roeder36, or were purchased from CilBiotech. Prior to IPs, extracts were dialyzed into the following buffer: Hepes 20 mM, NP40 0.01%, EDTA 0.5 mM, glycerol 10%, KCL 150 mM, PMSF 0.4 mM. Concentrations were determined by DC™ protein assays.
Immunoprecipitations (IPs)
5-PT IPs
5-PT IPs were performed using whole cell, cytosolic, soluble nuclear or chromatin fractions prepared as described (Cellular fractionation section). Using copper click chemistry, the alkyne-functionalized 5-HT derivative, 5-PT, was conjugated to a biotin-azide molecule (Thermo Fisher; cat#B10184) and used to label serotonylated proteins. Following treatments with 5-PT, cellular lysates were prepared in proprietary CLICKiT reaction buffer (Thermo Fisher; cat#C33372). For whole cell lysates, cell pellets were sonicated in 200 μL of buffer. For nuclear, cytosolic and chromatin fractions, samples were resuspended in ~200 μL of reaction buffer. Prior to the addition of CLICK reagents, samples were centrifuged at 16,000g for 5 min to remove insoluble debris. Lysates were then transferred to fresh 1.5 ml centrifuge tubes. In the following order, 0.25 mM biotin azide, 0.1 mM CuSO4, 0.1 mM copper protectant and 50 μL of 1X CLICK additive was added to the lysates, and the final volumes were increased to ~500 μL with CLICK reaction buffer. Samples were allowed to incubate for 2 hr at 4 °C. Magnetic Streptavidin beads (Thermo Fisher, cat#11206D) were next washed twice in PBS, and lightly vortexed for each wash. The reaction volume was further increased to 1 ml with PBS, with 5% removed for input prior to the addition of washed beads. For each IP, 20 μL of bead slurry was used. IPs were rotated at RT for 3 hr. Following incubation, samples were placed on a magnetic stand to allow beads to separate from the supernatants. Using a pipette, the supernatant (flow through) was carefully removed. The beads were then washed by inverting the tubes and lightly vortexing the beads in cold RIPA buffer (10 mM Tris-Cl, pH 8.0, 1 mM EDTA, 1% Triton X-100, 0.1% sodium deoxycholate, 0.1% SDS, 150 mM NaCl, 1 mM PMSF) containing protease inhibitors. This was repeated six times, followed by six washes in cold DPBS to remove excess detergent. After the last wash, sample buffer was added to beads and boiled for 8 min at 98°C, followed by gel electrophoresis and incubation with appropriate primary and secondary antibodies.
Histone tail peptide IPs and associated mass spectrometry
100 μg of each peptide was resuspended with 100 μL of prewashed immobilized Streptavidin beads (DynaBeads™ streptavidin M-280) in 0.01% DPBS/Triton-X 100, followed by incubation overnight rotating at 4°C. For each peptide IP, 40 μl of 50% peptide-bead slurry was added to dialyzed HeLa cells extracts (10 mg/IP, with 2 mM MgCl2 added just prior to the beads) or purified TFIID complex (IPd from Flag-TBP expressing HeLa cells, as previously described4 in binding buffer: 150 mM KCl, 50 mM Tris-HCl at pH 8.0, 1% NP40, 1 mM DTT), and each sample rotated for 4 hr at 4°C. The IPs were then centrifuged for 1 min at 1000 rpm to pellet the beads. Beads were then washed six times in binding buffer substituted with 300 mM KCl (and no MgCl2). For immunoblotting analyses, beads were next washed in cold DPBS and were boiled for 8 min in 30 μl of denaturing sample buffer.
For mass spectrometry analyses, proteins bound to peptides were eluted in 8 M urea/0.1 M ammonium bicarbonate/10 mM DTT. After reduction, cysteines were alkylated in 30 mM iodoacetamide. Proteins were then digested with LysC (LysC, Endoproteinase LysC, Wako Chemicals) in less than 4 M urea, followed by trypsinization (Trypsin Gold, Promega) in less than 2 M Urea. Digestions were halted by adding TFA, and the digests were desalted37 and analyzed by reversed phase nano-LC-MS/MS using a Fusion Lumos (Thermo Scientific) operated in high/high mode.
Data were quantified and searched against Uniprot’s human database (70,246 sequences, March 2016) using ProteomeDiscoverer v. 1.4.0.288 (Thermo Scientific), combined with Mascot v. 2.5.1 (Matrix Science) and MaxQuant v. 1.6.0.1338. Oxidation of methionines and protein N-terminal acetylation were allowed as variable modifications, and all cysteines where treated as being carbamidomethylated. Peptide matches were filtered using a Percolator39, with a calculated FDR of 1%. For quantitative MaxQuant analyses, FDR threshold for peptides were set at 2% and 1% for proteins.
Data analysis: The experiment consisted of 3 peptide conditions (H3, H3K4me3 and H3K4me3Q5ser), each with 4 biological replicates/peptide. Data were processed using Perseus v 1.6.0.740. Reverse matches and potential contaminations were removed. Log2 transformed iBAQ values41 were normalized by median (per sample). For comparisons, it was required that signals be measured in a minimum 3 of the 4 replicates for at least one condition. Missing values were imputed (width: 0.3, downshift: 1.8). First, H3 and H3K4me3 were compared using a t-test (Permutation based FDR of 0.05). Only significant proteins found to be more abundant in the H3K4me3 vs. H3 condition–with a minimum two linear fold difference–were considered for the second analysis (361 proteins): comparison of H3K4me3Q5ser to H3K4Met3 (t-test, Permutation based FDR of 0.05 with S=0.1). All measured proteins and signals, as well as fold differences and p-/q-values are available in Supplementary Data Table 29. Primary data, as well as MaxQuant search results, are uploaded to PRIDE.
LC-MS/MS identification of endogenous H3Q5ser and H3K4me3Q5ser
Sample preparation and targeted MS/MS
Chromatin from RN46A-B14 cells post-differentiation (5 × 10⁶/per), as well as 16-gauge mouse DRN tissue punches (bilateral, 3 animals pooled/sample), were lysed and sonicated as described below in ChIP experiments but without crosslinking. Sonicated chromatin was then incubated with one of our two specific antibodies (H3Q5ser or H3K4me3Q5ser, 7.5 μg/sample) and the marks IPd. On beads, unmodified lysines were derivatized using a 1:3 mixture of propionic anhydride and acetonitrile, as described previously42. The derivatized histones were then digested with trypsin (enzyme:sample ratio = 1:20, 6 hr, RT) in 50 mM NH4HCO3. The peptides were further derivatized twice to propionylate N-termini. Following this, the samples were desalted for LC-MS analysis using C-18 Stage-tips. The acidified samples were separated using a 75 µm ID x 17 cm Reprosil-Pur C18-AQ (3 µm; Dr. Maisch GmbH, Germany) nano-column mounted on an EASY-nLC nanoHPLC (Thermo Scientific, San Jose, Ca, USA). The HPLC gradient was as follows: 2% to 26% solvent B (A = 0.1% formic acid; B = 95% MeCN, 0.1% formic acid) over 45 minutes, from 26% to 80% solvent B in 5 minutes, 80% B for 10 minutes at a flow-rate of 300 nL/min. The nLC was coupled online to an Orbitrap Fusion™ Tribrid ™ mass spectrometer (Thermo Fisher) and data were acquired using targeted data-independent acquisition (DIA). Full scan MS (m/z 300−1100) was acquired in the Orbitrap with a resolution of 60,000 and an AGC target of 2 × 10e5. MS/MS was performed in the ion trap with sequential isolation windows of 50 m/z with an AGC target of 1 × 10e4, a HCD collision energy of 32 and a maximum injection time of 50 msec. MS/MS data were collected in centroid mode. Targeted MS/MS was performed for endogenous Q5ser or K4me3Q5ser marks and D5-propionylated heavy spike-in synthetic peptides. Data were manually searched and the low abundance endogenous peptides were identified using heavy spike-in controls.
Note on the lack of stoichiometry assessments
Obtaining accurate assessments of stoichiometry represents a complex task, as every detection method contains intrinsic biases. Mass spectrometry, despite its high accuracy and sensitivity, is no exception. In fact, almost all MS experiments define only relative abundances and relative changes in PTM state.
To appropriately define stoichiometries for H3Q5ser and H3K4me3Q5ser, one would need to accurately estimate the molarity not only of the modifications themselves, but also molarities for all other modified states of this peptide (e.g., unmodified, H3K4me1, H3K4me2, H3K4me3, H3K4ac and all combinations with H3Q5ser). This task is possible when all synthetic peptide equivalents are synthesized and spiked-in at known molarities. However, this also requires that all forms of a given peptide are detectable within the same sample, as histones from different sample types will present with variable backgrounds and different sensitivities. In the case of the serotonyl modifications, such an experiment is prohibitive, since detection of H3Q5ser/H3K4me3Q5ser peptides requires enrichment using site-specific antibodies, thus creating bias in the quantification of other non-enriched modified forms.
For stoichiometric assessments of these marks, one would need to compare the area under the curve from H3Q5ser containing peptide peaks with other low-level detected marks from the same peptide, such as H3K4me3. Generally, non-enriched histone peptides analyzed by MS in data-(in)dependent acquisition modes give abundances of 0.002–0.01% for the H3K4me3 mark relative to all H3 (3–8) peptides (unmodified+H3K4me1+H3K4me2+H3K4me3+H3K4ac). For RN46A-B14 cells and mouse DRN, we injected 1–3 ug of histone peptides. ~1 ug is the lowest total histone peptide amount that one can inject, as low abundance marks, such as H3K4me3, are present at only ~0.00000084% of the total histone peptides in such a mix, and 3 ug is the most that can be injected in a nanoflow LC without clogging the C18 column and creating chromatographic anomalies. We increased the selectivity and sensitivity of detection of serotonyl species by performing targeted MS for m/z corresponding to endogenous Q5ser or K4me3Q5ser peptides. Since the signal intensity of the serotonylated peptides was low and often in the range of noise, we increased the specificity of detection by using D5-labeled synthetic versions of these peptides as elution time controls. We confirmed that the low level signal corresponding to m/z of serotonylated H3 (3–8) peptides obtained in full MS was indeed the correct species by looking at MS/MS for the specific fragment ions within a 0.02 tolerance limit. Under these conditions, serotonyl peptides were not be detected in non-enriched samples. Thus, for a representative sample with ~0.005% abundance of H3K4me3 relative to all other peptides of H3 (3–8 amino acids), we deduce that H3Q5ser and H3K4me3Q5ser are lower in abundance; however, the degree to which they differ cannot be accurately defined.
When the marks are IP’d, endogenous Q5ser and K4me3Q5ser peptides are detected passing all criteria discussed above. However, information about other H3 (3–8) peptides is lost throughout this process and relative stoichiometries cannot be inferred. Until technology exists that allows for enrichment of all modified forms of this peptide with equal affinity in a single step, stoichiometry cannot be measured. Finally, while the serotonyl marks are not of high abundance in vivo (at least in comparison to some other forms of this peptide–e.g., unmodified H3 3–8), we remain confident in its functional significance as a combinatorial potentiator of binding interactions with H3K4me3, itself a low abundance modification of great importance.
Western blotting
Proteins were electrophoresed on 18% or 4–12% NuPAGE™ Bis-Tris Protein Gels (Invitrogen) and transferred to nitrocellulose membranes. Efficient transfer was always confirmed with direct blue staining (0.1% stock aqueous solution in milliQ water) before being incubated with primary antibodies (listed below) overnight at 4 °C (all membranes were blocked in 5% milk or 5% BSA depending on the primary antibody used). For competition assays, antibodies were pre-incubated with indicated peptides at a 5:1 concentration of peptide to antibody for 1 hr at RT. Following pre-incubation with peptides, membranes were incubated with antibody/peptide overnight at RT.
Membranes were then washed and incubated with peroxidase-labeled secondary antibodies (1:2000–1:10,000 depending on the primary antibody used). Bands were visualized using Immobilon Western Chemiluminescent HRP Substrate (Millipore). Where appropriate, bands were quantified with NIH Image J Software and bands were normalized to total histone H3 to control for equal loading.
Peptide dot blots
Peptides were dotted in titration onto nitrocellulose membranes. Membranes were left to dry for approximately 1 hr until subsequently rehydrating in DPBS and staining for equal peptide loading with direct blue. Membranes were then blocked in 5% milk-PBST and incubated with appropriate primary and secondary antibodies.
Antibodies
All primary antibodies used in this study were validated, where appropriate, for use in ChIP, immunoblotting and/or immunocytochemistry (ICC)/immunohistochemistry (IHC) experiments: H3 general (Abcam ab1791; lot#GR293151–1–1:10,000), H3K4me3 (Abcam ab8580; Lot#GR273043–6–1:1,000), H3Q5ser (Millipore 4191a; lot#RA1690–1:500), H3K4me3Q5ser (Millipore 4491a; Lot#RA1608107–1:500), H3K27me3 (Cell Signaling 9733S; Lot#8/used for ChIP-seq), TGM2 (Abcam ab2386; Lot#GR312304–3–1:500), TAF2 (Bethyl A302–132A–1:500), TAF3 (Abcam ab188332; Lot#GR220332–1/used for blotting–1:500), TAF3 (Millipore 07–1802; Lot#3008423/used for ChIP-seq), TBP (Abcam ab8181; lot#GR300917–3–1:1,000), H4 (Abcam ab10158; Lot#GR239048–1–1:1,000), H2A (Abcam ab88770; Lot#GR197571–1–1:1,000), H2B (Abcam ab1790; Lot#GR188969–2–1:1,000), HA (Abcam ab9134; Lot#GR4307–10, or HA-488 Alexa Fluor SC-805; lot#K1716–1:1,000), Tph2 (Abcam ab111828; Lot#GR266431–6, or Millipore, sheep–1:1,000), NeuN (Millipore MAB377; Lot#2683919–1:1,000) and 5-HT (Sigma S5545; Lot#033M4805, or Protos Biotech, rabbit–1:1,000), RFP (Abcam ab65856; lot#GR3181906–1–1:1,000), MAP2 (Abcam, chicken–1:1,000). The TAF5 and TAF7 antibodies were kindly provided by Dr. Robert Roeder (The Rockefeller University–1:500).
ICC/IHC
ICC
To assess potential cell permeabilizing properties of 5-PT, HeLa cells were cultured in a 12-well tissue culture plates. Upon reaching ~80% confluency, growth media was aspirated and 5-PT (500μM) was applied in pre-warmed DMEM media (10% FBS and 1% pen/strep) and allowed to incubate for 3 hr at 37°C. As a negative control, cells that were not treated with 5-PT (vehicle only) were also assessed. After incubation, media was removed from each well and 500 μl of 3.7% formaldehyde in DPBS was added for 15 min at RT. Fixative was then removed and wells washed twice with 3% BSA in DPBS. For cell permeabilization, 500 μl of 0.5% Triton X-100 in DPBS was added to each well and incubated for 20 min at RT. Wells were subsequently washed with 3% BSA in DPBS. A reaction cocktail consisting of 5 μM Alexa Fluor picolyl azide™ (Thermo Fisher; cat#C10641) in Click-iT™ reaction buffer containing 0.1 mM copper sulphate and copper sulfate protectant premix (50:50) was added to each well including the negative control. The plate was then incubated for 30 min at RT and protected from light. The reaction mixture was next removed and wells washed again with 3% BSA in DPBS. Final wash solution was removed and cells were incubated with DAPI as a nuclear co-stain. hPSC/5-HT neuron and RN46A-B14 cell ICC was performed using standard protocols. Immunofluorescence was visualized using a confocal microscope (Zeiss LSM 780 or Zeiss Airy Scan microscope).
IHC
Brains were collected from mouse following transcardiac perfusion with sterile PBS and 2% paraformaldehyde (PFA). Brains were further post-fixed in 2% PFA for 24 hr and incubated in 30% sucrose for an additional 2 days. Fixed brains were sectioned at 40 μm using a Leica CM3050 S cryostat. Free floating DRN sections were washed in 1X TBS and then blocked for 1 hr at RT. Brain sections were then incubated with the following primary antibodies at RT overnight: H3K4me3Q5ser (1:250), NeuN (1:1000), TPH2 (Abcam ab121013; 1:250) and 5-HT (1:5000). Sections were then washed 3X in TBS and incubated with Alexa Fluor® secondary antibodies (1:500) overnight at 4°C. DAPI was used as a nuclear co-stain. Immunofluorescence was visualized using a confocal microscope (Zeiss LSM 780).
RNA isolation and qPCR
Cell pellets and tissues were homogenized in Trizol (Thermo Fisher; cat#15596026) and processed according to the manufacturer’s instructions. RNeasy Microcolumns (Qiagen; cat#74004) were used to further purify RNA, and a nanodrop spectrophotometer confirmed RNA 260/280 and 260/230 ratios to be >1.8. RNA was reverse transcribed using a BioRad iScript Kit (cat# 1708891). cDNA was quantified by qPCR using SYBR Green. Each reaction was run in technical duplicate or triplicate and analyzed following the ΔΔCt method, as previously described using an appropriate normalization control43. Primer sequences can be found in Supplementary Data Table 34.
Chromatin immunoprecipitation (ChIP)
Brain tissues and cell pellets (10 × 106/n) tissues were crosslinked and quenched. Samples were washed thoroughly before being subjected to lysis and sonication, exactly as previously descibed24. Samples were then incubated with specific antibodies (7.5 μg/sample) bound to M-280 Dynabeads on a rotator at 4°C overnight. The following day, immunoprecipitates were washed, eluted and reverse crosslinked. Following RNA and protein digestion, DNA fragments were purified using a Qiagen PCR purification kit.
Library preparation
Following DNA and RNA purifications, RNA-seq and ChIP-seq libraries were prepared according to Illumina protocols and sequenced on an Illumina HiSeq2500 or 4000 Sequencer_High Output mode v4.
ChIP-seq peak calling and differential analysis
For H3K4me3, H3K4me3Q5ser and Taf3 ChIP-seq in RN46A-B14 cells, raw sequencing reads were aligned to the rat genome (rn6) using default settings of Bowtiev2.2.0. Only uniquely mapped reads were retained. Alignments were filtered using SAMtoolsv0.1.19 to remove duplicated reads. Peak-calling–normalized to respective inputs–was performed using MACSv2.1.144 with default settings and filtered for FDR < 0.05 and fold change > 1.2; the window size was set as 300 bp. Raw sequencing reads from mouse brains (H3K4me3 vs. H3K4me3Q5ser) were aligned to the mouse genome (mm10) using default settings of HISATv0.1.6b. Only uniquely mapped reads were retained. Alignments were filtered using SAMtoolsv0.1.19 to remove duplicate reads, and peak-calling–normalized to respective inputs–was performed using MACSv2.1.1 with default settings and filtered for FDR < 0.05 and fold change > 1.2. Raw sequencing reads from human PSCs vs. 5-HT neurons (H3K4me3Q5ser) were aligned to the human genome (hg38) using default settings of HISAT2v2.1.0. Again, only uniquely mapped reads were retained. Alignments were filtered using SAMtoolsv1.8 to remove duplicated reads, and peak-calling–normalized to respective inputs–was performed using MACSv2.1.1 with default settings and filtered for FDR < 0.05 and fold change > 1.2. Differential analyses of H3K4me3 and H3K4me3Q5ser (for all cells/tissues examined) were performed using diffReps19 with a window size of 1 kb. A default q-value cutoff of 0.05 was used, followed by a fold change cutoff of 1.2. Peaks and differential sites were further annotated to nearby genes or intergenic regions using the region analysis tool from the diffReps package.
RNA-seq analysis and correlations with ChIP-seq
Raw sequencing reads from RN46A-B14 cells were mapped to rn6 using TopHat2v2.1.045. Counts of reads mapping to genes were obtained using HTSeq-count against Ensembl v81 annotation. Differential expression analysis was done using the DESeq2 package46 (v1.6.3) at an FDR cutoff of 0.05. Raw RNA-seq reads obtained from mouse brains were mapped to mm10 using HISAT v0.1.6b. StringTie v1.2.1 was used to obtain gene-level FPKM values against Ensembl v84. Raw RNA-seq reads obtained from human cells were mapped to the human genome (hg38) using HISAT2v2.1.0. Counts of reads mapping to genes were obtained using HTSeq-count against Ensembl v90 annotation. Differential expression analysis was done using the DESeq2 package (v1.6.3), again with a FDR<0.05 cutoff. RNA-seq differential lists were compared to ChIP-seq differential lists based on gene names, and heat maps were drawn using the GeneOverlap (https://github.com/shenlab-sinai/geneoverlap/) package. Note that a more conservative fold change cutoff of > 2.5 was used to generate odds ratio heat maps for 5-HT neuron/PSC diffReps vs. gene expression in order to avoid including false positive ‘down’ events in selected comparisons.
Constructs/viruses
H3.3 (wildtype vs. Q5A)-Flag-HA(C-Ter) was cloned into a pCDH-RFP vector by PCR and enzyme restriction digestion. Purified plasmids were sent to GENEWIZ for sequence validation. H3.3-pCDH-RFP plasmids were then sent to Cyagen Biosciences for lentiviral packaging. pShooter pCMV/nuc/myc vectors expressing NLS-tagged wildtype or mutant (W241A) human TGM247 were kindly provided by Dr. Gail Johnson (University of Rochester Medical Center).
RN46A-B14 viral infections
Pre-differentiation, RN46A-B14 cells were split and seeded at ~0.7–0.8 ×10⁶ density on 10 cm tissue culture plates coated with matrigel and grown in previously described differentiation medium. On day 1, cells were transduced with either lenti-H3.3 WT or lenti-H3.3Q5A (1:1,000 dilution) in growth media. On day 4, cells underwent a conditioned media change (1:1). Post-differentiation, RN46A-B14 cells were either collected with 0.05% Trypsin by centrifugation, washed several times and reconstituted in calcium-free Dulbecco’s PBS (DPBS) on ice for RNA-seq, or fixed on coverslips for microscopy assessments.
RN46A-B14 neurite length assessments
Neurite outgrowth assays were performed on virally infected, fixed cells that were stained using antibodies for RFP, HA and DAPI (RFP was used for length assessments). Cells were imaged in a blinded fashion. Since RN46A-B14 cells grow in a linear, rod-like conformation, the total neurite length (i.e., the sum of the length of each cell) was measured using ImageJ software.
General statistics and study design
One-way ANOVAs were performed to determine significance for experiments involving more than two treatment conditions (with subsequent Dunnett’s post hoc tests). Two-tailed student’s t-tests were used for all other statistical comparisons, with the exception of Tgm2i qPCRs in Extended Data Fig. 8g (one-tailed student’s t-tests were used). For data presented without statistics, experiments were repeated multiple times (often ≥ 3) to ensure reproducibility, unless otherwise stated. All data involving statistics are presented as means ± SEM.
Sample size, randomization and blinding
Adequate sample sizes were determined based upon inter-sample variability. Throughout the manuscript, we determined the significance of results based upon a general confidence interval of 95%. Where appropriate, cells or animals were randomly assigned to groups (segregated by differentiation conditions, chemical compound/drug/viral treatments and/or genotype). Furthermore, tissues collected from animals for ChIP-seq analyses were randomly pooled to provide ample tissue for biochemical procedures and to minimize variance. Where necessary, investigators were blinded to conditions such as genotype, viral treatment conditions, etc.
Data Availability
Data from ChIP- and RNA-seq experiments have been deposited in the National Center for Biotechnology Information Gene Expression Omnibus (GEO) database under accession numbers GSE106495 and GSE117910. The mass spectrometry proteomics data have been deposited in the ProteomeXchange Consortium via the PRIDE48,49 partner repository with the dataset identifier PXD008106. Additional raw data files are available on https://chorusproject.org under project no. 1513. We declare that the data supporting findings for this study are available within the article and Supplementary Information (Supplementary Figure 1). Related data are available from the corresponding author upon reasonable request. No restrictions on data availability apply.
Extended Data
Extended Data Figure 1. Bioorthogonal labeling by 5-PT identifies H3 serotonylation in chromatin.
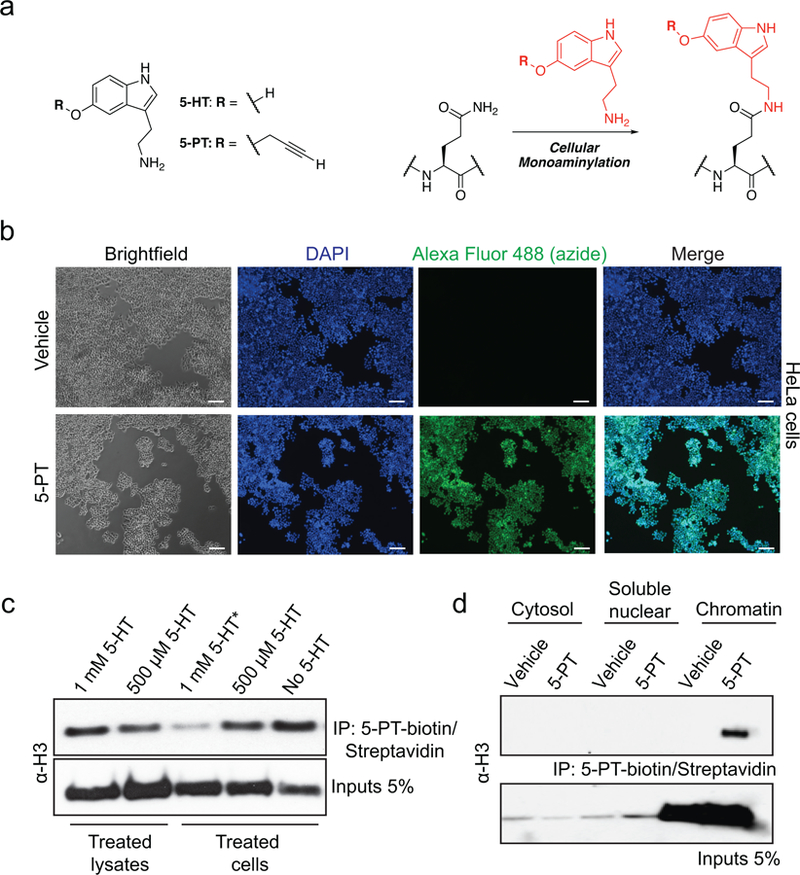
a, Structures of 5-HT and 5-PT in transamidation reactions. b, Immunofluorescence images (Scale bars equal 500 μm) of intracellular 5-PT in HeLa cells (bottom) after exogenous application of the molecule (vs. vehicle, top). Intracellular 5-PT was imaged in fixed cells after chemical labeling with Alexa Fluor 488 azide. DAPI was used as a nuclear co-stain. Results confirmed in ≥ 2 independent experiments. c, Cell vs. lysate donor competition assays indicating that application of excess 5-HT to live HeLa cells, but not to processed lysates, prior to chemical labeling and 5-PT-based pulldowns results in loss of H3 signal post-IP. Input and IP WBs are shown. d, Cellular fractionation analysis (WB) identifying H3 serotonylation post-IP in HeLa cell chromatin, but not in soluble nuclear or cytosolic fractions. Input and IP WBs are shown. H3 results confirmed in ≥ 3 independent experiments.
Extended Data Figure 2. TGM2 is both necessary and sufficient to promote H3 serotonylation in cells.
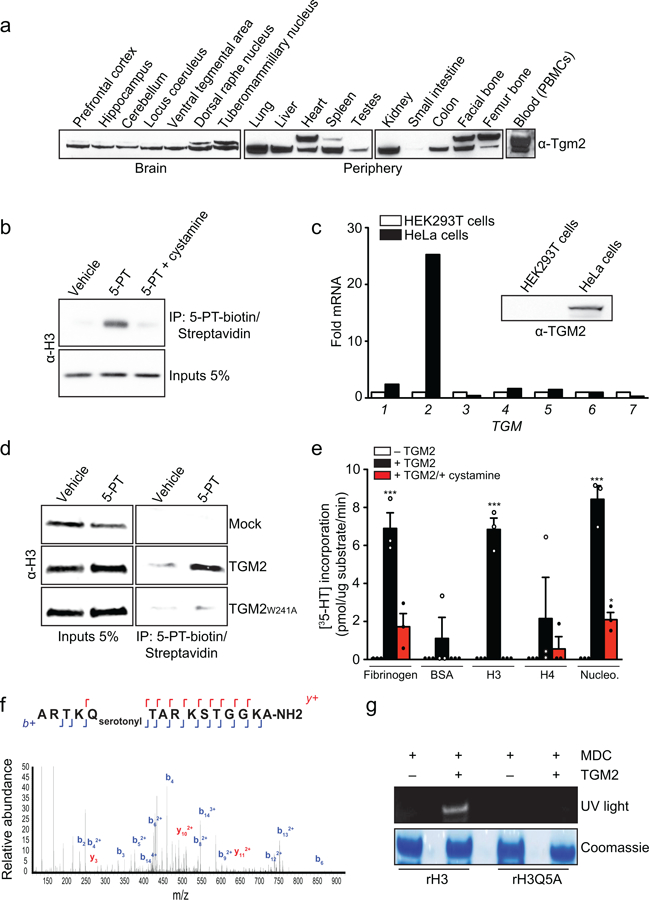
a, WB analysis of Tgm2 expression across mouse brain and peripheral tissues (including blood) validate Tgm2 as a ubiquitously expressed enzyme in mammals. While two isoforms of Tgm2 exist and are expressed differentially across tissues, the functions of these two variants remain unknown (n=1/brain region or organ tissue). b, Bioorthogonal labeling of 5-PT modified H3 from HeLa cell extracts in the absence or presence of the transglutaminase inhibitor cystamine (4 mM). Input and IP WBs are shown. Results confirmed in ≥ 2 independent experiments. c, qPCR analysis of TGM genes comparing HeLa vs. HEK293T cells (n=1/cell type). Insert WB validating that TGM2 is differentially expressed across cell types. d, Bioorthogonal labeling of 5-PT modified H3 from mock (non-transfected) vs. nuclear expression of TGM2 in HEK293T cell extracts. Catalytically dead (W241A) TGM2 was used as a negative control. Input and IP WBs are shown. Results confirmed in ≥ 2 independent experiments. e, Recombinant histones (H3 vs. H4) and reconstituted nucleosomes, as well as Fibrinogen (positive control) and bovine serum albumin (BSA–negative control), were subjected to radioactive serotonylation (35-HT) reactions in vitro (n=3), in the absence or presence of cystamine (one-way ANOVA, Dunnett’s post hoc; Fibrinogen – F2,6=33.47, ***p=0.0006, BSA - F2,6=1.000, p=0.4219, H3 - F2,6=130.0, ****p<0.0001, H4 - F2,6=0.7345, p=0.5184, Nucleosomes - F2,6=88.52, ****p<0.0001). f, LC-MS/MS analysis of a TGM2 transamidated H3 peptide (1–15) identifying glutamine 5 as a substrate for serotonylation. The y and b series indicate peptide fragments at amide bonds. Results confirmed in ≥ 2 independent experiments. g, TGM2 monoaminylation assays examining MDC transfer to wildtype rH3 vs. H3Q5A indicating Q5 as a dominant reactive aa substrate for H3. CS of loading is shown. H3 results confirmed in ≥3 independent experiments. Data are presented as averages ± SEM.
Extended Data Figure 3. Histone semisynthesis and nucleosome assembly.
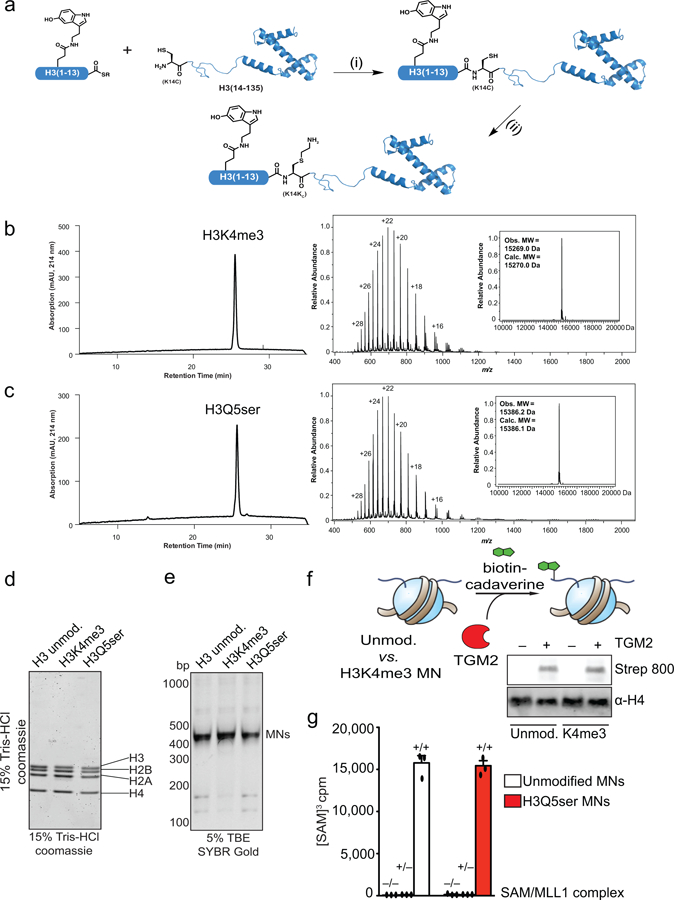
a, Representative semisynthesis of serotonylated histone H3 comprising (i) native chemical ligation between the serotonylated H3(1–13) ◻-thioester and a truncated histone H3(14–135), followed by (ii) cysteine alkylation to give K14thialysine. RP-HPLC and MS characterization of semisynthetic histone proteins, including b, H3K4me3 and c, H3Q5Ser. Purified proteins were eluted from a C18 RP-HPLC column using a gradient of 0–73% Solvent B (0.1% TFA in 9:1 acetonitrile/water) in Solvent A (0.1% TFA in water) detecting absorption at 214 nm. Mass spectra of purified proteins were deconvoluted (inset) and observed vs. calculated masses are shown. Results confirmed in ≥ 3 independent experiments. Validation of d, octamer and e, mononucleosome assembly post-semisynthesis of unmodified, K4me3 and Q5ser proteins. Results confirmed in ≥ 3 independent experiments. f, TGM2 monoaminylation assays on unmodified vs. H3K4me3 nucleosomes using biotin cadaverine in place of 5-HT (n=3, two-tailed Student’s t-test; t4=0.500, p=0.64). H4 is provided as a loading control. g, MLL1 complex methyltransferase assays on unmodified vs. Q5ser mononucleosmes (–SAM/–MLL1, +SAM/–MLL1 and +SAM/+MLL1; n=3, two-tailed Student’s t-test +/+ vs. +/+; t4=0.3100, p=0.76). Data are presented as averages ± SEM.
Extended Data Figure 4. H3Q5ser and H3K4me3Q5ser antibody validations.
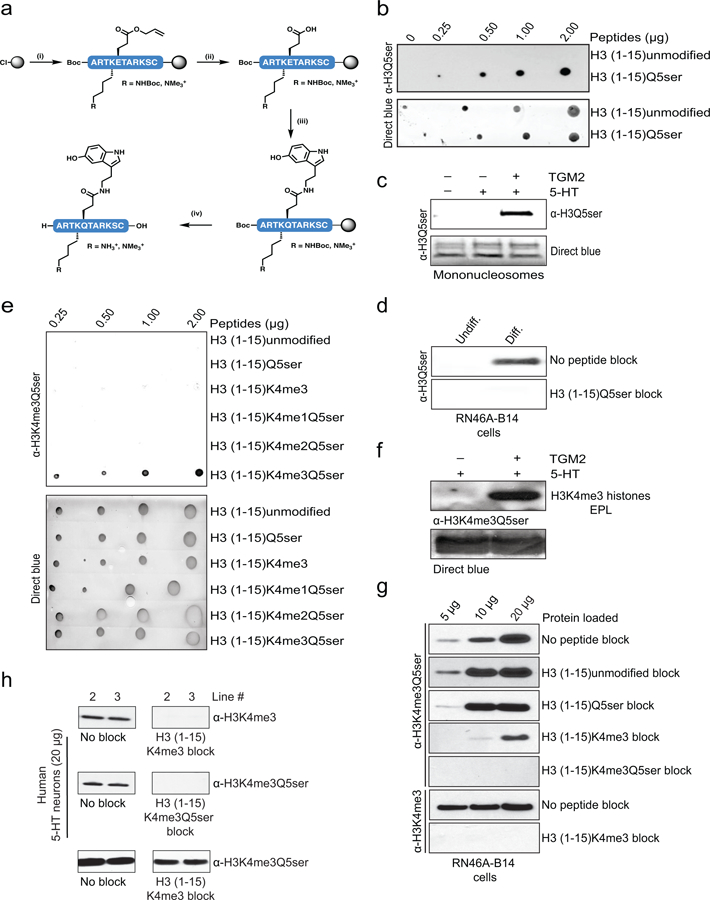
a, Synthesis of peptide antigens on 2-Cl trityl resin by (i) iterative Fmoc solid-phase peptide synthesis incorporating Fmoc-Glu(OAII)-OH at position 5 and either Fmoc-Lys(Boc)-OH or Fmoc-Lys(me3)-OH at position 4, (ii) followed by Pd(0) deallylation, (iii) 5-HT coupling and (iv) acidolytic cleavage from the resin and global deprotection. Side-chain protecting groups are omitted for clarity. b, Peptide dot blot titrations testing the α-H3Q5ser antibody’s reactivity against unmodified vs. Q5ser peptides; note that linear signal was only observed with the Q5ser peptide. Direct blue (DB) staining was used to control for peptide loading. c, WB analysis of TGM2 serotonylation assays on unmodified mononucleosomes revealing that the α-H3Q5ser antibody only detects signal when the nucleosomes have been transamidated with 5-HT. DB staining was used to control for protein loading. d, Peptide competition WB analysis of lysates from RN46A-B14 cells indicating the specificity of our α-H3Q5ser antibody. e, Peptide dot blot titrations testing the α-H3K4me3Q5ser antibody’s reactivity against various peptides; note that linear signal was only observed with the K4me3Q5ser peptide. Direct blue (DB) staining was used to control for peptide loading. f, WB analysis of TGM2 serotonylation assays on monomeric K4me3 (EPL) H3 revealing that the α-H3K4me3Q5ser antibody only detects signal when the K4me3 histone has been transamidated with 5-HT. DB staining was used to control for protein loading. g, Peptide competition WB analysis of lysates from RN46A-B14 cells indicating the specificity of our α-H3K4me3Q5ser antibody in vivo; note that a minimum of 20 μg protein was loaded for all other comparisons made throughout the study. h, Peptide competition WB analysis of lysates from hPSC-derived 5-HT neurons indicating the specificity of our α-H3K4me3Q5ser antibody in human cells. For experiments in b-h, similar results were confirmed in ≥ 2 independent experiments/assay.
Extended Data Figure 5. LC-MS/MS identification of H3 serotonylation in cells and brain.
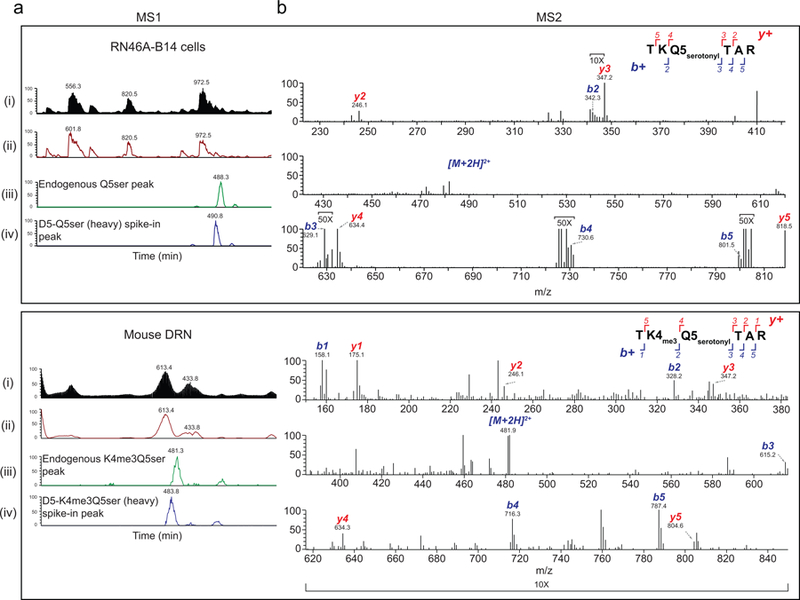
LC-MS/MS analysis of endogenous and synthetic (N-terminally labeled with D5) H3Q5ser/H3K4me3Q5ser peptides in RN46A-B14 cells (post-differentiation, top) and brain (mouse DRN, bottom) following IP using our α-H3Q5ser and α-H3K4me3Q5ser antibodies, respectively. a, LC-MS (MS1) chromatograms showing elution profiles for the samples including the endogenous peptide vs. a synthetic peptide standard. From top to bottom, (i) Total Ion Current chromatogram (TIC) depicting the summed intensity of all signals; (ii) base peak chromatogram showing the intensity of the top signal; (iii) extracted ion chromatogram of the m/z of the endogenous peptide; (iv) extracted ion chromatogram of the m/z value of the synthetic, heavy labeled peptide. b, MS/MS (MS2) spectrum (aligned by m/z, and magnified where indicated on either side of the precursor ion) of the H3Q5ser and H3K4me3Q5ser peptides obtained by HCD fragmentation. b+ and y+ fragment ions were annotated manually, and the top insets show good coverage. Results confirmed in ≥ 2 independent experiments (RN46A-B14 cells pre- vs. post-differentiation and/or in mouse brain).
Extended Data Figure 6. Euchromatic H3K4me3Q5ser distribution in DRN.
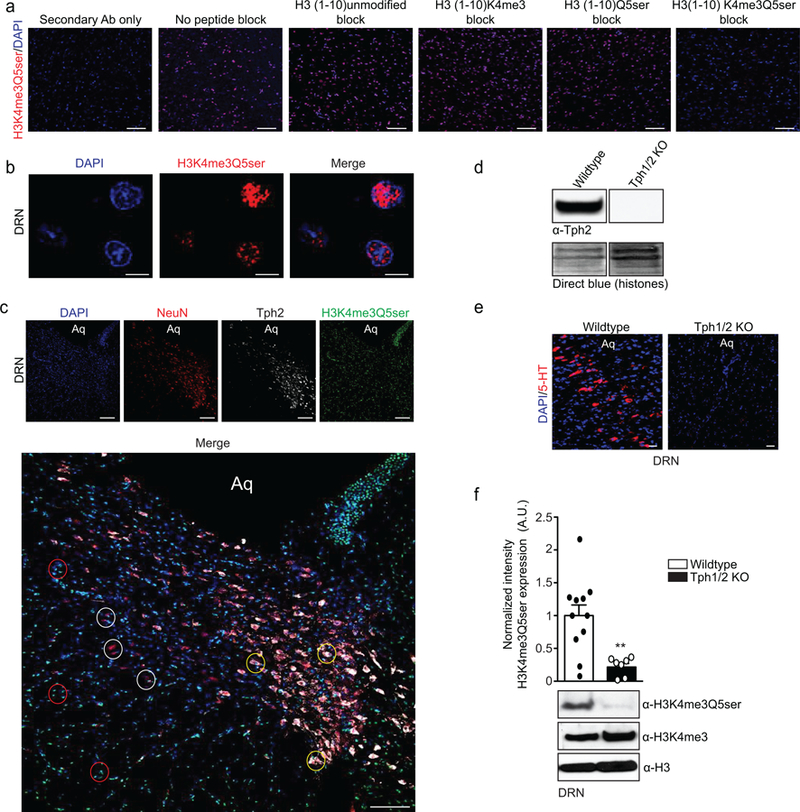
a, Immunofluorescence images (scale bars equal 100 μm) of H3K4me3Q5ser in brain (DRN) –/+ peptide competition, as indicated. DAPI was used as a nuclear co-stain, and a secondary antibody only control is also included. b, Immunofluorescence images (scale bars equal 10 μm) of H3K4me3Q5ser in DRN (no peptide block) revealing a euchromatic distribution pattern in the nucleus with near total exclusion from DAPI rich chromocenters typical of neurons. c, Immunofluorescence images (scale bars equal 100 μm) of H3K4me3Q5ser in DRN, counter stained with DAPI, NeuN (a neuronal cell marker) and Tph2 (a marker of serotonergic neurons). Merged images reveal that H3K4me3Q5ser is not only expressed in serotonergic neurons (NeuN+/Tph2+, yellow circles), but also in non-serotonergic neurons (NeuN+/Tph2–, white circles) and in non-neuronal cells (NeuN–/Tph2–, red circles). Aq = aqueduct. d, WB validation of Tph2 KO in DRN of Tph1/2 KO mice. DB was used to control for loading. e, Immunofluorescence validation of 5-HT depletion in DRN of Tph1/2 KO mice vs. wildtype littermate controls (scale bars equal 100 μm). For all immunofluorescence experiments (a-e), results were confirmed in ≥ 2 independent experiments. f, WB validation that Tph1/2 KO results in loss of H3K4me3Q5ser signal in DRN (n=11 wildtype vs. n=7 Tph1/2 KO, two-tailed Student’s t-test; t16=3.425, **p=0.0035); no effects on H3K4me3 or total H3 expression were observed. Data presented as average ± SEM.
Extended Data Figure 7. H3K4me3Q5ser positively correlates with gene expression in developing mouse brain.
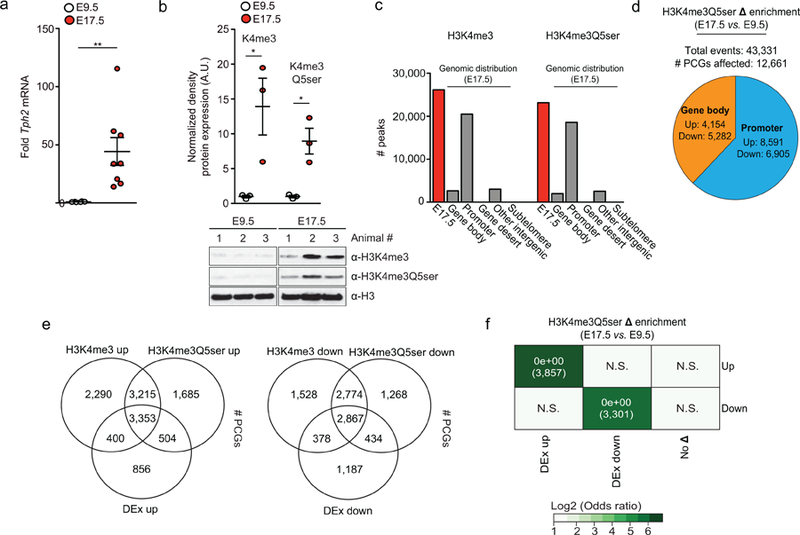
a, qPCR analysis of Tph2 gene expression in embryonic mouse brain (E9.5/n=6 vs. E17.5 n=8, two-tailed Student’s t-test; t12=3.100, **p=0.0092). Actin was used as a normalization control. b, Quantitative WB analysis of H3K4me3 and H3K4me3Q5ser expression in embryonic mouse brain at E9.5 vs. E17.5 (two-tailed Student’s t-test, two-sided, n=3 independent biological replicates/age; K4me3 – t4=3.168, *p=0.0339, K4me3Q5ser - t4=4.277, *p=0.0129). H3 was used a loading control. c, MACSv2.1.1-based peak calling for H3K4me3 vs. H3K4me3Q5ser ChIP-seq data in embryonic mouse brain at E17.5 (FDR<0.05, FC>1.2 cutoffs applied after adjusting for multiple comparisons–n=3 independent biological replicates/age). d, Analysis of H3K4me3Q5ser differential enrichment comparing E17.5 vs. E9.5 embryonic mouse brain using diffReps (FDR<0.05, FC>1.2 cutoffs applied after adjusting for multiple comparisons–n=3 independent biological replicates/age). Pie chart indicates distribution of genic differential enrichment events for the mark comparing promoter vs. gene body regions. e, Overlap of differential enrichment events at protein-coding genes for H3K4me3 and H3K4me3Q5ser vs. differential gene expression (DEx) during mouse brain development indicates significant associations between the two marks, as well as positive correlations with gene expression. f, Odds ratio analysis (using Fisher’s exact tests) of overlapping genes displaying differential H3K4me3Q5ser enrichment vs. differential gene expression (DEx, n=3 independent biological replicates/age, FDR<0.05 cutoff applied after adjusting for multiple comparisons) indicating positive correlations between mark enrichment and permissive gene expression during development. Insert numbers indicate respective p values for associations, followed by the number of protein-coding genes overlapping per significant category. Data presented as average ± SEM.
Extended Data Figure 8. Functional validations of H3 serotonyl’s role in permissive gene expression.
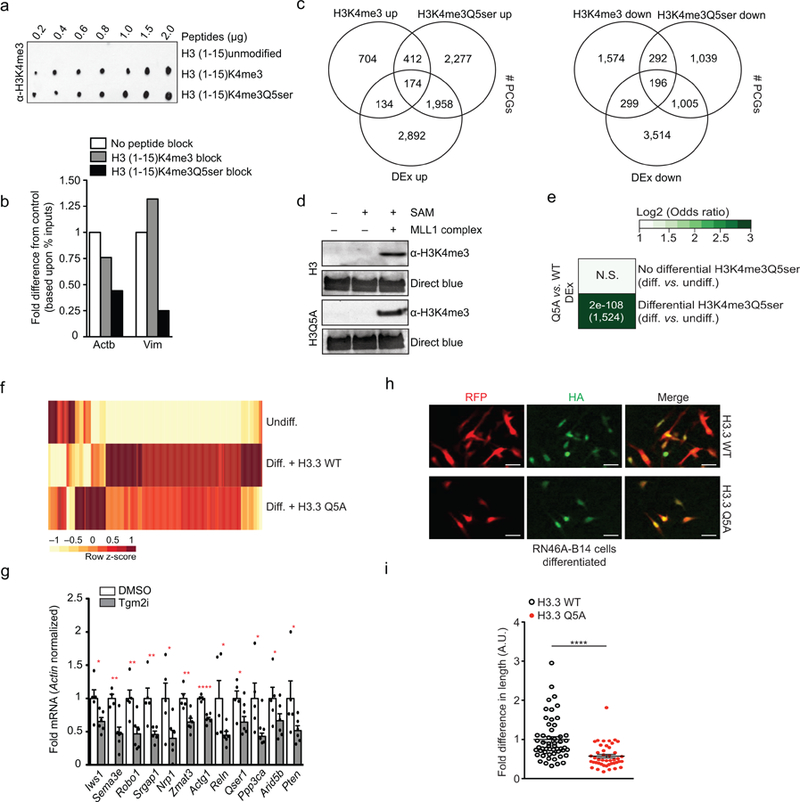
a, Peptide dot blot titrations testing the ability of the α-H3K4me3 antibody to detect the mark in the absence or presence of Q5ser; note that Q5ser does not occlude antibody recognition of the mark. Results confirmed in ≥ 2 independent experiments. b, Peptide competition qChIP validation of H3K4me3Q5ser’s enrichment at two target loci (Actb and Vim) identified via ChIP-seq in RN46A-B14 cells (undifferentiated, n=1/group). c, Overlap of differential enrichment events at protein-coding genes for H3K4me3 and H3K4me3Q5ser vs. differential gene expression (DEx) in response to RN46A-B14 cell differentiation indicates positive correlations between H3K4me3Q5ser gene expression in the absence of significant changes in H3K4me3 enrichment (FDR<0.05, FC>1.2 cutoffs applied after adjusting for multiple comparisons–n=3 independent biological replicates/differentiation state/antibody). d, Recombinant methylation assays (MLL1 complex mediated) on wildtype H3 vs. H3Q5A, followed by WB for H3K4me3, indicating that the Q5A mutation does not affect methylation capacity at K4. DB was used to control for protein loading. Results confirmed in ≥ 2 independent experiments. e, Odds ratio analysis (using Fisher’s exact tests) of overlapping genes displaying differential H3K4me3Q5ser enrichment (or not) vs. differential gene expression [DEx, n=5 (H3.3 WT) vs. 6 (H3.3Q5A) independent biological replicates/virus], FDR<0.05 cutoff applied after adjusting for multiple comparisons) comparing differentiated RN46A-B14 cells expressing either H3.3 WT or H3.3Q5A. Insert numbers indicate respective p values for associations, followed by the number of protein-coding genes overlapping per significant category. f, Heat map of RNA-seq data comparing undifferentiated vs. differentiated (n=5 H3.3 WT vs. 6 H3.3Q5A expressing) RN46A-B14 cells using normalized RNA expression values (averaged between replicates) to generate z-scores for each row. Represented are those genes that displayed differential enrichment during differentiation, along with altered gene expression (see Fig. 3), along with opposing regulation in the context of H3.3Q5A. These genes were found to significantly enrich for pathways associated with axon guidance signaling via Kegg Analysis (see Supplementary Data Table 28). g, qPCR analysis of candidate gene expression in RN46A-B14 cells (n=5 DMSO vs. 6 LDN 27219/Tgm2i; one-tailed student’s t-test; Iws1: t9=2.559, *p=0.0154, Sema3e: t8=3.982, **p=0.0020, Robo1: t9=3.344, **p=0.0043, Srgap1: t8=3.312, **p=0.0053, Nrp1: t9=2.452, *p=0.0183, Zmat3: t9=3.820, **p=0.0020, Actg1: t8=7.836, ****p<0.0001, Reln: t9=2.209, *p=0.0273, Qser1: t8=2.513, *p=0.0181, Ppp3ca: t8=2.418, *p=0.0210, Arid5b: t9=1.754, *p=0.0567, Pten: t9=1.936, *p=0.0424). Actin was used as a normalization control. h, Immunofluorescence images (scale bars equal 20 μm) of RN46A-B14 cells infected during differentiation with lentiviruses expressing either wildtype H3.3-HA or H3.3Q5A-HA. Results confirmed on ≥ 3 independent coverslips/viral treatment. i, Neurite outgrowth analysis examining RN46A-B14 cellular length post-differentiation (n=54 H3.3 WT vs. 44 H3.3 Q5A expressing cells; two-tailed student’s t-test, t96=4.664, ****p<0.0001). Data presented as average ± SEM.
Extended Data Figure 9. Genome-wide associations between H3K4me3Q5ser and TFIID.
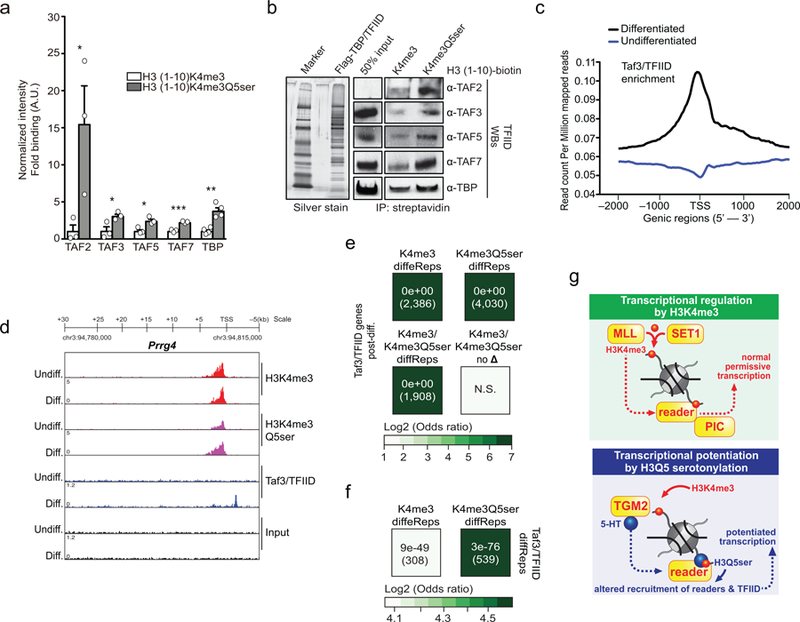
a, Western blot quantifications related to Fig. 4a (Student’s t-tests, two-sided) of modified H3 (1–10) peptide IPs from HeLa nuclear extracts (TAF2 – n=3/peptide; t4=2.724, *p=0.05, TAF3 - n=3/peptide; t4=2.920, *p=0.04, TAF5 - n=3/peptide; t4=3.685, *p=0.02, TAF7 - n=3/peptide; t4=8.885, ***p=0.0009, TBP – n=4/peptide; t6=5.383, **p=0.0017). b, Modified H3 (1–10) peptide IPs against purified TFIID from Flag tagged TBP expressing soluble HeLa nuclear extracts (left, silver stain of the purified complex), followed by WBs (right). Inputs are provided (n=1/protein examined). c, Gene plot (ngs.plot) of Taf3/TFIID enrichment (Log2 fold change vs. input) comparing signals pre- vs. post-differentiation (n=3 independent biological replicates/differentiation states). d, IGV genome browser tracks of the Prrg4 locus for H3K4me3, H3K4me3Q5ser and Taf3/TFIID (vs. DNA input) in RN46A-B14 cells pre- and post differentiation (example locus was chosen based upon MACSv2.1.1- and diffReps-based statistical comparisons). Odds ratio analysis (using Fisher’s exact tests) of overlapping genes displaying differential H3K4me3 or H3K4me3Q5ser enrichment (or those genes containing differential sites for both or neither of the two marks, FDR<0.05, FC>1.2) vs. e, Taf3 peaks (n=3 independent biological replicates/differentiation state, MACSv2.1.1, FDR<0.05, FC>1.2 cutoffs applied after adjusting for multiple comparisons; normalized to respective DNA inputs) or f, differential Taf3/TFIID enrichment (n=3 independent biological replicates/differentiation state, diffReps, FDR<0.05, FC>1.2 cutoffs applied after adjusting for multiple comparisons) post-differentiation. Insert numbers indicate respective p values for associations, followed by the number of protein-coding genes overlapping per significant category. g, Model of the impact of Q5ser on K4me3-mediated gene expression in vivo – our data suggest that the presence of combinatorial H3K4me3Q5ser alters interactions with certain K4me3 “reader” proteins, such as the TFIID complex, to potentiate/stabilize permissive gene expression in mammalian cells.
Supplementary Material
Acknowledgements
We would also like to thank Drs. Ross Cagan (ISMMS), Jeremy Coplan (SUNY Downstate) and Carol Tamminga (UTSW) for providing Drosophila, Macaque and human samples, respectively, for analysis of H3K4me3Q5ser in Fig. 1e. Dr. Gail Johnson (University of Rochester Medical Center) kindly provided us with wildtype and catalytically dead TGM2 constructs. This work was supported by grants from the National Institutes of Health: DP1 DA042078 (I.M.), R21DA044767 (I.M.), P50 MH096890 (I.M.), R37 GM086868 (T.W.M.), P01 CA196539 (T.W.M. & B.A.G.), R01 GM110174 (B.A.G.), R21 DA040837 (B.A.G.), R01 CA129325 (R.G.R.), R01 CA204639 (R.G.R.), T32 DA007135 (R.M.B.), as well as awards from: MQ Mental Health Research Charity, MQ15FIP100011 (I.M.), Alfred P. Sloan Foundation, Fellowship in Neuroscience (I.M.), the JPB Foundation (F.H.G.), the Bob and Mary Jane Engman Foundation (F.H.G.) and the Volkswagen Foundation (N.A.).
d tissues from Tph1/2 KO mice. L.A.F., H.L. T.W.M. & I.M. wrote the manuscript.
Footnotes
Competing interest statement
The authors declare no competing financial interests.
Contributor Information
Lorna A. Farrelly, Fishberg Department of Neuroscience, Friedman Brain Institute, Icahn School of Medicine at Mount Sinai, New York, New York 10029, USA
Robert E. Thompson, Department of Chemistry, Princeton University, Princeton, New Jersey 08540, USA
Shuai Zhao, Beijing Advanced Innovation Center for Structural Biology, MOE Key Laboratory of Protein Sciences, Department of Basic Medical Sciences, School of Medicine, Tsinghua University, Beijing 100084, China, Tsinghua-Peking Joint Center for Life Sciences, Tsinghua University, Beijing 100084, China.
Ashley E. Lepack, Fishberg Department of Neuroscience, Friedman Brain Institute, Icahn School of Medicine at Mount Sinai, New York, New York 10029, USA
Yang Lyu, Fishberg Department of Neuroscience, Friedman Brain Institute, Icahn School of Medicine at Mount Sinai, New York, New York 10029, USA.
Natarajan V. Bhanu, Epigenetics Institute, Department of Biochemistry and Biophysics, Perelman School of Medicine, University of Pennsylvania, Philadelphia, PA 19104, USA
Baichao Zhang, Beijing Advanced Innovation Center for Structural Biology, MOE Key Laboratory of Protein Sciences, Department of Basic Medical Sciences, School of Medicine, Tsinghua University, Beijing 100084, China, Tsinghua-Peking Joint Center for Life Sciences, Tsinghua University, Beijing 100084, China.
Yong-Hwee E. Loh, Fishberg Department of Neuroscience, Friedman Brain Institute, Icahn School of Medicine at Mount Sinai, New York, New York 10029, USA
Aarthi Ramakrishnan, Fishberg Department of Neuroscience, Friedman Brain Institute, Icahn School of Medicine at Mount Sinai, New York, New York 10029, USA.
Krishna C. Vadodaria, Laboratory of Genetics, The Salk Institute for Biological Sciences, La Jolla, CA 92037, USA
Kelly J. Heard, Laboratory of Genetics, The Salk Institute for Biological Sciences, La Jolla, CA 92037, USA
Galina Erikson, Laboratory of Genetics, The Salk Institute for Biological Sciences, La Jolla, CA 92037, USA.
Tomoyoshi Nakadai, Laboratory of Biochemistry and Molecular Biology, The Rockefeller University, New York, NY 10065, USA.
Ryan M. Bastle, Fishberg Department of Neuroscience, Friedman Brain Institute, Icahn School of Medicine at Mount Sinai, New York, New York 10029, USA
Bradley J. Lukasak, Department of Chemistry, Princeton University, Princeton, New Jersey 08540, USA
Henry Zebroski, III, The Rockefeller University Proteomics Resource Center, The Rockefeller University, New York, NY 10065, USA.
Natalia Alenina, Max-Delbrück-Center for Molecular Medicine (MDC), 13125 Berlin, Germany.
Michael Bader, Max-Delbrück-Center for Molecular Medicine (MDC), 13125 Berlin, Germany.
Olivier Berton, Fishberg Department of Neuroscience, Friedman Brain Institute, Icahn School of Medicine at Mount Sinai, New York, New York 10029, USA.
Robert G. Roeder, Laboratory of Biochemistry and Molecular Biology, The Rockefeller University, New York, NY 10065, USA
Henrik Molina, The Rockefeller University Proteomics Resource Center, The Rockefeller University, New York, NY 10065, USA.
Fred H. Gage, Laboratory of Genetics, The Salk Institute for Biological Sciences, La Jolla, CA 92037, USA
Li Shen, Fishberg Department of Neuroscience, Friedman Brain Institute, Icahn School of Medicine at Mount Sinai, New York, New York 10029, USA.
Benjamin A. Garcia, Epigenetics Institute, Department of Biochemistry and Biophysics, Perelman School of Medicine, University of Pennsylvania, Philadelphia, PA 19104, USA
Haitao Li, Beijing Advanced Innovation Center for Structural Biology, MOE Key Laboratory of Protein Sciences, Department of Basic Medical Sciences, School of Medicine, Tsinghua University, Beijing 100084, China, Tsinghua-Peking Joint Center for Life Sciences, Tsinghua University, Beijing 100084, China.
Tom W. Muir, Department of Chemistry, Princeton University, Princeton, New Jersey 08540, USA
Ian Maze, Fishberg Department of Neuroscience, Friedman Brain Institute, Icahn School of Medicine at Mount Sinai, New York, New York 10029, USA; Department of Pharmacological Sciences, Icahn School of Medicine at Mount Sinai, New York, New York 10029, USA.
References
- 1.Kouzarides T Chromatin modifications and their function. Cell 128, 693–705, doi:S0092–8674(07)00184–5 [pii] 10.1016/j.cell.2007.02.005 (2007). [DOI] [PubMed] [Google Scholar]
- 2.Jenuwein T & Allis CD Translating the histone code. Science 293, 1074–1080, doi: 10.1126/science.1063127 293/5532/1074 [pii] (2001). [DOI] [PubMed] [Google Scholar]
- 3.Strahl BD & Allis CD The language of covalent histone modifications. Nature 403, 41–45, doi: 10.1038/47412 (2000). [DOI] [PubMed] [Google Scholar]
- 4.Lauberth SM et al. H3K4me3 interactions with TAF3 regulate preinitiation complex assembly and selective gene activation. Cell 152, 1021–1036, doi: 10.1016/j.cell.2013.01.052 (2013). [DOI] [PMC free article] [PubMed] [Google Scholar]
- 5.Vermeulen M et al. Selective anchoring of TFIID to nucleosomes by trimethylation of histone H3 lysine 4. Cell 131, 58–69, doi: 10.1016/j.cell.2007.08.016 (2007). [DOI] [PubMed] [Google Scholar]
- 6.van Ingen H et al. Structural insight into the recognition of the H3K4me3 mark by the TFIID subunit TAF3. Structure 16, 1245–1256, doi: 10.1016/j.str.2008.04.015 (2008). [DOI] [PubMed] [Google Scholar]
- 7.Colgan LA, Putzier I & Levitan ES Activity-dependent vesicular monoamine transporter-mediated depletion of the nucleus supports somatic release by serotonin neurons. J Neurosci 29, 15878–15887, doi: 10.1523/JNEUROSCI.4210-09.2009 (2009). [DOI] [PMC free article] [PubMed] [Google Scholar]
- 8.Young AB, Pert CD, Brown DG, Taylor KM & Snyder SH Nuclear localization of histamine in neonatal rat brain. Science 173, 247–249 (1971). [DOI] [PubMed] [Google Scholar]
- 9.Walther DJ et al. Serotonylation of small GTPases is a signal transduction pathway that triggers platelet alpha-granule release. Cell 115, 851–862 (2003). [DOI] [PubMed] [Google Scholar]
- 10.Watts SW, Priestley JR & Thompson JM Serotonylation of vascular proteins important to contraction. PLoS One 4, e5682, doi: 10.1371/journal.pone.0005682 (2009). [DOI] [PMC free article] [PubMed] [Google Scholar]
- 11.Hummerich R, Thumfart JO, Findeisen P, Bartsch D & Schloss P Transglutaminase-mediated transamidation of serotonin, dopamine and noradrenaline to fibronectin: evidence for a general mechanism of monoaminylation. FEBS Lett 586, 3421–3428, doi: 10.1016/j.febslet.2012.07.062 (2012). [DOI] [PubMed] [Google Scholar]
- 12.Ballestar E, Abad C & Franco L Core histones are glutaminyl substrates for tissue transglutaminase. J Biol Chem 271, 18817–18824 (1996). [DOI] [PubMed] [Google Scholar]
- 13.Kim JH et al. Histone cross-linking by transglutaminase. Biochem Biophys Res Commun 293, 1453–1457, doi: 10.1016/S0006-291X(02)00393-5 (2002). [DOI] [PubMed] [Google Scholar]
- 14.Sileno S et al. A possible role of transglutaminase 2 in the nucleus of INS-1E and of cells of human pancreatic islets. J Proteomics 96, 314–327, doi: 10.1016/j.jprot.2013.11.011 (2014). [DOI] [PMC free article] [PubMed] [Google Scholar]
- 15.Lin JC et al. Characterization of protein serotonylation via bioorthogonal labeling and enrichment. J Proteome Res 13, 3523–3529, doi: 10.1021/pr5003438 (2014). [DOI] [PubMed] [Google Scholar]
- 16.Nurminskaya MV & Belkin AM Cellular functions of tissue transglutaminase. Int Rev Cell Mol Biol 294, 1–97, doi: 10.1016/B978-0-12-394305-7.00001-X (2012). [DOI] [PMC free article] [PubMed] [Google Scholar]
- 17.Hummerich R, Costina V, Findeisen P & Schloss P Monoaminylation of Fibrinogen and Glia-Derived Proteins: Indication for Similar Mechanisms in Posttranslational Protein Modification in Blood and Brain. ACS Chem Neurosci 6, 1130–1136, doi: 10.1021/cn5003286 (2015). [DOI] [PubMed] [Google Scholar]
- 18.Lu J et al. Generation of serotonin neurons from human pluripotent stem cells. Nat Biotechnol 34, 89–94, doi: 10.1038/nbt.3435 (2016). [DOI] [PMC free article] [PubMed] [Google Scholar]
- 19.Shen L et al. diffReps: detecting differential chromatin modification sites from ChIP-seq data with biological replicates. PLoS One 8, e65598, doi: 10.1371/journal.pone.0065598 (2013). [DOI] [PMC free article] [PubMed] [Google Scholar]
- 20.Chen EY et al. Enrichr: interactive and collaborative HTML5 gene list enrichment analysis tool. BMC Bioinformatics 14, 128, doi: 10.1186/1471-2105-14-128 (2013). [DOI] [PMC free article] [PubMed] [Google Scholar]
- 21.Kuleshov MV et al. Enrichr: a comprehensive gene set enrichment analysis web server 2016 update. Nucleic Acids Res 44, W90–97, doi: 10.1093/nar/gkw377 (2016). [DOI] [PMC free article] [PubMed] [Google Scholar]
- 22.Daubert EA & Condron BG Serotonin: a regulator of neuronal morphology and circuitry. Trends Neurosci 33, 424–434, doi: 10.1016/j.tins.2010.05.005 (2010). [DOI] [PMC free article] [PubMed] [Google Scholar]
- 23.White LA et al. Distinct regulatory pathways control neurofilament expression and neurotransmitter synthesis in immortalized serotonergic neurons. J Neurosci 14, 6744–6753 (1994). [DOI] [PMC free article] [PubMed] [Google Scholar]
- 24.Maze I et al. Critical Role of Histone Turnover in Neuronal Transcription and Plasticity. Neuron 87, 77–94, doi: 10.1016/j.neuron.2015.06.014 (2015). [DOI] [PMC free article] [PubMed] [Google Scholar]
- 25.Tessarz P et al. Glutamine methylation in histone H2A is an RNA-polymerase-I-dedicated modification. Nature 505, 564–568, doi: 10.1038/nature12819 (2014). [DOI] [PMC free article] [PubMed] [Google Scholar]
- 26.Eaton MJ & Whittemore SR Autocrine BDNF secretion enhances the survival and serotonergic differentiation of raphe neuronal precursor cells grafted into the adult rat CNS. Exp Neurol 140, 105–114, doi: 10.1006/exnr.1996.0121 (1996). [DOI] [PubMed] [Google Scholar]
- 27.Ollivier N et al. Tidbits for the synthesis of bis(2-sulfanylethyl)amido (SEA) polystyrene resin, SEA peptides and peptide thioesters. J Pept Sci 20, 92–97, doi: 10.1002/psc.2580 (2014). [DOI] [PubMed] [Google Scholar]
- 28.Dann GP et al. ISWI chromatin remodellers sense nucleosome modifications to determine substrate preference. Nature 548, 607–611, doi: 10.1038/nature23671 (2017). [DOI] [PMC free article] [PubMed] [Google Scholar]
- 29.Nguyen UT et al. Accelerated chromatin biochemistry using DNA-barcoded nucleosome libraries. Nat Methods 11, 834–840, doi: 10.1038/nmeth.3022 (2014). [DOI] [PMC free article] [PubMed] [Google Scholar]
- 30.Simon MD & Shokat KM A method to site-specifically incorporate methyl-lysine analogues into recombinant proteins. Methods in enzymology 512, 57–69, doi: 10.1016/B978-0-12-391940-3.00003-2 (2012). [DOI] [PubMed] [Google Scholar]
- 31.Debelouchina GT, Gerecht K & Muir TW Ubiquitin utilizes an acidic surface patch to alter chromatin structure. Nat Chem Biol 13, 105–110, doi: 10.1038/nchembio.2235 (2017). [DOI] [PMC free article] [PubMed] [Google Scholar]
- 32.Lowary PT & Widom J New DNA sequence rules for high affinity binding to histone octamer and sequence-directed nucleosome positioning. J Mol Biol 276, 19–42, doi: 10.1006/jmbi.1997.1494 (1998). [DOI] [PubMed] [Google Scholar]
- 33.Dyer PN et al. Reconstitution of nucleosome core particles from recombinant histones and DNA. Methods in enzymology 375, 23–44 (2004). [DOI] [PubMed] [Google Scholar]
- 34.Wojcik F et al. Functional crosstalk between histone H2B ubiquitylation and H2A modifications and variants. Nat Commun 9, 1394, doi: 10.1038/s41467-018-03895-5 (2018). [DOI] [PMC free article] [PubMed] [Google Scholar]
- 35.Peterson AC, Russell JD, Bailey DJ, Westphall MS & Coon JJ Parallel reaction monitoring for high resolution and high mass accuracy quantitative, targeted proteomics. Mol Cell Proteomics 11, 1475–1488, doi: 10.1074/mcp.O112.020131 (2012). [DOI] [PMC free article] [PubMed] [Google Scholar]
- 36.Dignam JD, Lebovitz RM & Roeder RG Accurate transcription initiation by RNA polymerase II in a soluble extract from isolated mammalian nuclei. Nucleic Acids Res 11, 1475–1489 (1983). [DOI] [PMC free article] [PubMed] [Google Scholar]
- 37.Rappsilber J, Mann M & Ishihama Y Protocol for micro-purification, enrichment, pre-fractionation and storage of peptides for proteomics using StageTips. Nat Protoc 2, 1896–1906, doi: 10.1038/nprot.2007.261 (2007). [DOI] [PubMed] [Google Scholar]
- 38.Cox J et al. Accurate proteome-wide label-free quantification by delayed normalization and maximal peptide ratio extraction, termed MaxLFQ. Mol Cell Proteomics 13, 2513–2526, doi: 10.1074/mcp.M113.031591 (2014). [DOI] [PMC free article] [PubMed] [Google Scholar]
- 39.Kall L, Canterbury JD, Weston J, Noble WS & MacCoss MJ Semi-supervised learning for peptide identification from shotgun proteomics datasets. Nat Methods 4, 923–925, doi: 10.1038/nmeth1113 (2007). [DOI] [PubMed] [Google Scholar]
- 40.Tyanova S et al. The Perseus computational platform for comprehensive analysis of (prote)omics data. Nat Methods 13, 731–740, doi: 10.1038/nmeth.3901 (2016). [DOI] [PubMed] [Google Scholar]
- 41.Schwanhausser B et al. Global quantification of mammalian gene expression control. Nature 473, 337–342, doi: 10.1038/nature10098 (2011). [DOI] [PubMed] [Google Scholar]
- 42.Sidoli S, Bhanu NV, Karch KR, Wang X & Garcia BA Complete Workflow for Analysis of Histone Post-translational Modifications Using Bottom-up Mass Spectrometry: From Histone Extraction to Data Analysis. J Vis Exp, doi: 10.3791/54112 (2016). [DOI] [PMC free article] [PubMed] [Google Scholar]
- 43.Tsankova NM et al. Sustained hippocampal chromatin regulation in a mouse model of depression and antidepressant action. Nat Neurosci 9, 519–525, doi:nn1659 [pii] 10.1038/nn1659 (2006). [DOI] [PubMed] [Google Scholar]
- 44.Zhang Y et al. Model-based analysis of ChIP-Seq (MACS). Genome Biol 9, R137, doi:gb-2008–9-9-r137 [pii] 10.1186/gb-2008-9-9-r137 (2008). [DOI] [PMC free article] [PubMed] [Google Scholar]
- 45.Trapnell C, Pachter L & Salzberg SL TopHat: discovering splice junctions with RNA-Seq. Bioinformatics 25, 1105–1111, doi: 10.1093/bioinformatics/btp120 (2009). [DOI] [PMC free article] [PubMed] [Google Scholar]
- 46.Love MI, Huber W, et al. Moderated estimation of fold change and dispersion for RNA-Seq data with DESeq2. bioRxiv beta, doi: 10.1101/002832 (2014). [DOI] [PMC free article] [PubMed] [Google Scholar]
- 47.Gundemir S & Johnson GV Intracellular localization and conformational state of transglutaminase 2: implications for cell death. PLoS One 4, e6123, doi: 10.1371/journal.pone.0006123 (2009). [DOI] [PMC free article] [PubMed] [Google Scholar]
- 48.Vizcaino JA et al. A guide to the Proteomics Identifications Database proteomics data repository. Proteomics 9, 4276–4283, doi: 10.1002/pmic.200900402 (2009). [DOI] [PMC free article] [PubMed] [Google Scholar]
- 49.Vizcaino JA et al. 2016 update of the PRIDE database and its related tools. Nucleic Acids Res 44, D447–456, doi: 10.1093/nar/gkv1145 (2016). [DOI] [PMC free article] [PubMed] [Google Scholar]
Associated Data
This section collects any data citations, data availability statements, or supplementary materials included in this article.
Supplementary Materials
Data Availability Statement
Data from ChIP- and RNA-seq experiments have been deposited in the National Center for Biotechnology Information Gene Expression Omnibus (GEO) database under accession numbers GSE106495 and GSE117910. The mass spectrometry proteomics data have been deposited in the ProteomeXchange Consortium via the PRIDE48,49 partner repository with the dataset identifier PXD008106. Additional raw data files are available on https://chorusproject.org under project no. 1513. We declare that the data supporting findings for this study are available within the article and Supplementary Information (Supplementary Figure 1). Related data are available from the corresponding author upon reasonable request. No restrictions on data availability apply.