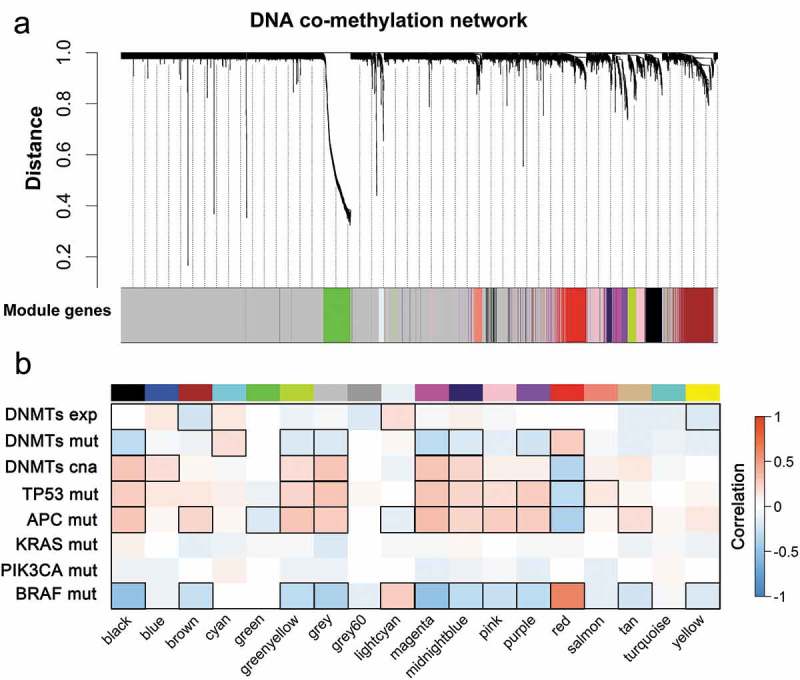
Figure 2.

WGCNA reveals co-methylated modules in CRC. (a) WGCNA clustered 7,716 genes by promoter DNA methylation values across 214 tumor samples based on topological overlap (TO) distance. The y-axis height corresponds to the distance (1-TO). The x-panel describes modules defined by dynamic tree cutting and the grey color indicates genes not belonging to any co-methylated modules. (b) Heatmap of modules correlated with molecular features of CRC. Modules are outlined based on their correlation to molecular phenotypes (exp, expression; mut, mutation; cna, copy number alteration) when adjusted for a P-value < 0.05.
