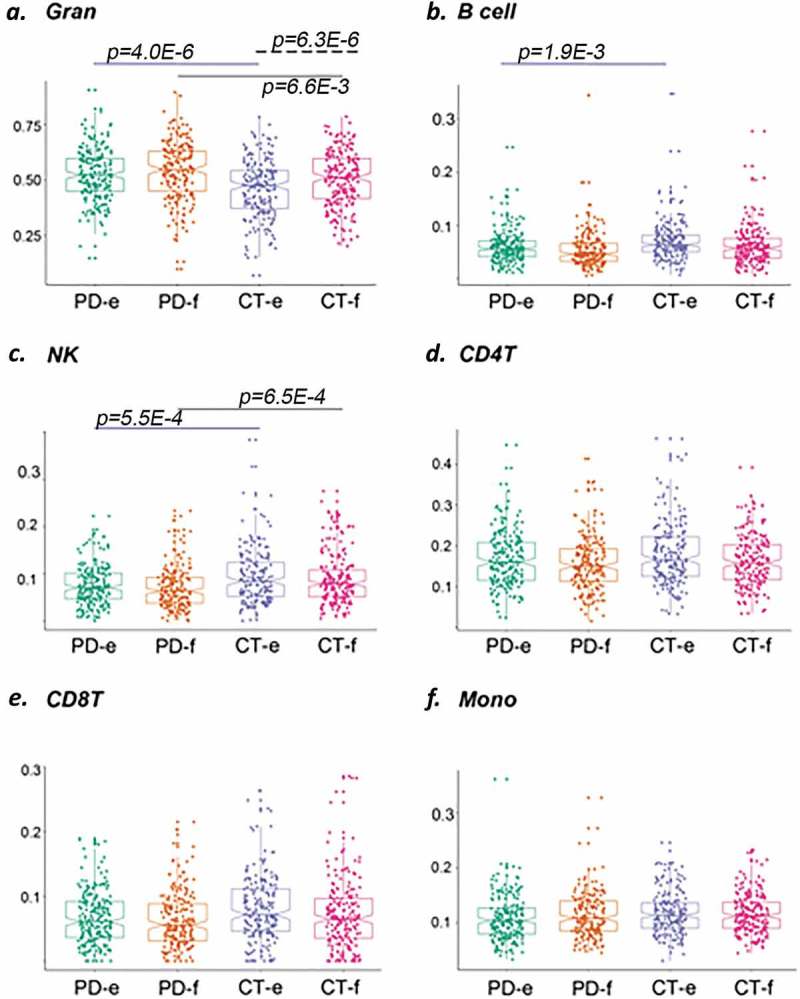
Figure 1.

Comparison of individual cell type across control (CT) and PD groups at enrollment (e) and follow-up (f). Abundance of specific blood cell types was estimated based on unique methylation markers for cell identity. Shown in (a) granulocytes, in (b) B cells, in (c) natural killer cells, in (d) CD4T cells, in (e) CD8T cells, and in (f) monocytes. Blue solid line indicates comparison between PD cases vs. CT subjects at enrollment; black solid line indicates comparison between PD cases vs. CT subjects at follow-up; dash blue line indicates comparison between PD cases at follow-up vs. enrollment time points; dash black line indicates comparison between CT subjects at follow-up vs. enrollment time points. p-Value for the differences in cell composition estimates across groups as per Wilcoxon test after correction for multiple observations is indicated.
